Continued interest rate concerns


This week's case study focuses on Ericsson, an OMX company which reported better-than-expected results for the second quarter of 2026. However its share price has fallen since then. However, the share price now appears to be entering a positive recovery phase. The US Treasury’s intervention in the bond market has shone a spotlight on the rapidly rising interest costs associated with US government debt.
Case of the week: Undervalued stock in a consolidated sector
Over the past two decades, the telecommunications equipment industry has experienced substantial consolidation, resulting in the exit of several major North American players, including Lucent, Motorola and Nortel. . successfully navigated this period by maintaining a strong focus on mobile network infrastructure and implementing significant cost-efficiency measures, particularly during the telecoms crisis around the turn of the millennium. Today, two of Ericsson’s main competitors are the Chinese companies Huawei and ZTE. This gives Ericsson an advantage in the US market, where it is not considered as a security risk, unlike the Chinese firms. However, this has made it more challenging for Ericsson to grow in the Chinese market.
The oligopolistic nature of the telecommunications supplier sector, with Finland’s Nokia as a major complementary competitor, positions Ericsson and the rest of the industry to maintain high and stable operating margins over the long term. Assuming all other factors remain equal, this also justifies a higher valuation, as the risk of setbacks to this stable earnings capacity is reduced.
On 14 July, Ericsson reported Q2 2026 earnings of SEK 6.88 billion. This exceeded the analyst consensus by 3%. This was achieved despite revenues of SEK 52.7 billion being around 2% lower than expected. The adjusted gross margin in Q2 2026 was 48%, an increase of two percentage points after accounting for the positive effect of a one-off settlement relating to patents and licences in 2025.
Underlying performance at the divisional level was strong, particularly within the Networks and Cloud divisions. The outlook for Q3 of 2026 indicates a sales increase slightly higher than normal for Networks, with a gross margin expected to be in the range of 48–50%. Meanwhile, Cloud revenue is expected to grow in line with normal seasonal patterns.
Despite a significant increase in working capital ahead of scheduled deliveries in the second half of 2026, Ericsson’s cash flow remained positive during the second quarter of 2026. The company has noted rising component costs and is taking measures to offset them, including price increases. Overall, Ericsson delivered a strong report for Q2 2026, though this did not significantly alter analysts' earnings estimates.
Based on the current share price, Ericsson's market capitalisation is around SEK 329 billion. With a net cash position of SEK 59.8 billion as of 30 June 2026, the company boasts a robust financial standing. On a debt-free basis, it has an EV/EBIT valuation of approximately 8x on a debt-free basis, along with a P/E ratio of around 13.
Related Products
Ericsson B (in SEK), one-year daily chart
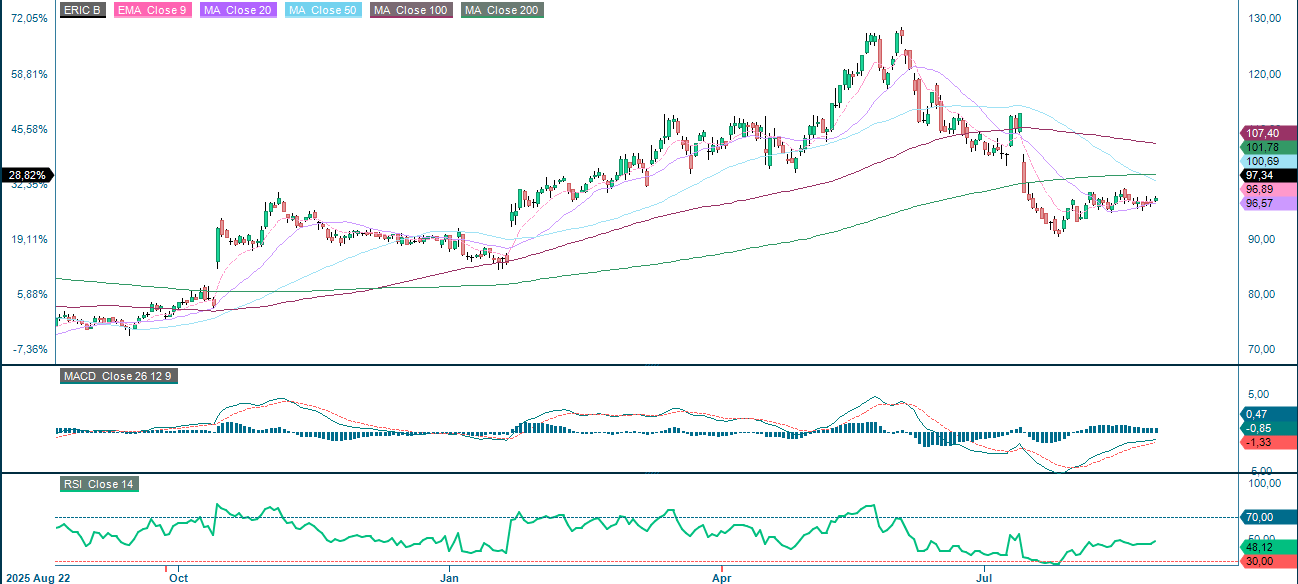
After peaking at just over SEK 127 on 2 June, the LME share price fell to around SEK 110 when the Q2 report was released on 14 July. The share then fell to a low of around SEK 91.5 on 24 July, before recovering modestly to around SEK 98 per share at the time of writing.
Ericsson B (in SEK), five-year weekly chart

Macro comments
On Tuesday 18 August, the US 30-year Treasury bond reached its highest level since 2007, at the same time as US debt surpassed $40 trillion. The following day, the bond recovered after the US Treasury announced plans to double the size of liquidity-supporting buybacks of long-dated bonds. The yield on the US 30-year bond fell by almost 10 basis points. However, the initial enthusiasm in the bond market over Treasury Secretary Bessent’s liquidity support proved short-lived. This is because investors are uncertain whether the US government has a plan to reduce its increasing debt.
The US has imposed tariffs of 50% tariffs on a range of Canadian goods, which are expected to generate approximately $20 billion in revenue. So far, the escalation in the trade war does not appear to be having a significant impact on global stock markets. Despite higher energy prices and rising long-term interest rates, stock markets in Europe and the US increased on Friday, 21 August.
Calendar
On Wednesday, 26 August, interim reports from Hewlett-Packard and Nvidia are expected. Nvidia's outlook will be crucial for valuing the AI company universe. Turning to the day's macroeconomic agenda, Sweden’s producer price index for July will be analysed. The US will then release preliminary Q2 GDP figures, personal consumption expenditure (PCE) inflation data for July and weekly oil inventory data from the Department of Energy.
On Thursday, 27 August, interim reports will be released by the Swedish companies Elekta and Lundbergs, as well as by GAP in the US. The day's macroeconomic news begins with Sweden’s July trade balance and Germany’s September GfK consumer confidence figures. The ECB will publish the minutes from its most recent interest rate meeting, after which the focus will be on the US for data on the goods trade balance for July (see the five-year chart of deficits below), wholesale inventories for July, weekly jobless claims and the Kansas Fed Manufacturing Index for August.
On Friday 28 August, thefocus will be on the macroeconomic agenda, with the release of the August PMI and Q2 GDP figures for France, and the August CPI figure for Spain. Next comesthe Eurozone economic sentiment indicator for August. Then, the focus will be turned to North America, where Canada’s Q2 GDP data will be released. This will be followed by the Chicago PMI and the Michigan Consumer Sentiment Index, both of which are for August, as well as an annual revision of US non-farm payroll data.
US Goods Trade Balance (in billions of USD), monthly five-year chart

Is the long DAX/short OMXS30 spread the one to watch this week?
The S&P 500 remains under pressure due to the breakdown of ceasefire talks with Iran and continued elevated bond yields. As can be seen in the chart below, the MACD has generated a soft sell signal while the index is testing support at its MA20. The next support level is around 7,610. Breaking below this level would open the way towards the MA50, which is currently at 7,550. However, US yields are falling slightly. Contrarian investors may view the current levels as an opportunity to prepare for a potential rebound, with an initial upside target of 7,800.
Related Products
S&P500 (in USD), one-year daily chart

S&P500 (in USD), five-year weekly chart

Technology stocks are under pressure, with Nvidia and others falling amid reports. The MACD has generated a soft sell signal, while the initial downside support level is between 28,663 and 28,750, with the 100-day moving average at 28,661. Breaking below this area could open the way towards 28,100. On the upside, the index faces several moving averages, as well as resistance around 29,580.
Related Products
Nasdaq 100 (in USD), one-year daily chart

Nasdaq 100 (in USD), five-year weekly chart

The OMXS30 in Sweden has bounced back strongly from support at around 3,225. However, given its recent strength, it seems that the upside is limited to the initial highs of around 3,327.
Related Products
OMX30 (in SEK), one-year daily chart

OMX30 (in SEK), five-year weekly chart

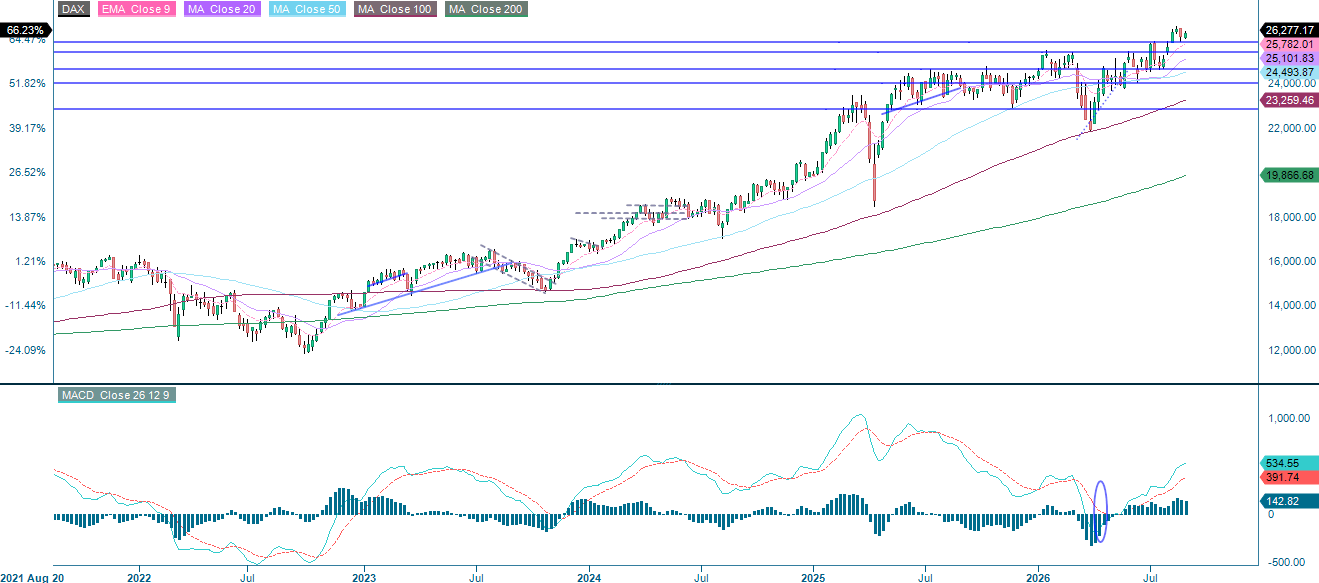
Meanwhile, in Germany, the DAX is currently trading above the MA20 and EMA9, while the MACD has generated a mild sell signal. From a risk-mitigating perspective, therefore, a long DAX, short OMXS30 strategy may be interesting.
Related Products
DAX (in EUR), one-year daily chart

DAX (in EUR), five-year weekly chart
The full name for abbreviations used in the previous text:
EMA 9: 9-day Exponential Moving Average
Fibonacci: There are several Fibonacci lines used in technical analysis. Fibonacci numbers are a sequence in which each successive number is the sum of the two previous numbers.
MA20: 20-day Moving Average
MA50: 50-day Moving Average
MA100: 100-day Moving Average
MA200: 200-day Moving Average
MACD: Moving Average Convergence Divergence
Risks
Credit risk of the issuer:
Investors in the products are exposed to the risk that the Issuer or the Guarantor may not be able to meet its obligations under the products. A total loss of the invested capital is possible. The products are not subject to any deposit protection.
Currency risk:
If the product currency differs from the currency of the underlying asset, the value of a product will also depend on the exchange rate between the respective currencies. As a result, the value of a product can fluctuate significantly.
Market risk:
The value of the products can fall significantly below the purchase price due to changes in market factors, especially if the value of the underlying asset falls. The products are not capital-protected
Product costs:
Product and possible financing costs reduce the value of the products.
Risk with leverage products:
Due to the leverage effect, there is an increased risk of loss (risk of total loss) with leverage products, e.g. Bull & Bear Certificates, Warrants and Mini Futures.
External author:
This information is in the sole responsibility of the guest author and does not necessarily represent the opinion of Bank Vontobel Europe AG or any other company of the Vontobel Group. This information is sponsored by Bank Vontobel Europe AG, which may be a counterparty to transactions involving the financial instruments discussed in this information. The further development of the index or a company as well as its share price depends on a large number of company-, group- and sector-specific as well as economic factors. When forming his investment decision, each investor must take into account the risk of price losses. Please note that investing in these products will not generate ongoing income.
The products are not capital protected, in the worst case a total loss of the invested capital is possible. In the event of insolvency of the issuer and the guarantor, the investor bears the risk of a total loss of his investment. In any case, investors should note that past performance and/or analysts' opinions are no adequate indicator of future performance. The performance of the underlyings depends on a variety of economic, entrepreneurial and political factors that should be taken into account in the formation of a market expectation.
Disclaimer:
This information is neither an investment advice nor an investment or investment strategy recommendation, but advertisement. The complete information on the products (securities) mentioned herein, in particular the structure and risks associated with an investment, are described in the base prospectus, together with any supplements, as well as the final terms relating to the securities. The base prospectus and final terms constitute the solely binding sales documents for the products mentioned herein. It is recommended that potential investors read these documents before making any investment decision. The documents and the key information document are published on the website of the issuer, Vontobel Financial Products GmbH, Bockenheimer Landstrasse 24, 60323 Frankfurt am Main, Germany, on https://prospectus.vontobel.com and are available from the issuer free of charge. The approval of the prospectus should not be understood as an endorsement of the securities. The securities are products that are not simple and may be difficult to understand. This information includes or relates to figures of past performance. Past performance is not a reliable indicator of future performance. This information may only be distributed or published in countries where such distribution or publication is permitted by applicable law. As stated in the relevant base prospectus, the distribution of the securities mentioned in this information is subject to restrictions in certain jurisdictions. This advertisement may not be reproduced or redistributed without prior permission by Vontobel.
© Bank Vontobel Europe AG and / or affiliated companies. All rights reserved.