Uncertainty over the Iran war persists


This week's case study focuses on the VIX index and several upcoming autumn events that could cause volatility in the global stock market. These include the US midterm elections and inflation resulting from renewed hostilities between the US and Iran and its proxies. There has also been some uncertainty surrounding AI-related stocks. From a technical perspective, US equities have already come under some pressure.
Case of the week: The VIX remains quiet ahead of a busy autumn
In recent weeks, equity markets have become more positive following a strong earnings season and moderate inflation figures. Consequently, implied volatility has decreased, suggesting complacency among many investors. However, rising interest rates in the US suggest that bond investors are still concerned about inflation. Furthermore, several political and macroeconomic events over the next few months could disrupt the current summer lull in the equity markets.
The 2026 Jackson Hole Economic Policy Symposium, organised by the Kansas City Fed, is scheduled for 27–29 August. This event is important because markets can use the Chair's remarks, the research agenda, and surrounding commentary to reassess policy direction, inflation tolerance, and financial conditions. A VIX-positive outcome could, for example, be a more hawkish message on inflation persistence. According to the CME Fedwatch, there is currently around a 30 per cent chance of a rate hike following the September FOMC meeting, down from 52 per cent a week ago.
The 2026 US midterm elections are scheduled for 3 November. While the outcome on election may be less important than the build-up, factors to consider include polling shifts, the probability of control of Congress, fiscal proposals, rhetoric on taxes and tariffs, and the possibility of a disputed or delayed result. While elections alone do not guarantee a sustained spike in the VIX spike, the risk increases when political uncertainty coincides with stretched equity valuations, high concentration or an already fragile Treasury market.
The concentrationof the equity market in a relatively small number of large technology and AI-related companies can also amplify volatility. Not only should headline earnings misses that should be monitored, but also lower-than-expected cloud or AI capital expenditure guidance andr evidence that AI spending is not translating into near-term revenue or margin expansion.
Finally, the ongoing risk remains that the US–Iran conflict could cause further energy or shipping disruptions. This risk has increased as the Houthi movement in Yemen has made shipping routes from the Red Sea more uncertain.
From a seasonal perspective, September has been the weakest month of the year for the S&P 500 over the last 20 years.
S&P500, average monthly performance last 20 years

Related Products
VIX (in %), one-year daily chart

The five-year chart shows that current levels are near the lower end of the observed range. Several previous volatility shocks demonstrate the familiar VIX pattern of long periods of compression followed by abrupt, non-linear spikes. While a low reading itself is not a timing signal, it does make the payoff more attractive if a catalyst forces equity-index protection higher.
VIX (in %), five-year weekly chart

Macro comments
In July, US core inflation stood at 0.2%, corresponding to an annual rate of 2.5%. On Wednesday, August 12, the US bond market priced in a 35% probability of the Fed raising its policy interest rate at the September meeting following the release of the inflation figure that day. Should the conflict between the US and Iran continue into autumn, the risk of inflation would increase, resulting in higher oil prices, fgreater transportation costs, and increased prices for exported goods.
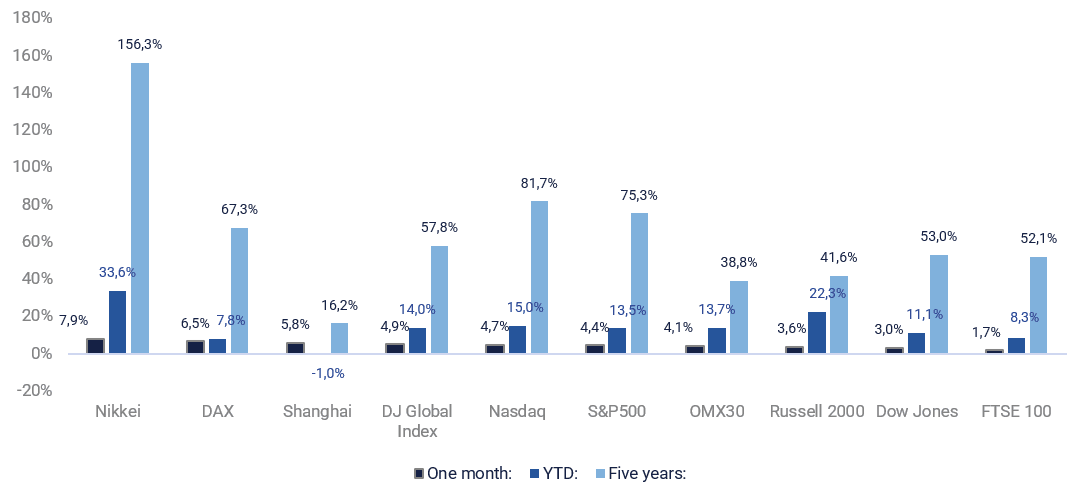
As the graph below shows, the Nikkei, DAX and SSE Composite (Shanghai) indices have been the top performers among all the major global stock market indices over the past month. The three strongest performers year-to-date are the Nikkei, the Russell 2000 and the Nasdaq.
The one-month, year-to-date (YTD) and five-year performances of equity indices ranked by one-month performance
Calendar
On Wednesday 19 August, Danish companies Carlsberg and Lundbeck will release their interim reports. In macroeconomic news, the day begins in Japan with the release of machine orders for June. A few hours later, the UK will publish figures for the consumer and producer price indices, as well as retail sales, for July. From the eurozone, data will be released on the current account for June and the consumer price index for July. Finally, the US Department of Energy will release weekly oil inventory data, along with the minutes from the Federal Reserve’s 29 July meeting.
On Thursday 20 August, interim reports are expected from the Swedish companies Holmen and Hufvudstaden, the Norwegian company Orkla, the Danish company GN Store Nord, the US companies Deere and Walmart, and the Chinese e-commerce giant Alibaba. The day’s macroeconomic news begins with Japan’s trade balance for July, followed by Germany’s producer price index for July and the interest rate decision of the Swedish Riksbank. Next is the UK’s CBI industrial trends survey for August. Finally, we turn to the US, which will provide the Philadelphia Fed index and weekly jobless claims.
On Friday 21 August, we will receive an interim report from Nibe, a Swedish heat pump company. Friday's macroeconomic agenda is dominated by the August Purchasing Managers' Indexes (PMIs) from Japan, India, France, Germany, the Eurozone, the UK and the US. Other data releases will include Japan’s consumer price index for July, UK retail sales for July, French industrial expectations for August and a consumer confidence indicator for the Eurozone.
Rising rates put pressure on US equities. Is there still some downside left?
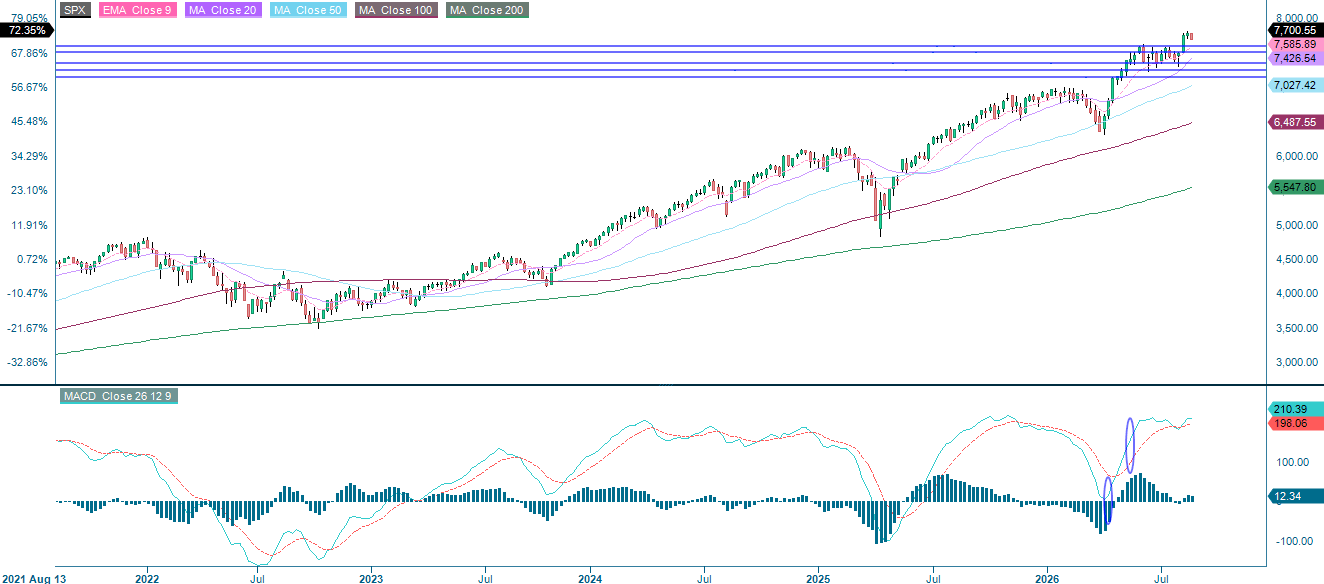
The S&P 500 is under pressure following the collapse of the ceasefire talks with Iran. Renewed threats around the Strait of Hormuz have pushed oil prices to a two-week high, keeping bond yields elevated and risk appetite subdued. As can be seen in the chart below, the MACD is close to generating a soft sell signal, while the index is trading below its EMA9. The next downside level to watch is the MA20, currently at 7,610.
Related Products
S&P500 (in USD), one-year daily chart
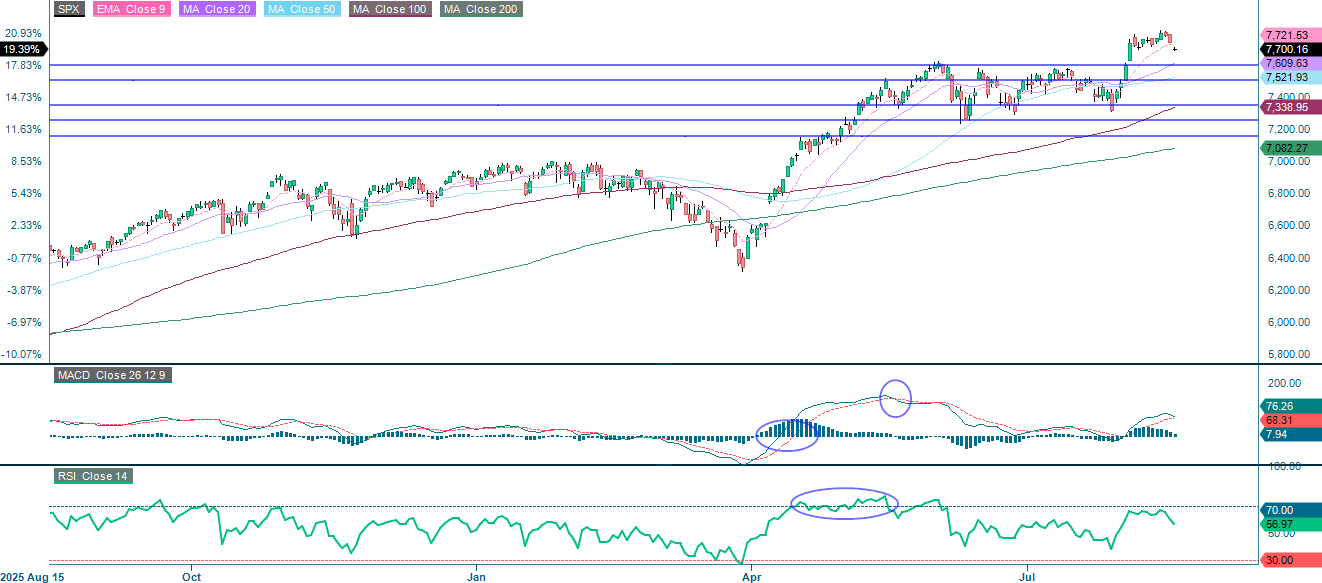
S&P500 (in USD), five-year weekly chart
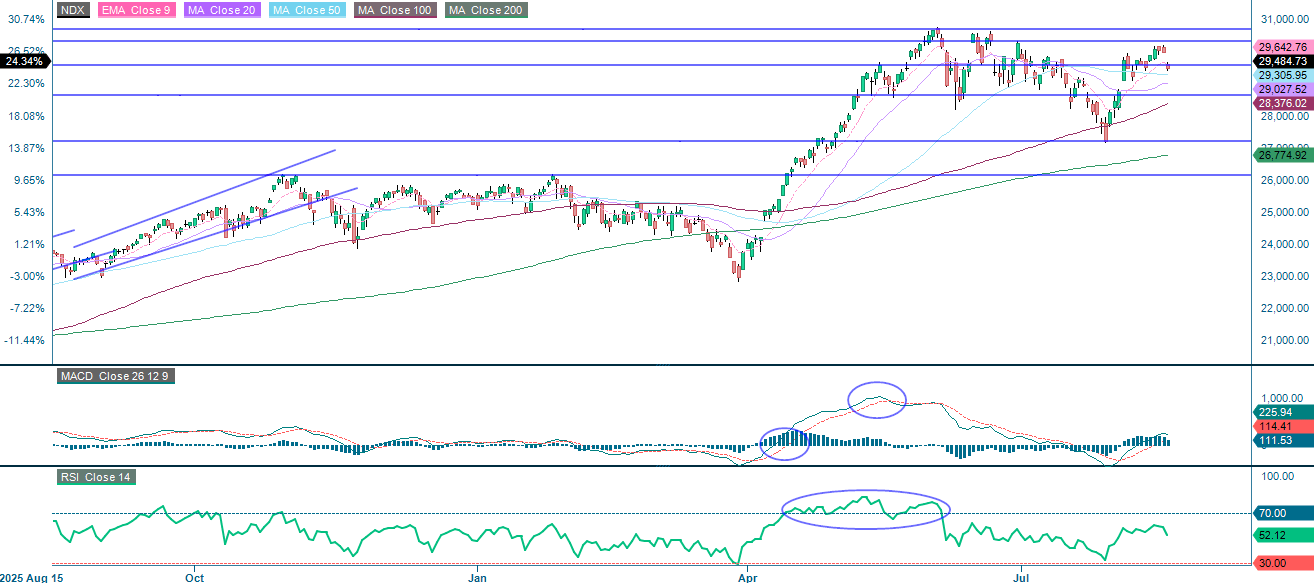
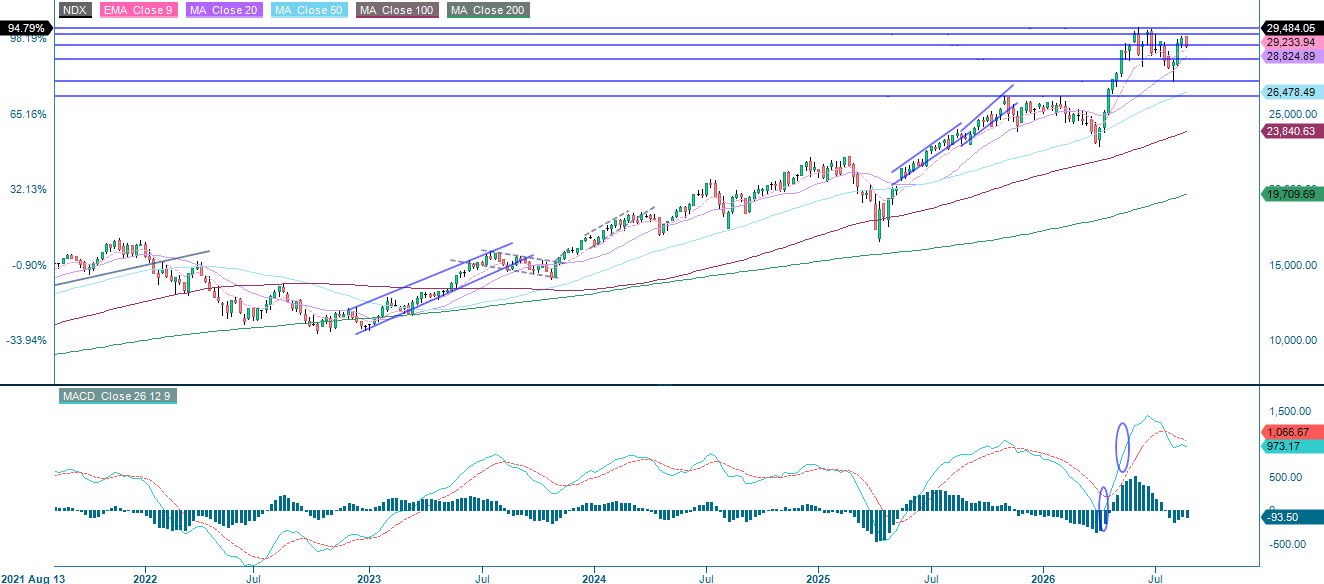
Tech stocks sensitive to interest rates, as represented by the NASDAQ-100 index, are trading below support and approaching the MA50 level, which is currently at 29,306 and serves as the next downside target. This is followed by the MA20 at 29,027.
Related Products
NASDAQ-100 (in USD), one-year daily chart
NASDAQ-100 (in USD), five-year weekly chart
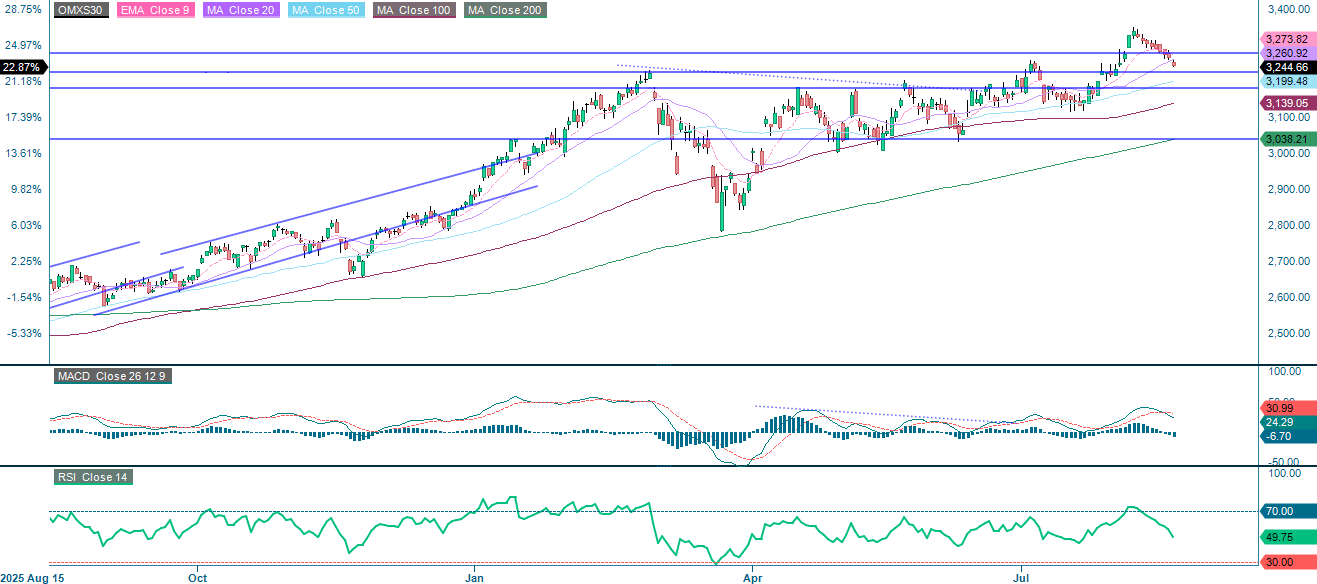
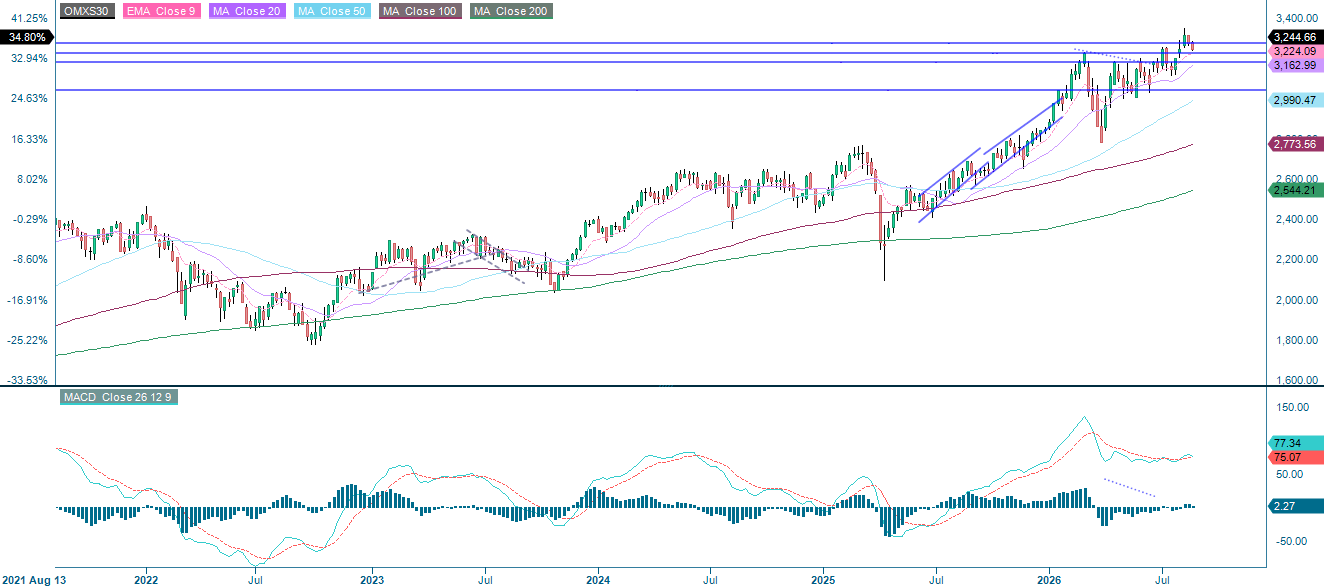
The OMXS30 in Sweden has been under pressure for some time, falling below the MA20 during yesterday’s trading session. MACD has generated a soft sell signal, and RSI is indicating neutral levels. Support levels are around 3,225 and the MA50, which is currently just below 3,200.
Related Products
OMX30 (in SEK), one-year daily chart
OMX30 (in SEK), five-year weekly chart
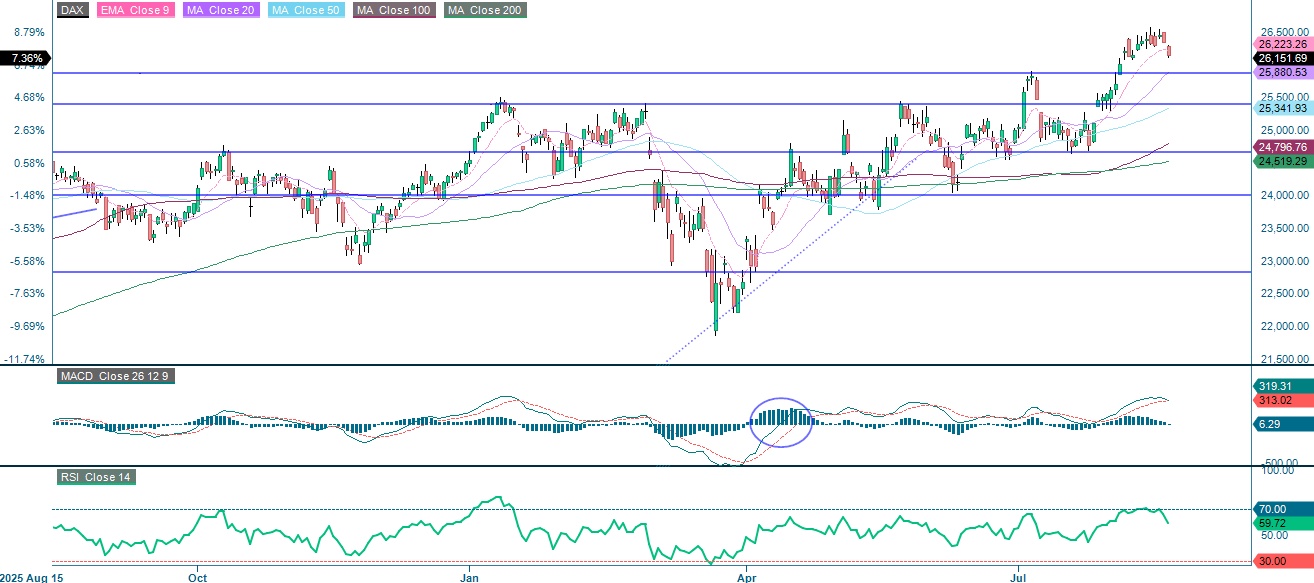
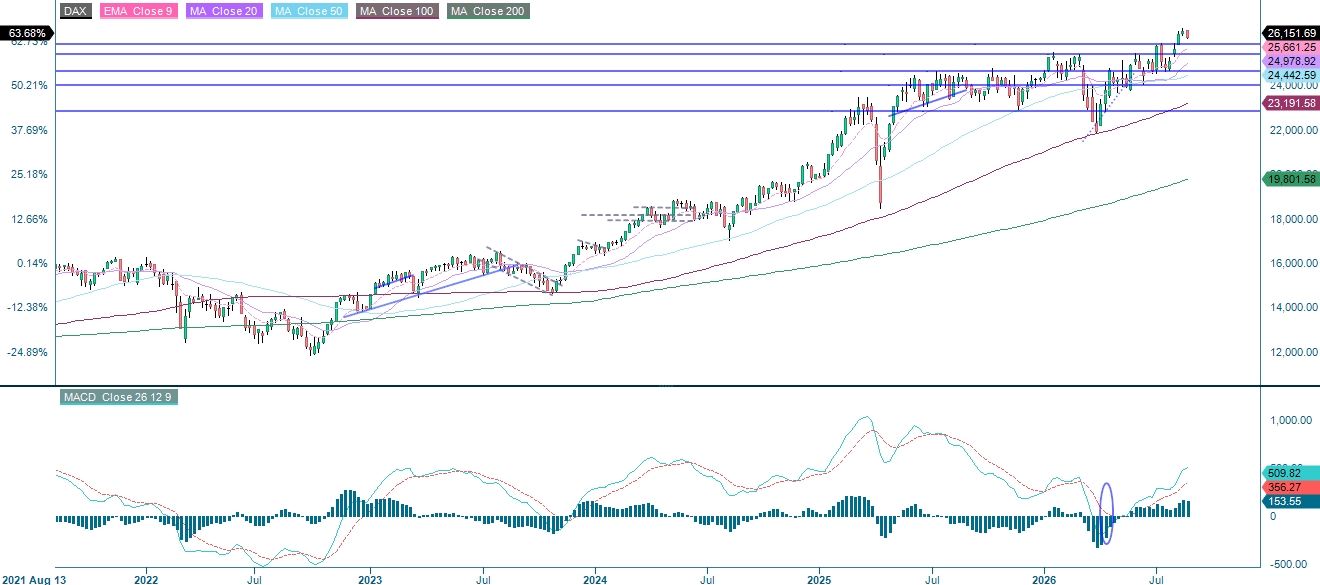
The German DAX is trading below the EMA9 level. The MACD is close to generating a soft sell signal, so the index may be heading towards the support level of 25,880.
Related Products
DAX (in EUR), one-year daily chart
DAX (in EUR), five-year weekly chart
The full name for abbreviations used in the previous text:
EMA 9: 9-day exponential moving average
Fibonacci: There are several Fibonacci lines used in technical analysis. Fibonacci numbers are a sequence in which each successive number is the sum of the two previous numbers.
MA20: 20-day Moving Average
MA50: 50-day Moving Average
MA100: 100-day Moving Average
MA200: 200-day Moving Average
MACD: Moving Average Convergence Divergence
Risks
Credit risk of the issuer:
Investors in the products are exposed to the risk that the Issuer or the Guarantor may not be able to meet its obligations under the products. A total loss of the invested capital is possible. The products are not subject to any deposit protection.
Currency risk:
If the product currency differs from the currency of the underlying asset, the value of a product will also depend on the exchange rate between the respective currencies. As a result, the value of a product can fluctuate significantly.
Market risk:
The value of the products can fall significantly below the purchase price due to changes in market factors, especially if the value of the underlying asset falls. The products are not capital-protected
Product costs:
Product and possible financing costs reduce the value of the products.
Risk with leverage products:
Due to the leverage effect, there is an increased risk of loss (risk of total loss) with leverage products, e.g. Bull & Bear Certificates, Warrants and Mini Futures.
External author:
This information is in the sole responsibility of the guest author and does not necessarily represent the opinion of Bank Vontobel Europe AG or any other company of the Vontobel Group. This information is sponsored by Bank Vontobel Europe AG, which may be a counterparty to transactions involving the financial instruments discussed in this information. The further development of the index or a company as well as its share price depends on a large number of company-, group- and sector-specific as well as economic factors. When forming his investment decision, each investor must take into account the risk of price losses. Please note that investing in these products will not generate ongoing income.
The products are not capital protected, in the worst case a total loss of the invested capital is possible. In the event of insolvency of the issuer and the guarantor, the investor bears the risk of a total loss of his investment. In any case, investors should note that past performance and/or analysts' opinions are no adequate indicator of future performance. The performance of the underlyings depends on a variety of economic, entrepreneurial and political factors that should be taken into account in the formation of a market expectation.
Disclaimer:
This information is neither an investment advice nor an investment or investment strategy recommendation, but advertisement. The complete information on the products (securities) mentioned herein, in particular the structure and risks associated with an investment, are described in the base prospectus, together with any supplements, as well as the final terms relating to the securities. The base prospectus and final terms constitute the solely binding sales documents for the products mentioned herein. It is recommended that potential investors read these documents before making any investment decision. The documents and the key information document are published on the website of the issuer, Vontobel Financial Products GmbH, Bockenheimer Landstrasse 24, 60323 Frankfurt am Main, Germany, on https://prospectus.vontobel.com and are available from the issuer free of charge. The approval of the prospectus should not be understood as an endorsement of the securities. The securities are products that are not simple and may be difficult to understand. This information includes or relates to figures of past performance. Past performance is not a reliable indicator of future performance. This information may only be distributed or published in countries where such distribution or publication is permitted by applicable law. As stated in the relevant base prospectus, the distribution of the securities mentioned in this information is subject to restrictions in certain jurisdictions. This advertisement may not be reproduced or redistributed without prior permission by Vontobel.
© Bank Vontobel Europe AG and / or affiliated companies. All rights reserved.