DAX Market Analysis, August 2022


July was a slightly positive month for the DAX index and especially the weekly chart indicated bullish movement - at the end of July, DAX had climbed above EMA12 average and tested EMA6 levels - and at the time of writing this analysis, the index is above both moving averages and it is critical for the bulls that the index stays above both moving averages the incoming weeks. If the index manages to stay above both EMA12 and EMA6, it is probable that we’ll see further bullish action. In many news articles, there is speculation around interest rate hikes and if these are already priced into current market corrections and at least more bullish movement for the short term.
July was a
slightly positive month for the DAX index and especially the weekly chart
indicated bullish movement - at the end of July, DAX had climbed above EMA12
average and tested EMA6 levels - and at the time of writing this analysis, the
index is above both moving averages and it is critical for the bulls that the
index stays above both moving averages the incoming weeks. If the index manages
to stay above both EMA12 and EMA6, it is probable that we’ll see further
bullish action. In many news articles, there is speculation around interest
rate hikes and if these are already priced into current market corrections and
at least more bullish movement for the short term.
The long
term trend for DAX continues to be bearish and also the monthly EMA12 level
(13847) is a significant resistance level - if DAX manages to climb above
EMA12, it is possible that on a technical level the bullish move gets stronger.
13850-14000 level is a important zone for which direction the DAX index will
continue to follow.

Long term
support levels: 12185, 13000
Long term
resistance levels: 13850, 14200, 15000
On the
weekly chart below DAX EMA12 average has been setting the resistance level for
the bearish trend. S1 pivot point held its support, followed by an almost
immediate EMA12 crossover. Now it is crucial to follow if the DAX index manages
to stay above EMA6 average - and it is very likely that the DAX index will test
EMA6. On the upside 13850-14000 zone needs to be climbed above for the bullish
move to continue.

Midterm support
levels: 13100, 13380
Midterm
resistance levels: 13870, 14200
For a long
swing position it is fairly “simple” to picture a strategy where a long
position is taken from the weekly chart moving average EMA6 level - if this
level holds, this trade should work out. e.g. TLNG DAX V1533 could be a
possible instrument for this trade.
For a short
swing trade the same EMA6 can be used on the down side, the monthly pivot R1
level functioning as stop-loss/knock-out level. E.g. TSRT DAX V1398 could be a
possible instrument for this trade:

Above: DAX average monthly movement - historically August has been the worst performing month of the year.

Above: McClellan oscillator is now in bullish territory.

Above: Split of shares in DAX between those above and below their respective DMA20.

Above: Summary of technical indicators for DAX. The message is unclear
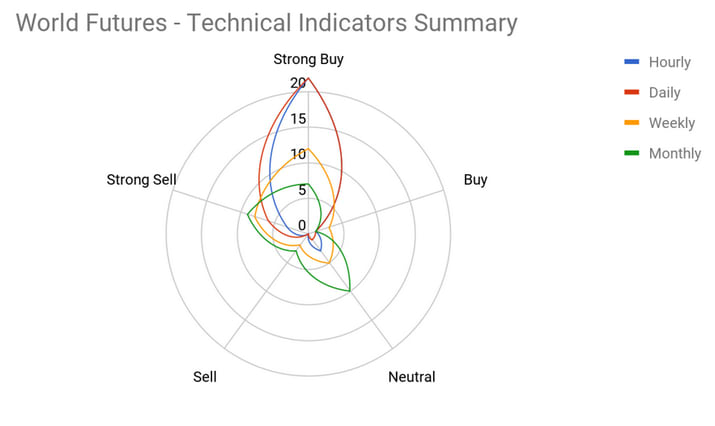
Above:
Summary of technical indicators for futures.
Above: summary of technical indicators for
futures. Here the picture starts to turn to the buy side


Note: historical movement is not a reliable indicator of the future

Note: historical movement is not a reliable indicator of the future
Note: historical movement is not a reliable indicator of the future

Note: historical movement is not a reliable indicator of the future
Note: historical movement is not a reliable indicator of the future
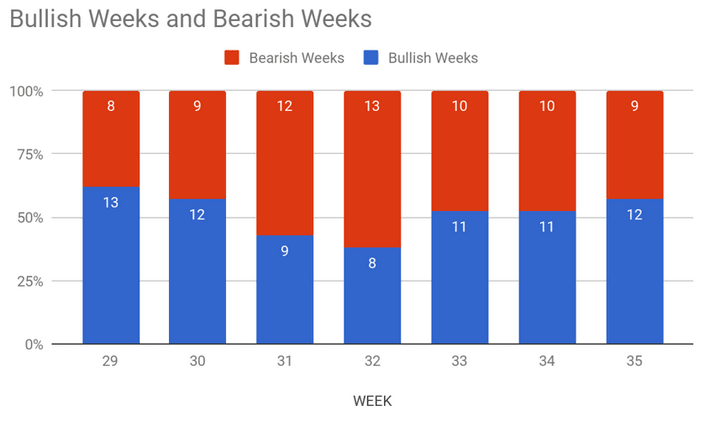
Above: Historical weekly and daily movements for DAX.
Risks
Important notice:
This information is neither an investment advice nor an investment or investment strategy recommendation, but advertisement. The complete information on the securities, in particular the structure and risks associated with an investment, are described in the base prospectus, together with any supplements, as well as the final terms. It is recommended that potential investors read these documents before making any investment decision. The documents and the key information document are published on the website of the issuer, Vontobel Financial Products GmbH, Bockenheimer Landstrasse 24, 60323 Frankfurt am Main, Germany, on prospectus.vontobel.com and are available from the issuer free of charge. The approval of the prospectus should not be understood as an endorsement of the securities. The securities are products that are not simple and may be difficult to understand. Past performance is not a reliable indicator of future performance.