Friday's crash, inflationary pressures and SpaceX's historic IPO

The stock market ended last week dramatically, with the technology sector, and semiconductor manufacturers in particular, experiencing a sharp downward correction. Stock markets fell broadly globally, with both the S&P 500 and the NASDAQ indexes seeing their biggest single-day declines of the year so far. This is also brought an end to the S&P 500's nine-week uptrend, raising questions about the sustainability of the bull market.
What caused Friday's collapse?
Several factors were behind the market decline:
Broadcom earnings: Although the semiconductor giant Broadcom reported modest earnings, these fell short of both investors' expectations and the so-called "Whisper Numbers." A nearly 20% drop in share price was one factor in the downward movement that was reflected across the semiconductor sector, weakening market sentiment.
"Good news is bad news": The Non-Farm Payrolls report released on Friday surprised positively (172,000 vs. An expected of 85,000). However, the strong employment data was interpreted by the market as a sign that the US Federal Reserve may not be able to lower interest rates as expected. The resulting upward pressure on interest rates particularly affected on high-value growth companies and raised US government bond yields.
Overstretched market: The market has been rising almost vertically for months. Several technical indicators (such as the RSI) have been showing overbought conditions for some time. In such an environment, even minor changes in the news flow can trigger drastic downward movements.
Related Products
Broadcom, 1 year chart

Broadcom, 5 year chart

Space X's historic listing
Investors are also keepimng a close eye on the upcoming SpaceX IPO, which is scheduled for June 12. Valued at $1.75 trillion, it is set to be the largest IPO in stock market history. Investors see SpaceX not only as a space company, but also as a key player in AI and satellite infrastructure. If the IPO goes as expected, this could bring a new positive narrative to the market.
Looking ahead to Wednesday: Inflation numbers (CPI)
Market nervousness is also focused on US inflation numbers, which are due on June 10. If inflation shows signs of accelerating or remaining high, it could cement market fears that interest rates will remain higher for longer. In particular, oil price developments and the geopolitical situation in the Middle East are particular factors that could keep inflationary pressures persistent.
Technical picture: Has the uptrend been broken?
Although Friday's decline was sharp, the situation could also be analyzed as a possible sector rotation. More defensive sectors, such as healthcare and financials, remained more stable on Friday despite the broad decline.
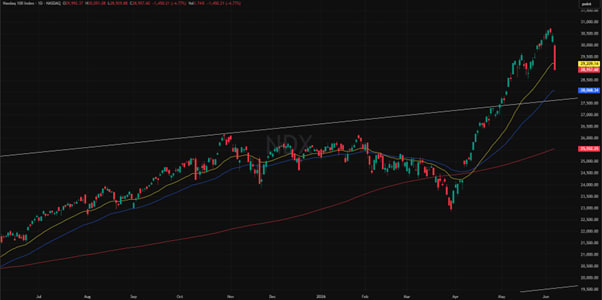
Technically, the S&P 500 and NASDAQ indices have weakened in the shorter term. Both indices fell below the key EMA25 moving average (yellow) on the daily chart, which can be interpreted as a negative thing from a technical perspective. If the market decline continues, potential support levels could be found at the SMA50 moving average (blue) or longer-term trend lines. If these levels are breched, it could open the door to a more significant correction.
Related Products
S&P 500, 1 year chart

S&P 500, 5 year chart

Related Products
NASDAQ, 1 year chart
NASDAQ, 5 year chart

Summary
On Friday investors were the importance of risk management. The overheated state of the market coupled with market uncertaintiescreated fertile ground for a correction. This week's price action and the data releases this week could determine whether this is a permanent trend reversal or just a temporary correction.
Indicators shown on the graphs:
● SMA200: 200-day moving average, red.
● SMA50: 50-day moving average, blue.
● EMA25: 25-day exponential moving average, yellow.
Risks
Credit risk of the issuer:
Investors in the products are exposed to the risk that the Issuer or the Guarantor may not be able to meet its obligations under the products. A total loss of the invested capital is possible. The products are not subject to any deposit protection.
Currency risk:
If the product currency differs from the currency of the underlying asset, the value of a product will also depend on the exchange rate between the respective currencies. As a result, the value of a product can fluctuate significantly.
Market risk:
The value of the products can fall significantly below the purchase price due to changes in market factors, especially if the value of the underlying asset falls. The products are not capital-protected
Product costs:
Product and possible financing costs reduce the value of the products.
Risk with leverage products:
Due to the leverage effect, there is an increased risk of loss (risk of total loss) with leverage products, e.g. Bull & Bear Certificates, Warrants and Mini Futures.
External author:
This information is in the sole responsibility of the guest author and does not necessarily represent the opinion of Bank Vontobel Europe AG or any other company of the Vontobel Group. This information is sponsored by Bank Vontobel Europe AG, which may be a counterparty to transactions involving the financial instruments discussed in this information. The further development of the index or a company as well as its share price depends on a large number of company-, group- and sector-specific as well as economic factors. When forming his investment decision, each investor must take into account the risk of price losses. Please note that investing in these products will not generate ongoing income.
The products are not capital protected, in the worst case a total loss of the invested capital is possible. In the event of insolvency of the issuer and the guarantor, the investor bears the risk of a total loss of his investment. In any case, investors should note that past performance and / or analysts' opinions are no adequate indicator of future performance. The performance of the underlyings depends on a variety of economic, entrepreneurial and political factors that should be taken into account in the formation of a market expectation.
Disclaimer:
This information is neither an investment advice nor an investment or investment strategy recommendation, but advertisement. The complete information on the products (securities) mentioned herein, in particular the structure and risks associated with an investment, are described in the base prospectus, together with any supplements, as well as the final terms relating to the securities. The base prospectus and final terms constitute the solely binding sales documents for the products mentioned herein. It is recommended that potential investors read these documents before making any investment decision. The documents and the key information document are published on the website of the issuer, Vontobel Financial Products GmbH, Bockenheimer Landstrasse 24, 60323 Frankfurt am Main, Germany, on https://prospectus.vontobel.com and are available from the issuer free of charge. The approval of the prospectus should not be understood as an endorsement of the securities. The securities are products that are not simple and may be difficult to understand. This information includes or relates to figures of past performance. Past performance is not a reliable indicator of future performance. This information may only be distributed or published in countries where such distribution or publication is permitted by applicable law. As stated in the relevant base prospectus, the distribution of the securities mentioned in this information is subject to restrictions in certain jurisdictions. This advertisement may not be reproduced or redistributed without prior permission by Vontobel.
© Bank Vontobel Europe AG and / or affiliated companies. All rights reserved.