Europe is losing growth


While the US and Asian economies performed better than expected from March to May 2026, Europe's economy weakened. This puts more pressure on European central banks to stimulate their economies. We believe that the interest rate gap between the US and Europe could widen, favoring the US dollar over the euro.
Case of the week: Stronger economic growth should strengthen the US dollar
The flash estimate of the combined purchasing managers' index (PMI) for the eurozone fell to 47.5 in May, down from 48.8 in April. In the manufacturing sector, the PMI fell from 52.2 to 51.4. In the services sector, the PMI fell from 47.6 in April to 46.4. Overall, the data show that the war in the Middle East is having an increasingly negative impact on the Eurozone economy. The Economic Surprise Index for Eurozone countries dropped from approximately +25 in March 2026 to around -50 two months later. Conversely, the Economic Surprise Index for the United States and Asia increased from approximately 25 in March 2026 to around 50 in May 2026.
The war between the United States, Israel and Iran has resulted in rising oil prices and subsequent inflationary pressure, due to the closure of the Strait of Hormuz. This hs led to increased transportation costs, as well as the risk of shortages of artificial fertiliser and smaller harvests in the second half of 2026. However, the US has become the world’s third-largest net exporter of oil in recent decades, meaning that some sectors of the US economy benefit from rising oil prices. Since the last major oil crisis in the 1970s, Europe has reduced its dependence on oil significantly. Nevertheless, several European countries still depend heavily on frictionless world trade, which is unfortunately not the case at present.
Negotiations for a prolonged ceasefire between the US and Iran are ongoing, including discussions around the Iranian nuclear energy programme. This has overshadowed the fact that Trump's new, significantly higher tariffs have been in effect for some time. Higher tariffs lead to higher inflation, but lower world trade affects Europe differently to how it affects the US. This is because several major European countries, such as Germany, are large net exporters, whereas the US is a net importer.
The weakening European economy means that the ECB and other European central banks are likely to face greater pressure than the Fed to keep policy rates low and stimulate domestic economies. We also anticipate that European governments will provide government subsidies to households to achieve this. However, inflationary pressures resulting from higher tariffs and energy prices mean that interest rate cuts are less likely. Instead, central banks will be forced to combat inflation. In that case, Europe risks experiencing stagflation, and the path to improved economic growth could be long.
Related Products
USD/EUR, one-year daily chart

US/EUR, five-year weekly chart

Macro comments
As shown in the graph below, the Nasdaq improved from the sixth-best price development on April 21 to the third-best today, approximately one month later. This can be explained by the positive hype surrounding all AI-related stocks worldwide over the past month.
The one-month, year-to-date (YTD) and five-year performances of equity indices ranked by YTD performance

Today, Wednesday, May 27, macro statistics will begin with April profits from Chinese industrial companies. Later in the day, the results of a survey of French household confidence in May will be released. From the U.S., we will receive the ADP private employment report, the Redbook retail sales report, weekly data, the Richmond Fed index for May, and weekly oil inventory data from the Department of Energy. Salesforce will also release an interim report.
On Thursday, May 28, the Swedish company Elekta and the American companies Dell Technologies and Costco Wholesale will release their interim reports. In tems of macro statistics, Norway's Q1 GDP and Sweden's April trade balance will be released. The Swedish NIESR will publish a business survey for May. A business survey for the Eurozone will also be published for May. The U.S. will contribute housing construction data for April, Q1 GDP, durable goods orders for April, weekly jobless claims and new home sales data for April.
On Friday, May 29, the release of macro statistics will begin with Japan's industrial production figures for April. This will be followed by Sweden's and Finland's first-quarter GDP, as well as Sweden's household lending and retail sales for April. Also on Friday, Germany will rrelaese its import prices for April and CPI for May, and France will publish its CPI for May and GDP for Q1. Additionally, Italy's and Spain's CPI figures for May will be released. In the afternoon, Canada's Q1 GDP will be released, along with the US's April trade balance of goods and wholesale inventories, and the May Chicago Purchasing Managers' Index.
Are dips supposed to be purchased?
Over the past week, optimism surrounding Middle East peace talks and the easing of oil price pressures have been key drivers of the S&P 500, among other factors. As can be seen in the chart below, the index is currently trading at record highs. However, oil prices are also rising, so it seems unlikely that the rally will continue at this pace. Watch out for the EMA9 and MA20 levels, which are currently at 7,354. Breaking below this level could open the way to 7,155. Conversely, if the peace talks remain on track, a pullback towards the MA20 could present a buying opportunity.
Related Products
S&P 500 (in USD), one-year daily chart

S&P 500 (in USD), five-year weekly chart

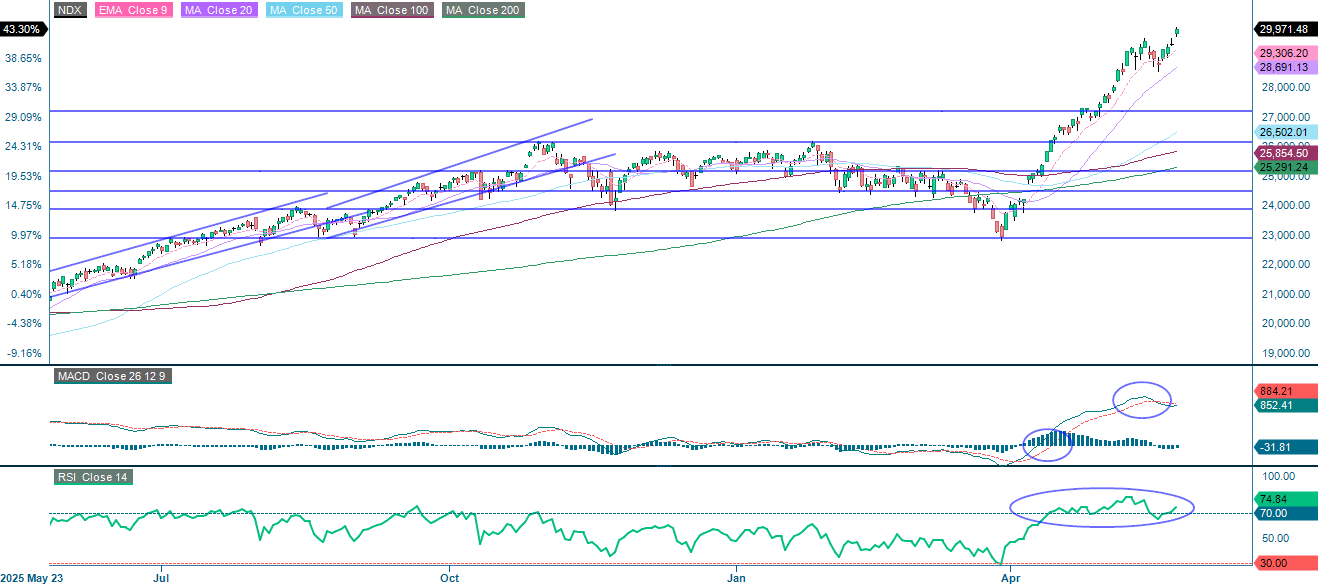
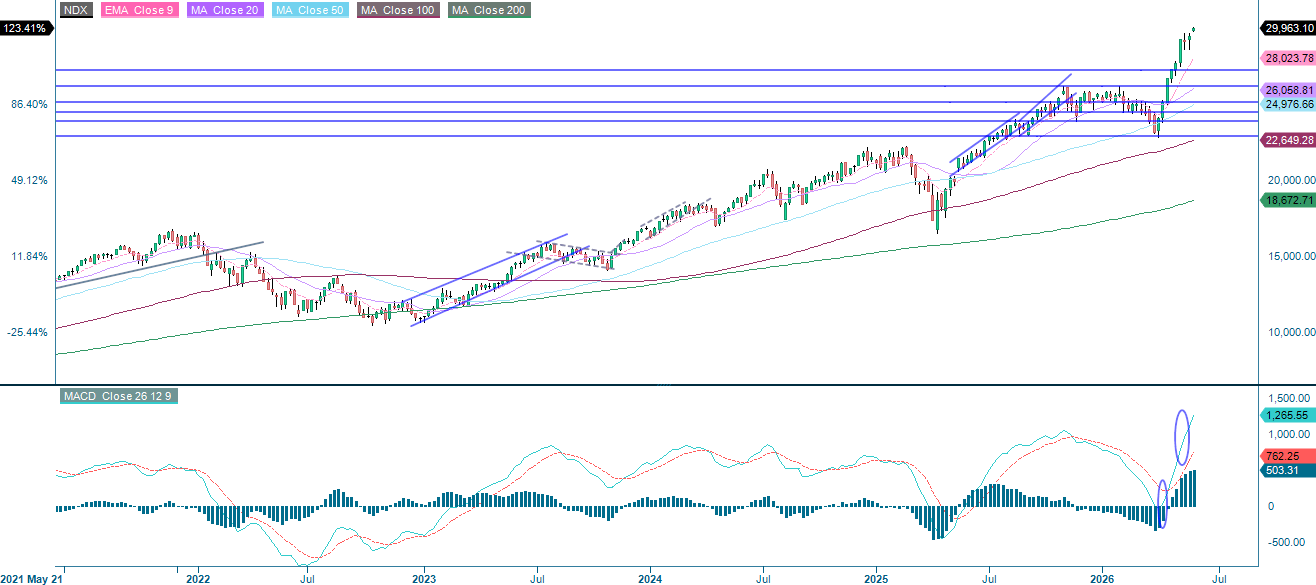
Arguably, the NASDAQ-100 has benefited more than the S&P 500 from the rebound in semiconductors and AI, thanks to the peace talks and lower oil prices. On the downside, the index is supported by the EMA9 and MA20. If it falls below the MA20, the next support level of around 27,200 could come into focus. Conversely, a pullback towards the MA20 could present an attractive opportunity to capitalise on the current rally.
Related Products
NASDAQ-100 (in USD), one-year daily chart
NASDAQ-100 (in USD), five-year weekly chart
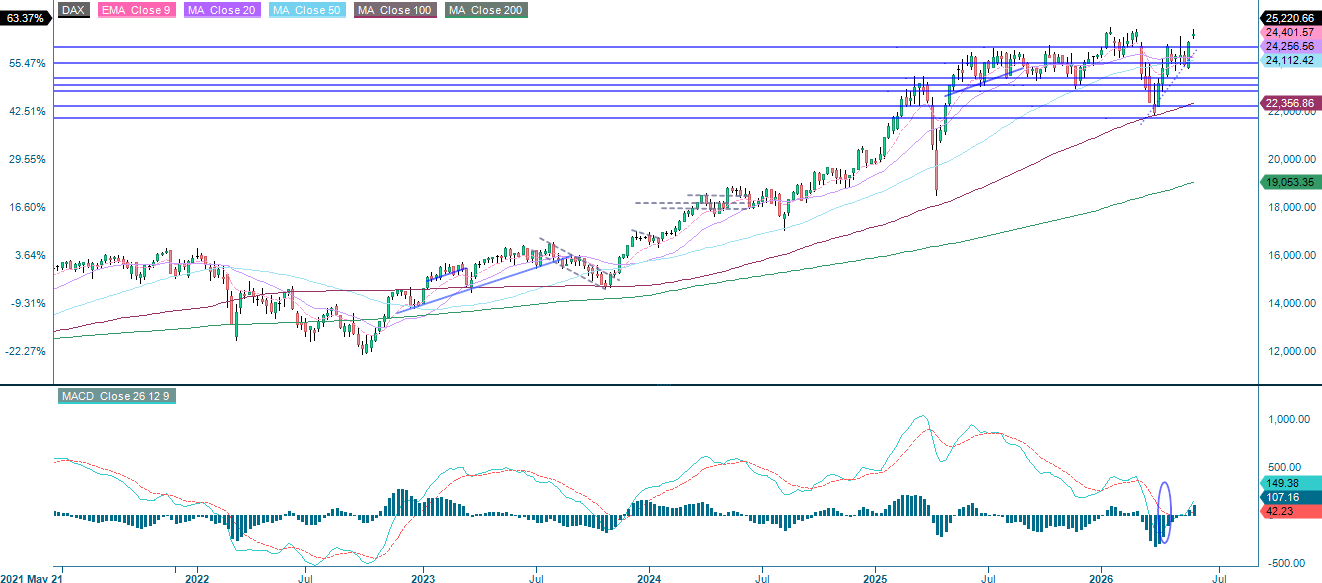
Some time ago, one of these articles’ series discussed the DAX long/S&P 500 short spread. This trade has performed well thus far and could still be worth holding in order to reduce overall market risk. As can be seen in the chart below, the DAX is currently approaching its previous highs. Meanwhile, unlike in the US, the RSI has not yet reached overbought territory. On the downside, initial support sits at around 24,900 and 24,700.
Related Products
DAX (in EUR), one-year daily chart

DAX (in EUR), five-year weekly chart
The OMXS30 is currently trading just below the 3,180-resistance level. The next level of resistance is close by, at around 3,220. Initial support on the downside is seen around 3,145, followed by the EMA9 and MA20 at 3,086.
OMX30 (in SEK), one-year daily chart

OMX30 (in SEK), five-year weekly chart

The full name for abbreviations used in the previous text:
EMA 9: 9-day exponential moving average
Fibonacci: There are several Fibonacci lines used in technical analysis. Fibonacci numbers are a sequence in which each successive number is the sum of the two previous numbers.
MA20: 20-day moving average
MA50: 50-day moving average
MA100: 100-day moving average
MA200: 200-day moving average
MACD: Moving average convergence divergence
Risks
Credit risk of the issuer:
Investors in the products are exposed to the risk that the Issuer or the Guarantor may not be able to meet its obligations under the products. A total loss of the invested capital is possible. The products are not subject to any deposit protection.
Currency risk:
If the product currency differs from the currency of the underlying asset, the value of a product will also depend on the exchange rate between the respective currencies. As a result, the value of a product can fluctuate significantly.
Market risk:
The value of the products can fall significantly below the purchase price due to changes in market factors, especially if the value of the underlying asset falls. The products are not capital-protected
Product costs:
Product and possible financing costs reduce the value of the products.
Risk with leverage products:
Due to the leverage effect, there is an increased risk of loss (risk of total loss) with leverage products, e.g. Bull & Bear Certificates, Warrants and Mini Futures.
External author:
This information is in the sole responsibility of the guest author and does not necessarily represent the opinion of Bank Vontobel Europe AG or any other company of the Vontobel Group. This information is sponsored by Bank Vontobel Europe AG, which may be a counterparty to transactions involving the financial instruments discussed in this information. The further development of the index or a company as well as its share price depends on a large number of company-, group- and sector-specific as well as economic factors. When forming his investment decision, each investor must take into account the risk of price losses. Please note that investing in these products will not generate ongoing income.
The products are not capital protected, in the worst case a total loss of the invested capital is possible. In the event of insolvency of the issuer and the guarantor, the investor bears the risk of a total loss of his investment. In any case, investors should note that past performance and / or analysts' opinions are no adequate indicator of future performance. The performance of the underlyings depends on a variety of economic, entrepreneurial and political factors that should be taken into account in the formation of a market expectation.
Disclaimer:
This information is neither an investment advice nor an investment or investment strategy recommendation, but advertisement. The complete information on the products (securities) mentioned herein, in particular the structure and risks associated with an investment, are described in the base prospectus, together with any supplements, as well as the final terms relating to the securities. The base prospectus and final terms constitute the solely binding sales documents for the products mentioned herein. It is recommended that potential investors read these documents before making any investment decision. The documents and the key information document are published on the website of the issuer, Vontobel Financial Products GmbH, Bockenheimer Landstrasse 24, 60323 Frankfurt am Main, Germany, on https://prospectus.vontobel.com and are available from the issuer free of charge. The approval of the prospectus should not be understood as an endorsement of the securities. The securities are products that are not simple and may be difficult to understand. This information includes or relates to figures of past performance. Past performance is not a reliable indicator of future performance. This information may only be distributed or published in countries where such distribution or publication is permitted by applicable law. As stated in the relevant base prospectus, the distribution of the securities mentioned in this information is subject to restrictions in certain jurisdictions. This advertisement may not be reproduced or redistributed without prior permission by Vontobel.
© Bank Vontobel Europe AG and / or affiliated companies. All rights reserved.