Higher energy costs are pushing up US rates


President Trump is sending mixed signals to the market about the direction of the war with Iran, and, consequently, the price of Brent oil. Although the U.S. escorted neutral ships through the Strait of Hormuz, Trump has warned Iran that the deadline for negotiations is approaching. Following the US-China summit this past weekend, there is also hope that China will mediate the conflict. Higher energy prices contributed to the increase in the U.S. Producer Price Index in April, which is, in turn, driving up U.S. interest rates.
Case of the week: The clock is ticking for the oil supply
After surging in March and at the end of April, the price of crude oil has fallen from recent highs of around $120 per barrel. This occurred after President Trump announced on May 4 that the United States would begin escorting neutral ships through the Strait of Hormuz. There were also hopes that last week's meeting between Trump and China’s leader, Xi Jinping, would lead China to become more actively involved in mediating the Iran conflict. However, China's involvement has been largely symbolic substance thus far. Over the weekend, Trump issued new threats, stating that time is running out for Iran.
Typically, nearly 20 percent of the world’s crude oil supply is shipped through the Strait. While some of it has been rerouted via land pipelines, the de facto closing of this passage continues to affect most of the supply from the region. Tanker traffic remains severely limited, and the double blockade by Iran and the U.S. is not helping. According to The Economist, nearly 14 million barrels of oil per day—14 percent of global output—have been lost. The U.S. strategy may be to force Iran to cut production as it runs out of storage space and then bring Iran to the negotiating table to make concessions. However, this strategy is risky because Iran might become desperate and launch more missile and drone attacks on other Gulf countries, thereby intensifying the conflict.
In short, the fog of war persists, and there is no immediate positive solution to the energy crisis in the Strait of Hormuz. One reason the price of crude has not increased more in the short term is that. In recent years, China has quietly accumulated a large strategic petroleum reserve of 1.2 billion barrels as a defense against possible sanctions. However, the pace of drawdowns is probably high currently. In contrast, the scramble for oil in many other parts of the world will soon become even more intense. The full impact of the Strait closure remains to be seen, given the long shipping routes of oil tankers and the recent onset of the conflict at the end of February.
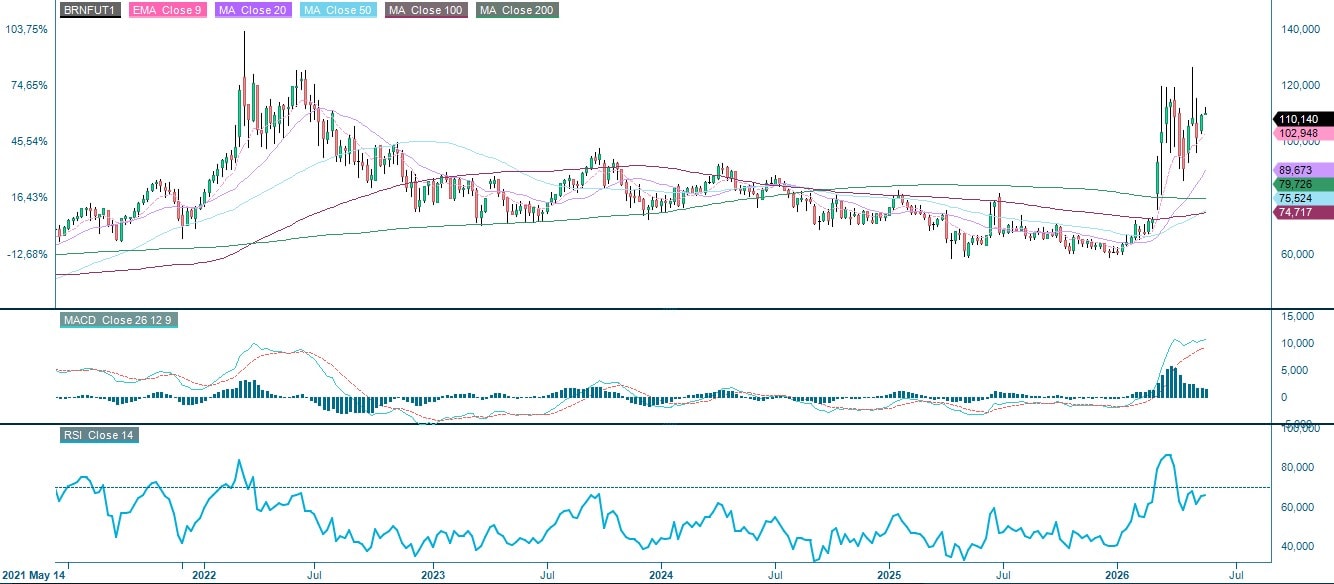
In addition to news directly related to the conflict, the oil price seems to become more sensitive to inventory updates, such as those in the US, as well as possible export restrictions from oil-producing countries. Brent futures are trending positively, and this year's highs are a realistic near-term price target. However, it has to be noted a negative divergence with MACD and relative strength, suggesting that price momentum has faded somewhat.
Related Products
Brent futures (in USD/barrel), one-year daily chart

Brent futures (in USD/barrel), five-year weekly chart
Macro comments
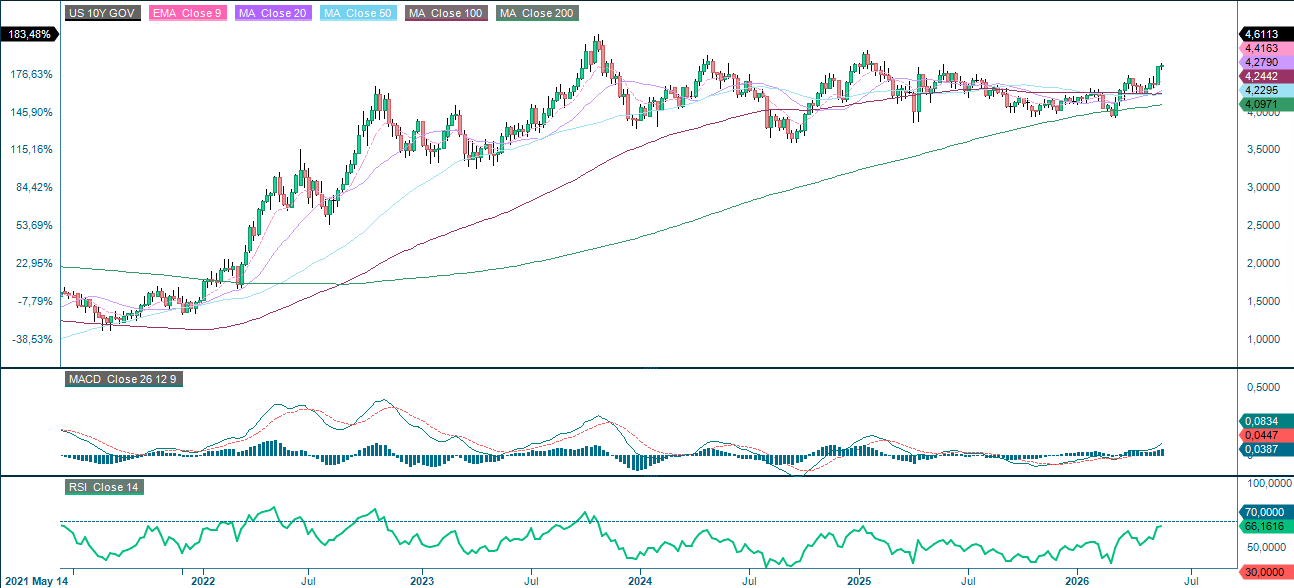
In April 2026, the US Producer Price Index was 1.4% on a monthly basis and 6.0% on an annual basis, compared to expectations of 0.5% and 4.9%, respectively. The majority of this increase can be attributed to higher energy prices. On Friday, May 15, the US ten-year Treasury yield increased by 13 basis points, rising from 4.45% to 4.58% (see graph below). Rising interest rates pose a risk to S&P 500 and NASDAQ valuations.
The US 5-year Treasury yield (in %) on a five-year weekly chart
On Wednesday 20 May, the Swedish companies Addtech and BioArctic, as well as the Norwegian companies Salmar and Orkla, will release their interim reports. However, most of the world is waiting for Nvidia's results though, which are expected to be published later on Wednesday. Turning to the macro statistics, starting with the UK's producer and consumer price index figures for April, the Eurozone will also release its April consumer price index. Finally, the US will release its weekly oil inventory figures from the Department of Energy.
On Thursday 21 May, an interim report from the Swedish investment company Lundberg is expected. In the US, companies such as Deere, Take-Two and Walmart will publish their interim reports. Thursday's macroeconomic news agenda will be dominated by the purchasing managers' index for May from Japan, India, France, Germany, the Eurozone, the UK and the US. The Japanese trade balance for April will also be expected, as well as machinery orders for March. From the Eurozone, a household confidence indicator for May is expected. The UK will present its CBI industrial trends for May. In addition to the aforementioned Purchasing Managers' Index, the U.S. will release data on housing construction in April, as well as the Philadelphia Fed Index and the Kansas Manufacturing Index in May, along with initial weekly jobless claims.
On Friday, May 22, the Norwegian company Frontline is scheduled to report its interim results. The release of macro statistics begins with Japan's April consumer price index. Next are the UK's retail sales for April. Germany will release the GfK consumer confidence index for June, the GDP for the first quarter, and the Ifo index for May. The U.S. will contribute the Michigan index for May.
Cracks are appearing in the US equity rally
The S&P 500 is showing signs of weakness, partly due to rising yields following the release of higher-than-expected core consumer inflation data. As the chart below shows, the index is currently trading below its EMA9, and the MACD has generated a soft sell signal. The MA20, currently at 5,290, is the first support level on the downside. The next area of interest is 5,150 should the MA20 breaks.
Related Products
S&P 500 (in USD), one-year daily chart

S&P 500 (in USD), five-year weekly chart

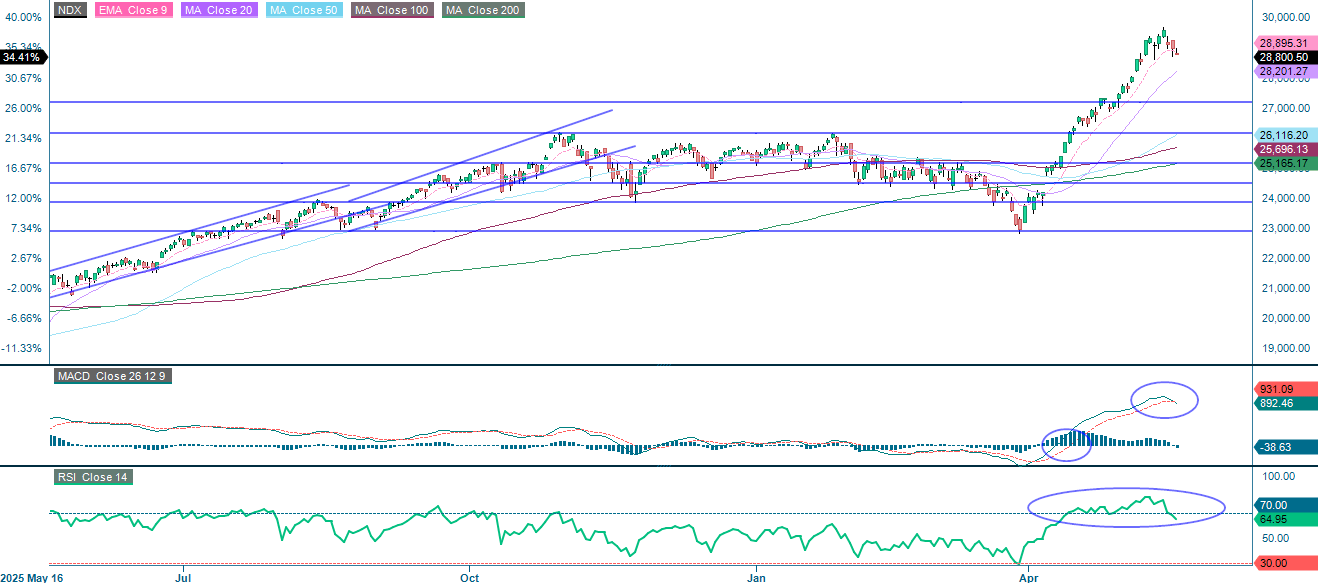
Like the S&P 500, the NASDAQ-100 is trading below its EMA9 with the MA20, which is currently at 28,201 and represents the next meaningful support level on the downside. Beyond that, 27,200 comes into focus. As always, the trajectory of U.S. yields will be a key driver of the tech-heavy index.
Related Products
NASDAQ-100 (in USD), one-year daily chart
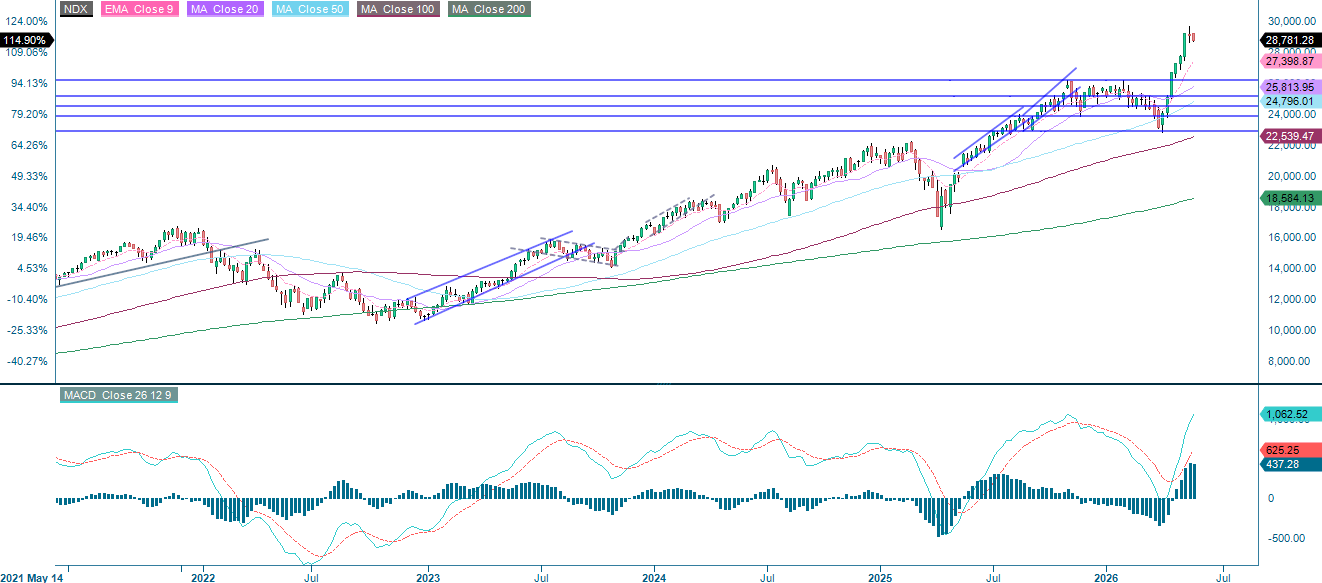
NASDAQ-100 (in USD), five-year weekly chart
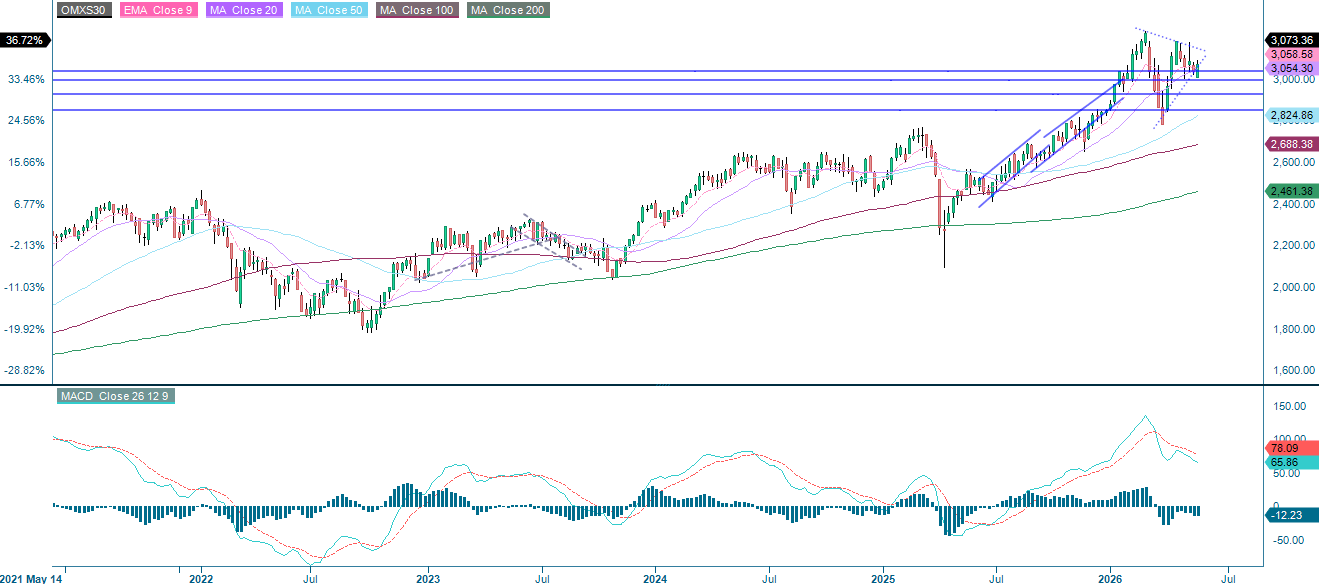
The Swedish OMXS30 remains above its MA100, though momentum is clearly fading, as evidenced by the decline of the MA20 and the weakening of the MACD. Should the index lose its footing and falls below 3,040, the next logical target will be the psychologically significant 3,000 level. On the upside, a decisive move through the MA20 could open the door to the 3,150 area. Additionally,, the symmetrical triangle forming on the chart is worth noting, as this pattern typically precedes a more substantial directional move. The direction of the eventual breakout will be telling.
OMX30 (in SEK), one-year daily chart

OMX30 (in SEK), five-year weekly chart
In contrast, the German DAX is trading erratically, with momentum close to neutral. Flash PMI data from the Eurozone and Germany, scheduled for release on May 21, could introduce short-term volatility to the index. This data could provide insight into whether the industrial slowdown is deepening or beginning to stabilize. A break above 24,660 would be encouraging and could pave the way to 25,300. On the downside, slipping below 24,000 would bring the MA50, currently at 23,746, into focus. The next meaningful support level is around 23,365.
Related Products
DAX (in EUR), one-year daily chart

DAX (in EUR), five-year weekly chart

The full name for abbreviations used in the previous text:
EMA 9: 9-day exponential moving average
Fibonacci: There are several Fibonacci lines used in technical analysis. Fibonacci numbers are a sequence in which each successive number is the sum of the two previous numbers.
MA20: 20-day moving average
MA50: 50-day moving average
MA100: 100-day moving average
MA200: 200-day moving average
MACD: Moving average convergence divergence
Risks
Credit risk of the issuer:
Investors in the products are exposed to the risk that the Issuer or the Guarantor may not be able to meet its obligations under the products. A total loss of the invested capital is possible. The products are not subject to any deposit protection.
Currency risk:
If the product currency differs from the currency of the underlying asset, the value of a product will also depend on the exchange rate between the respective currencies. As a result, the value of a product can fluctuate significantly.
Market risk:
The value of the products can fall significantly below the purchase price due to changes in market factors, especially if the value of the underlying asset falls. The products are not capital-protected
Product costs:
Product and possible financing costs reduce the value of the products.
Risk with leverage products:
Due to the leverage effect, there is an increased risk of loss (risk of total loss) with leverage products, e.g. Bull & Bear Certificates, Warrants and Mini Futures.
External author:
This information is in the sole responsibility of the guest author and does not necessarily represent the opinion of Bank Vontobel Europe AG or any other company of the Vontobel Group. This information is sponsored by Bank Vontobel Europe AG, which may be a counterparty to transactions involving the financial instruments discussed in this information. The further development of the index or a company as well as its share price depends on a large number of company-, group- and sector-specific as well as economic factors. When forming his investment decision, each investor must take into account the risk of price losses. Please note that investing in these products will not generate ongoing income.
The products are not capital protected, in the worst case a total loss of the invested capital is possible. In the event of insolvency of the issuer and the guarantor, the investor bears the risk of a total loss of his investment. In any case, investors should note that past performance and / or analysts' opinions are no adequate indicator of future performance. The performance of the underlyings depends on a variety of economic, entrepreneurial and political factors that should be taken into account in the formation of a market expectation.
Disclaimer:
This information is neither an investment advice nor an investment or investment strategy recommendation, but advertisement. The complete information on the products (securities) mentioned herein, in particular the structure and risks associated with an investment, are described in the base prospectus, together with any supplements, as well as the final terms relating to the securities. The base prospectus and final terms constitute the solely binding sales documents for the products mentioned herein. It is recommended that potential investors read these documents before making any investment decision. The documents and the key information document are published on the website of the issuer, Vontobel Financial Products GmbH, Bockenheimer Landstrasse 24, 60323 Frankfurt am Main, Germany, on https://prospectus.vontobel.com and are available from the issuer free of charge. The approval of the prospectus should not be understood as an endorsement of the securities. The securities are products that are not simple and may be difficult to understand. This information includes or relates to figures of past performance. Past performance is not a reliable indicator of future performance. This information may only be distributed or published in countries where such distribution or publication is permitted by applicable law. As stated in the relevant base prospectus, the distribution of the securities mentioned in this information is subject to restrictions in certain jurisdictions. This advertisement may not be reproduced or redistributed without prior permission by Vontobel.
© Bank Vontobel Europe AG and / or affiliated companies. All rights reserved.