High expectations for S&P500 earnings


This week's case is about Nordea. With its broad presence in the Nordic region, Nordea should be able to continue achieving stable earnings through 2026. Given today's higher oil and gas prices, Nordea's exposure to the Norwegian market is a positive. In other news, earnings expectations are high for S&P 500 companies ahead of the Q1 2026 reporting season, which starts around April 13.
Case of the week: Exposure to Norway is a Plus for Nordea
Stock markets remain uncertain about how and when the war between the US and Iran will end. A large number of energy facilities in Iran, Saudi Arabia, and other Gulf countries have been damaged in bomb and drone attacks. Furthermore, Ukraine has attacked Russian oil facilities in the Baltic and Black Seas during the same period in an attempt to hinder Russian oil exports. Since March 12, the price of Brent oil has ranged from USD 100 to 110 per barrel, driving up transportation costs. This is likely to increase the price of various goods, thereby triggering increased inflation and higher interest rates. Therefore, we believe that over the next few months, investors will favour stocks in sectors less sensitive to the economic cycle.
Banking is one sector that benefits from slightly higher interest rates, as opposed to consumers and real estate companies, who pay these costs. This week, we have therefore chosen Nordea, whose operations are more pan-Nordic than those of other major Nordic banks. Nordea's total lending is distributed as follows: 31% in Sweden, 25% in Denmark, 23% in Norway, and 21% in Finland. We view Nordea's exposure to Norway positively today since higher oil prices bolster the Norwegian economy. Nordea is the second-largest bank in Norway, behind DNB.
At Nordea's Capital Markets Day in November 2025, the bank's strategy until 2030 was presented. Nordea will achieve cost savings (gross) of EUR 600 million by then by leveraging the bank's Nordic economies of scale in technology, data and AI. EUR 600 million corresponds to 12-13% of Nordea's total operating expenses, excluding amortization and write-offs, for the full year of 2025. Nordea's cost-to-income ratio was in the 45-46% range in FY 2025. Like most Nordic banks, Nordea's income primarily stems from net interest income from lending to corporations and individuals.
One business risk for Nordea is its historical exposure to the shipping sector, which currently amounts to around 2% of its total lending. For instance, an extended closure of the Strait of Hormuz could lead to higher credit losses. Meanwhile, Nordea's lending to industrial corporations accounts for around 10% of its total lending volume.
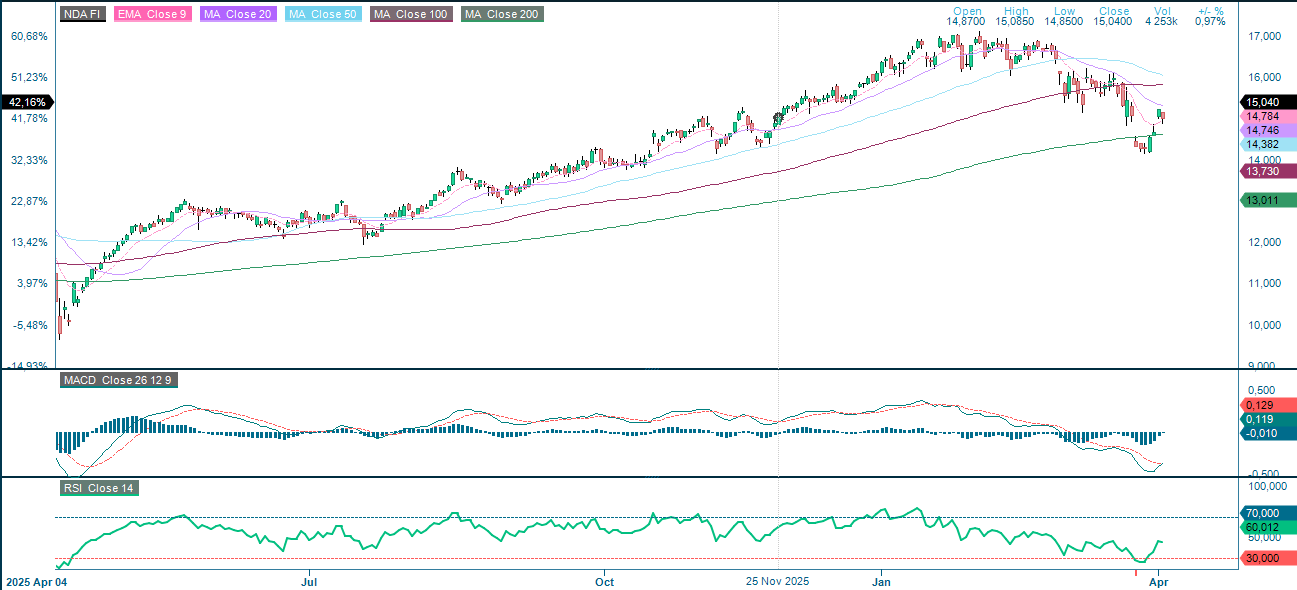
The Nordea share currently trades at a P/E-ratio of 11 times expected earnings in FY 2026. A dividend of €0.96 for fiscal year 2025 would equal 6.3% of Nordea's current share price.
Year-to-date, the Nordea share has underperformed the OMX30 index by 7.5%. However, it has outperformed the index by 9% over the last year.
Related Products
Nordea (in EUR), one-year daily chart
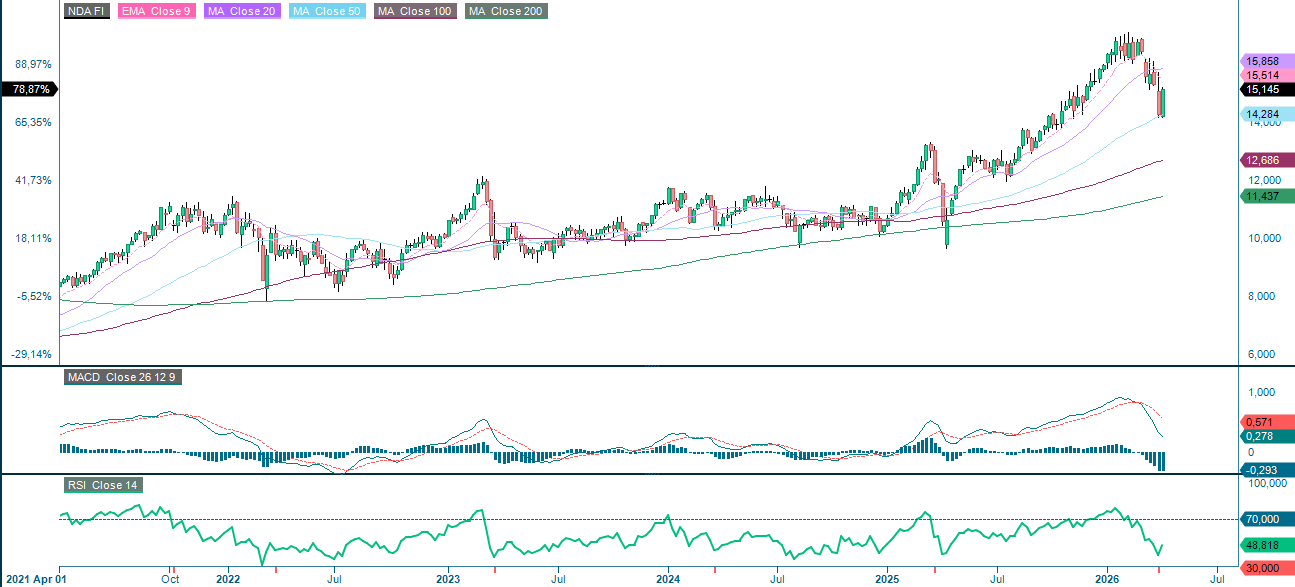
Nordea (in EUR), five-year weekly chart
Macro comments
The US nonfarm payroll report, published on Friday, April 3, far surpassed expectations, with 178,000 new jobs created in March compared to analysts' expectations of 65,000.
Reuters reported that Iran and the United States received a ceasefire plan followed by a peace agreement over the weekend. The plan was developed by three countries acting as mediators: Egypt, Pakistan, and Turkey. However, on Sunday, April 6, Iran rejected the terms of the plan and presented their own demands for a ceasefire agreement.
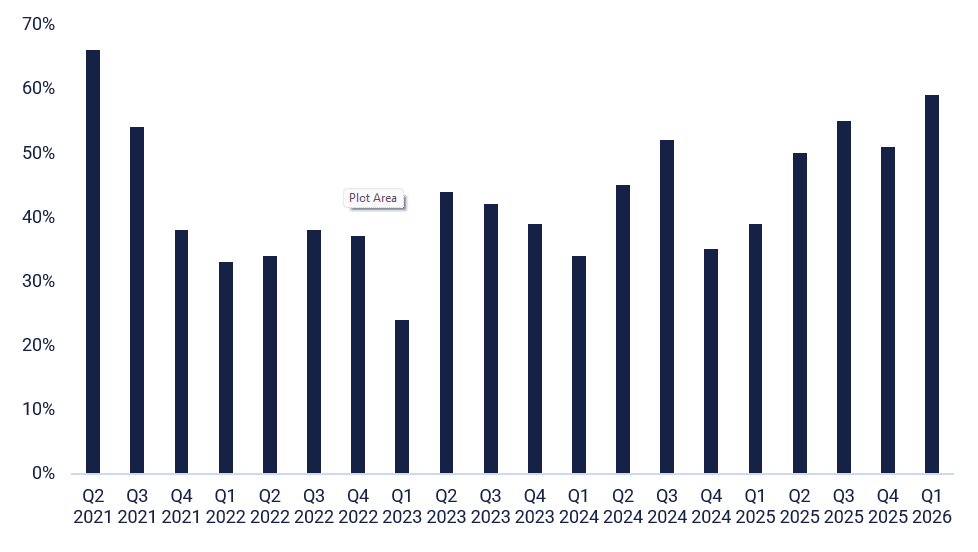
The S&P 500 Q1 2026 reporting season begins on Monday, April 13, with the major U.S. banks on the list. Analysts expect S&P 500 companies to see an average profit growth of 13.2% and revenue growth of 9.7% in Q1 2026. Ahead of the Q1 2026 earnings season, the Information Technology sector has the highest number of positive earnings guidance, which also marks an overall increase for the S&P 500 universe (see graph below).
S&P500. Positive earnings guidance (% of all). Five-year quarterly chart
An interim report from Delta Air Lines is released today, Wednesday, 8 April. Starting with Japan's current account balance for February, today's macro news feed continues with Germany's industrial orders and the Eurozone's producer price index and retail sales, all for February. There will also be an interest rate announcement from India's central bank, as well as Fed minutes from the March 18 policy meeting. Additionally, the Department of Energy will release weekly statistics on U.S. oil inventories.
Interim reports from the Danish company Stolt-Nielsen and the U.S. company Fast Retailing are expected on Thursday, April 9. Norwegian is expected to release traffic figures for March. Germany will release two important macroeconomic reports on the trade balance and industrial production in February. From the US, we will receive data on personal consumption and inflation (PCE), as well as wholesale inventories for February, GDP for Q4, and initial weekly jobless claims.
On Friday, April 10, we will receive interim reports from the Swedish real estate company Atrium Ljungberg and the Swedish investment company Industrivärden. The day's macroeconomic news will begin in Asia, where we will receive the March producer price index from Japan and China, as well as the March consumer price index from China. We will also receive the March consumer price indices for Denmark and Norway, as well as new orders for Swedish industry and total household consumption in Sweden for February. Germany and the US will publish their March consumer price indexes. The US will also release the April Michigan Index and February industrial orders.
The risk is skewed to the upside, but this could change quickly
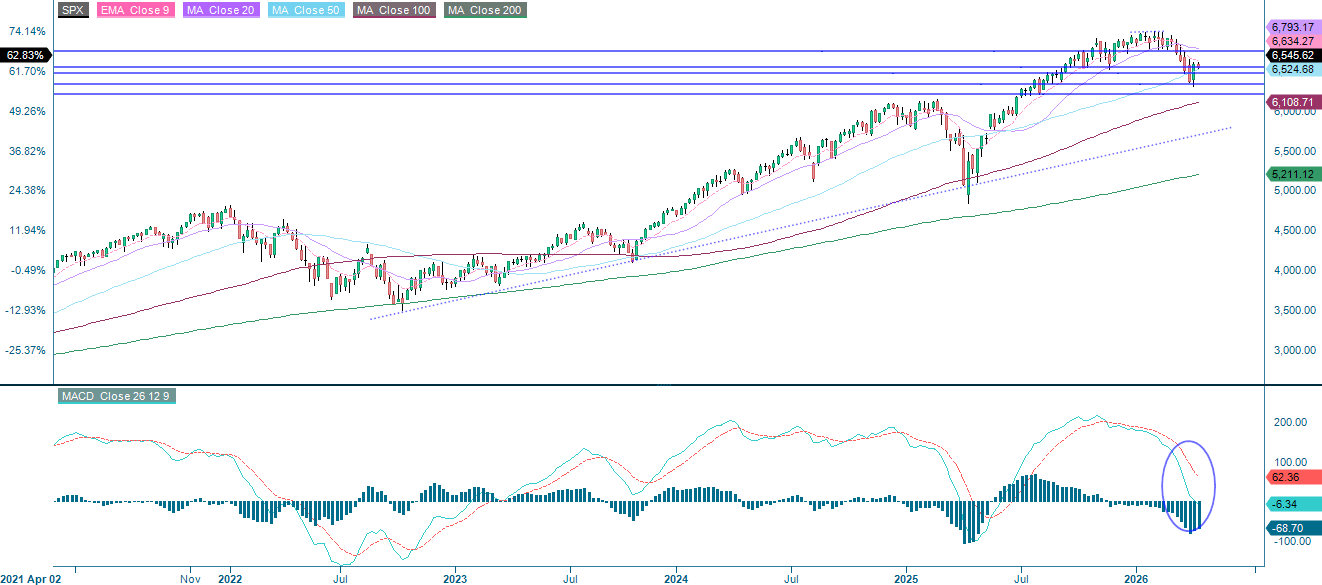
Sentiment was lifted as the S&P 500 bounced off support on Tuesday last week, driven by reports that US allies were pushing for a last-minute deal with Iran and a strong US jobs report for March. As the chart below shows, the index is now testing the 20-day moving average (MA20), which is currently at 6,582. Note the MACD, which has generated a soft buy signal. A clean break above this level would put the 200-day moving average (MA200) at 6,654 in play, with 6,755 the next level to watch beyond that. However, any escalation in geopolitical tensions and a spike in oil prices could quickly reverse this positive trend. On the downside, support sits at around 6,475 and 6,340.
Related Products
S&P 500 (in USD), one-year daily chart

S&P 500 (in USD), five-year weekly chart
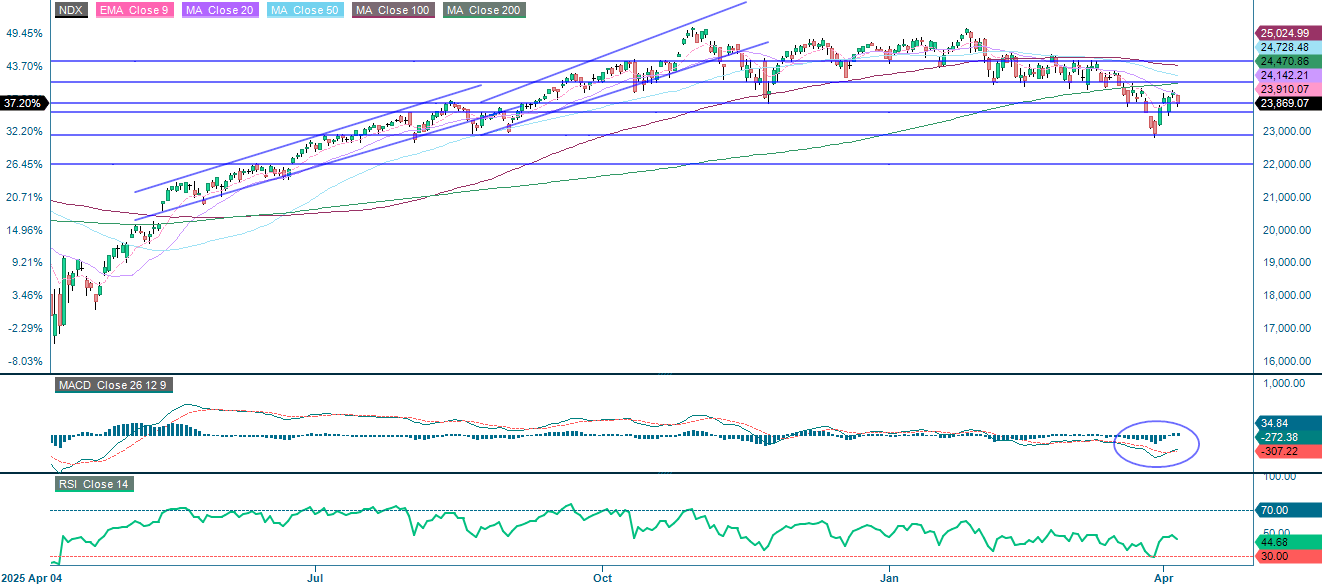
Since last Tuesday, the NASDAQ-100 has outperformed the broader S&P 500, led by growth and mega-cap tech. However, the MA20 still needs to break before the resistance level of around 24,470 comes into play. Support sits at 23,858 and then at 22,900 on the downside.
Related Products
NASDAQ-100 (in USD), one-year daily chart
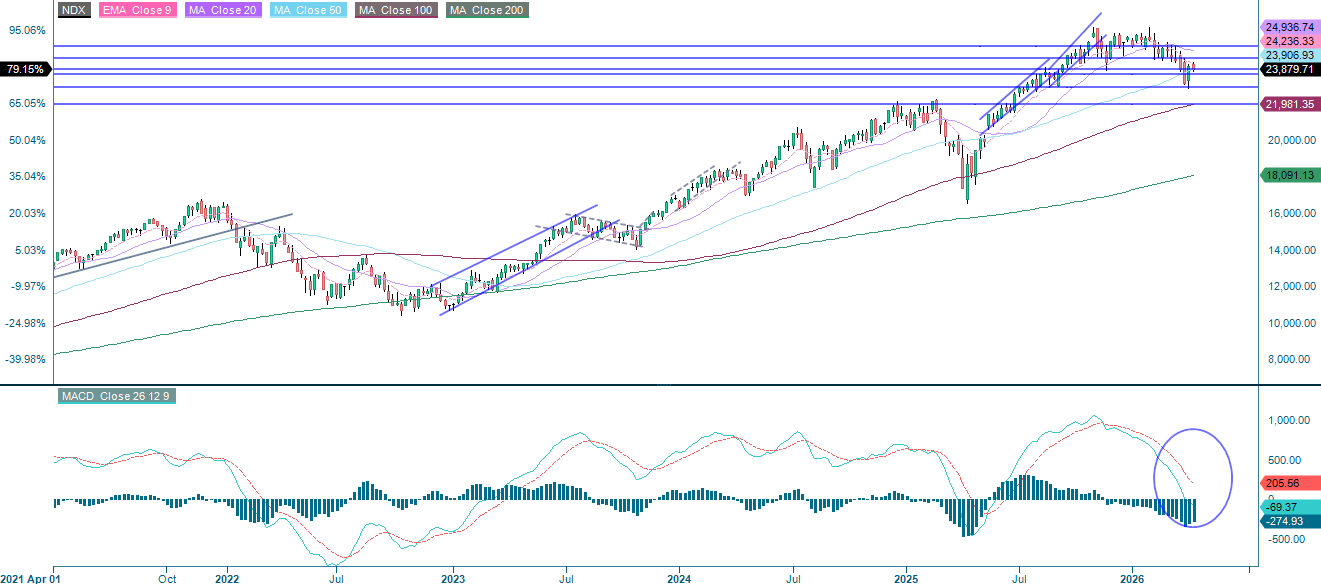
NASDAQ-100 (in USD), five-year weekly chart
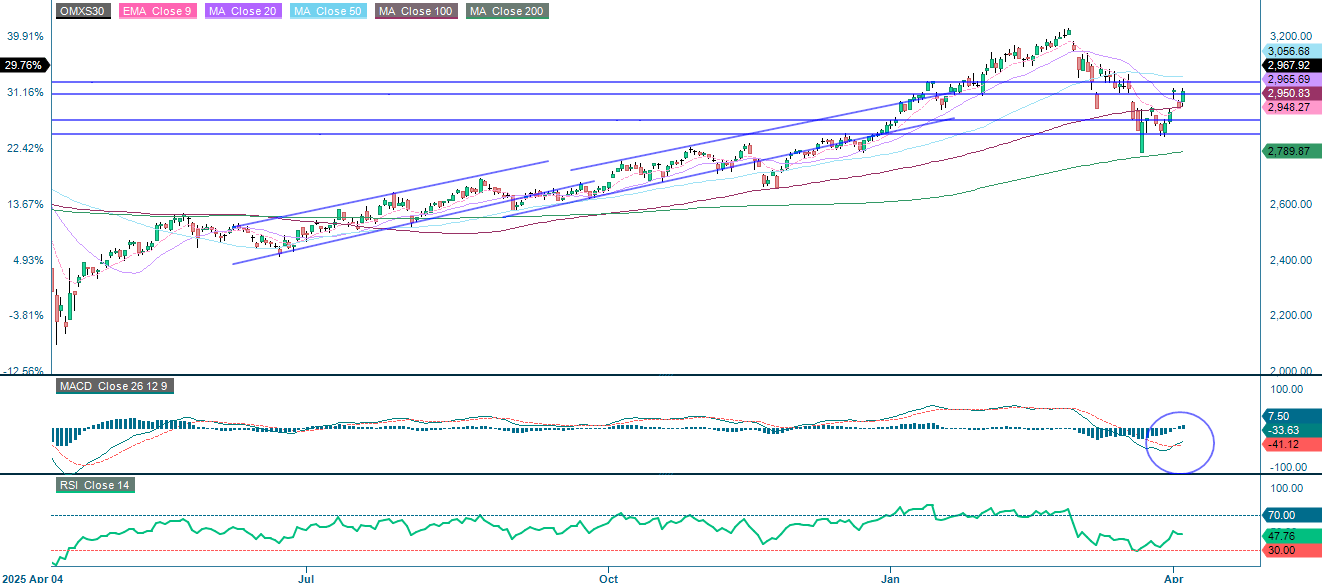
In Sweden, the OMXS30 index is trading above the 20-day moving average (MA20) and testing resistance around the 3,000 level. Upside resistance is found between 3,035 and the MA50, which is currently at 3,056. Support is found just below 3,000 on the downside, followed by 2,900 and 2,850.
OMX30 (in SEK), one-year daily chart
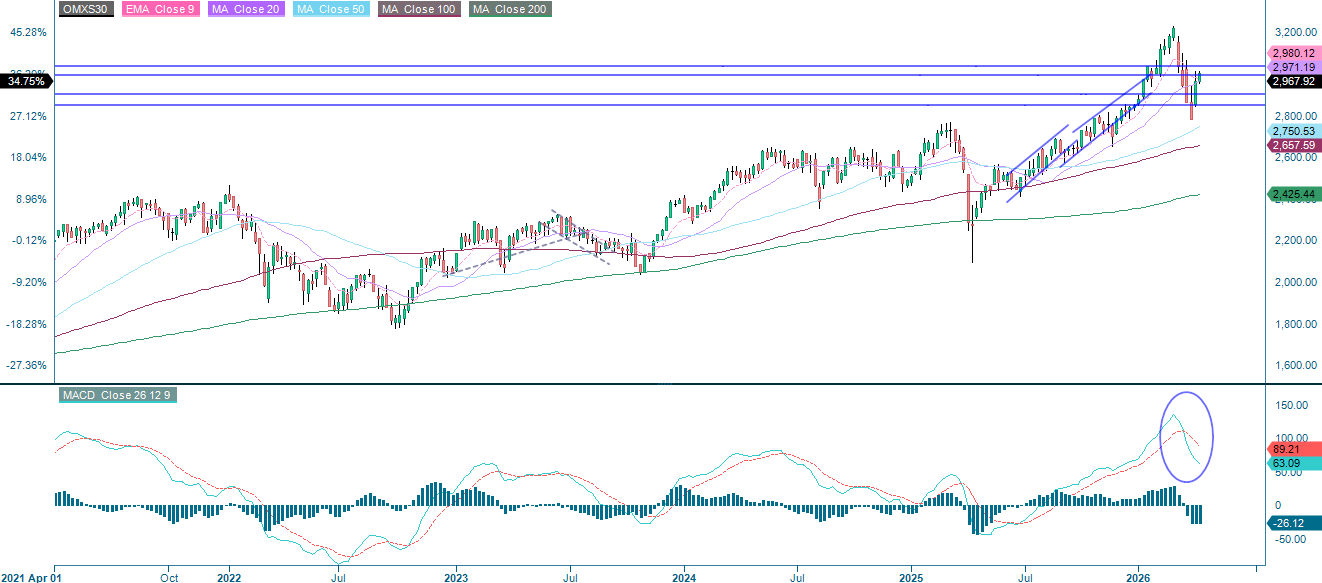
OMX30 (in SEK), five-year weekly chart
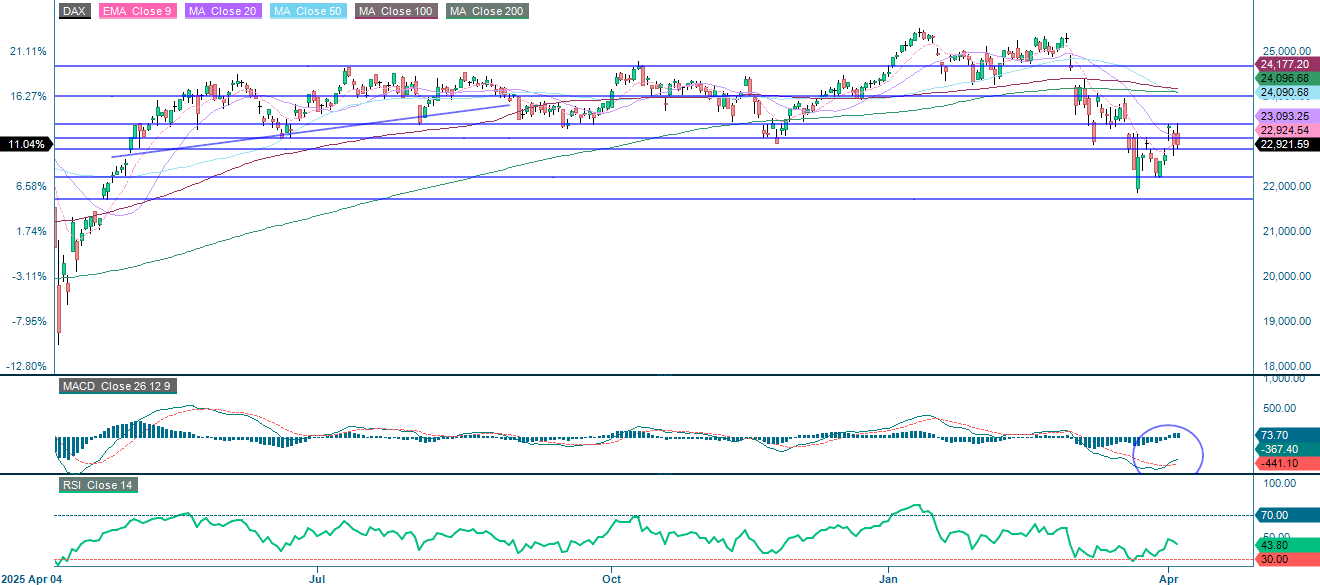
By contrast, the DAX never managed to break above the MA20. A move below 22,825 would open the door to 22,200. Conversely, breaking above the MA20 at 23,093 would put 23,365, and subsequently 24,000, back within reach.
Related Products
DAX (in EUR), one-year daily chart
DAX (in EUR), five-year weekly chart

The full name for abbreviations used in the previous text:
EMA 9: 9-Day Exponential Moving Average
Fibonacci: There are several Fibonacci lines used in technical analysis. Fibonacci numbers are a sequence in which each successive number is the sum of the two previous numbers.
MA20: 20-Day Moving Average
MA50: 50-Day Moving Average
MA100: 100-Day Moving Average
MA200: 200-Day Moving Average
MACD: Moving Average Convergence Divergence
Risks
Credit risk of the issuer:
Investors in the products are exposed to the risk that the Issuer or the Guarantor may not be able to meet its obligations under the products. A total loss of the invested capital is possible. The products are not subject to any deposit protection.
Currency risk:
If the product currency differs from the currency of the underlying asset, the value of a product will also depend on the exchange rate between the respective currencies. As a result, the value of a product can fluctuate significantly.
Disclaimer:
This information is neither an investment advice nor an investment or investment strategy recommendation, but advertisement. The complete information on the products (securities) mentioned herein, in particular the structure and risks associated with an investment, are described in the base prospectus, together with any supplements, as well as the final terms relating to the securities. The base prospectus and final terms constitute the solely binding sales documents for the products mentioned herein. It is recommended that potential investors read these documents before making any investment decision. The documents and the key information document are published on the website of the issuer, Vontobel Financial Products GmbH, Bockenheimer Landstrasse 24, 60323 Frankfurt am Main, Germany, on https://prospectus.vontobel.com and are available from the issuer free of charge. The approval of the prospectus should not be understood as an endorsement of the securities. The securities are products that are not simple and may be difficult to understand. This information includes or relates to figures of past performance. Past performance is not a reliable indicator of future performance. This information may only be distributed or published in countries where such distribution or publication is permitted by applicable law. As stated in the relevant base prospectus, the distribution of the securities mentioned in this information is subject to restrictions in certain jurisdictions. This advertisement may not be reproduced or redistributed without prior permission by Vontobel.
© Bank Vontobel Europe AG and / or affiliated companies. All rights reserved.
External author:
This information is in the sole responsibility of the guest author and does not necessarily represent the opinion of Bank Vontobel Europe AG or any other company of the Vontobel Group. This information is sponsored by Bank Vontobel Europe AG, which may be a counterparty to transactions involving the financial instruments discussed in this information. The further development of the index or a company as well as its share price depends on a large number of company-, group- and sector-specific as well as economic factors. When forming his investment decision, each investor must take into account the risk of price losses. Please note that investing in these products will not generate ongoing income.
The products are not capital protected, in the worst case a total loss of the invested capital is possible. In the event of insolvency of the issuer and the guarantor, the investor bears the risk of a total loss of his investment. In any case, investors should note that past performance and / or analysts' opinions are no adequate indicator of future performance. The performance of the underlyings depends on a variety of economic, entrepreneurial and political factors that should be taken into account in the formation of a market expectation.
Market risk:
The value of the products can fall significantly below the purchase price due to changes in market factors, especially if the value of the underlying asset falls. The products are not capital-protected
Product costs:
Product and possible financing costs reduce the value of the products.
Risk with leverage products:
Due to the leverage effect, there is an increased risk of loss (risk of total loss) with leverage products, e.g. Bull & Bear Certificates, Warrants and Mini Futures.