Bitcoin and Ethereum in the crosshairs of Middle East conflict and interest rate pressure

The cryptocurrency market has shown exceptional maturity in March 2026. While the escalating situation in the Middle East and rising oil prices have shaken traditional exchanges, Bitcoin and Ethereum have largelyremained stable. Investors are now wondering whether this is a gathering of forces or the calm before the storm.
Geopolitics and the impact on crypto markets
The Strait of Hormuz crisis which began in early March quickly pushed crude oil prices above $100 per barrel. Traditionally, such uncertaintywould trigger a “risk-off” reaction, but this time the crypto market has reacted with restraint. Bitcoin and Ethereum have performed more consistently than many major stock indices or even gold, which is considered a traditional safe haven asset.
Even before the crisis began, both assets were moving sideways, and this has continued throughout the crisis. Bitcoin has remained in a range of around $65,000 to $72,000, while Ethereum has fluctuated between $1,900 and $2,200. Although there have been larger isolated price movements, prices have quickly returned to within these limits.
Regulatory clarification and interest rate policy
A major breakthrough in regulation occurred on March 17, 2026, when the SEC and CFTC issued joint guidance creating a new “token taxonomy.” This framework classifies most crypto assets, including Bitcoin and Ethereum, as non-securities “digital commodities.” This distinguishes commodities from digital collectibles, tools, stablecoins, and digital securities, providing much-needed institutional clarity to the market. While the comprehensive Digital Asset Market Clarity Act (CLARITY Act) remains stalled in the Senate, the regulators' new joint guidance from the regulators has provided investors with valuableinformation.
Despite the regulatory security, the Fed’s tight policy limits the immediate upside potential. At the March meeting, the target rate was left unchanged at 3.50-3.75%. The central bank has been forced to revise its inflation forecast upwards to around 2.7%, primarirly due to rising energy costs resulting fromthe conflict in the Middle East. This presents a natural headwind to the price development of cryptocurrencies.
Technical analysis
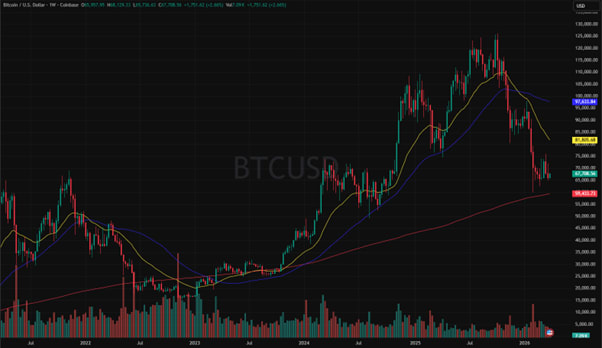
The Bitcoin price chart (BTC / USD) shows how the price of Bitcoin has mailny moved sideways during February and March. When looking at the 5-year chart (weekly candles), the price has fallen close to the SMA200 moving average, which can provide insight into a possible support area slightly below the current price level. On the daily chart, the price has already been moving below the SMA200 moving average for a long time. An ascending trendline (white) has been drawn on the 1-year chart, providing more insight into the technical picture of the underlying asset. If the price can stay above this trendline, this could be interpreted asa bullish sign for Bitcoin's future price movements. However, if the price falls clearly below this trendline, Bitcoin's technical outlook would weaken, which could trigger a significant downward movement.
Related Products
Bitcoin / US dollar, 1 year graph

Bitcoin / US dollar, 5 year graph
The Ethereum (ETH / USD) price chart shows similar price movements to Bitcoin in March. However, an anomaly can be noted when looking at the 5-year chart (weekly candles), the price is below the SMA200 moving average. In this respect, Ethereum's technical picture is slightly weaker than Bitcoin’S when viewed in a broader context. The 1-year chart also shows a similar ascending trendline (white), to that seen in Bitcoin. If the price remains above this trendline, Ethereum has a clear backstop in the event of a decline, however, a clear downward break of the trendline could cause an even larger and possibly rapid decline.
Related Products
Ethereum / US dollar, 1 year graph

Ethereum / US dollar, 5 year graph

Summary
March 2026 has shown that the crypto market has reached a new level of maturity. Not only have Bitcoin and Ethereum have not only reacted to headlines with volatility, they have even acted more as considered portfolio components in the eyes of investors even amid global crises. Althought high interest rates and the oil shock have limited growth, the crypto market’s ability to withstand global shocks without a major collapse indicates its establishment as a recognised asset class in the global investment world.
Indicators shown on the graphs:
● SMA200: 200-day moving average, red.
● SMA50: 50-day moving average, blue.
● EMA25: 25-day exponential moving average, yellow.
● Volume.
Risks
Credit risk of the issuer:
Investors in the products are exposed to the risk that the Issuer or the Guarantor may not be able to meet its obligations under the products. A total loss of the invested capital is possible. The products are not subject to any deposit protection.
Currency risk:
If the product currency differs from the currency of the underlying asset, the value of a product will also depend on the exchange rate between the respective currencies. As a result, the value of a product can fluctuate significantly.
Market risk:
The value of the products can fall significantly below the purchase price due to changes in market factors, especially if the value of the underlying asset falls. The products are not capital-protected
Product costs:
Product and possible financing costs reduce the value of the products.
Risk with leverage products:
Due to the leverage effect, there is an increased risk of loss (risk of total loss) with leverage products, e.g. Bull & Bear Certificates, Warrants and Mini Futures.
External author:
This information is in the sole responsibility of the guest author and does not necessarily represent the opinion of Bank Vontobel Europe AG or any other company of the Vontobel Group. This information is sponsored by Bank Vontobel Europe AG, which may be a counterparty to transactions involving the financial instruments discussed in this information. The further development of the index or a company as well as its share price depends on a large number of company-, group- and sector-specific as well as economic factors. When forming his investment decision, each investor must take into account the risk of price losses. Please note that investing in these products will not generate ongoing income.
The products are not capital protected, in the worst case a total loss of the invested capital is possible. In the event of insolvency of the issuer and the guarantor, the investor bears the risk of a total loss of his investment. In any case, investors should note that past performance and / or analysts' opinions are no adequate indicator of future performance. The performance of the underlyings depends on a variety of economic, entrepreneurial and political factors that should be taken into account in the formation of a market expectation.
Disclaimer:
This information is neither an investment advice nor an investment or investment strategy recommendation, but advertisement. The complete information on the products (securities) mentioned herein, in particular the structure and risks associated with an investment, are described in the base prospectus, together with any supplements, as well as the final terms relating to the securities. The base prospectus and final terms constitute the solely binding sales documents for the products mentioned herein. It is recommended that potential investors read these documents before making any investment decision. The documents and the key information document are published on the website of the issuer, Vontobel Financial Products GmbH, Bockenheimer Landstrasse 24, 60323 Frankfurt am Main, Germany, on https://prospectus.vontobel.com and are available from the issuer free of charge. The approval of the prospectus should not be understood as an endorsement of the securities. The securities are products that are not simple and may be difficult to understand. This information includes or relates to figures of past performance. Past performance is not a reliable indicator of future performance. This information may only be distributed or published in countries where such distribution or publication is permitted by applicable law. As stated in the relevant base prospectus, the distribution of the securities mentioned in this information is subject to restrictions in certain jurisdictions. This advertisement may not be reproduced or redistributed without prior permission by Vontobel.
© Bank Vontobel Europe AG and / or affiliated companies. All rights reserved.