Focus on investors' exposure to the U.S. and gold


The price of gold and other precious metals has been volatile in recent weeks. One main reason for this is the "flight to safety," whereby investors aim to reduce their exposure to the USD. However, after gold prices dropped 20%, we now believe that gold is trending up again. Of the S&P 500 sectors, the Communication Services and Information Technology sectors have experienced the highest proportion of positive earnings surprises. In our technical analysis of the S&P 500 and NASDAQ, we argue that lower interest rates could trigger a renewed price rally.
Case of the week: Will the price of gold stage a rapid comeback?
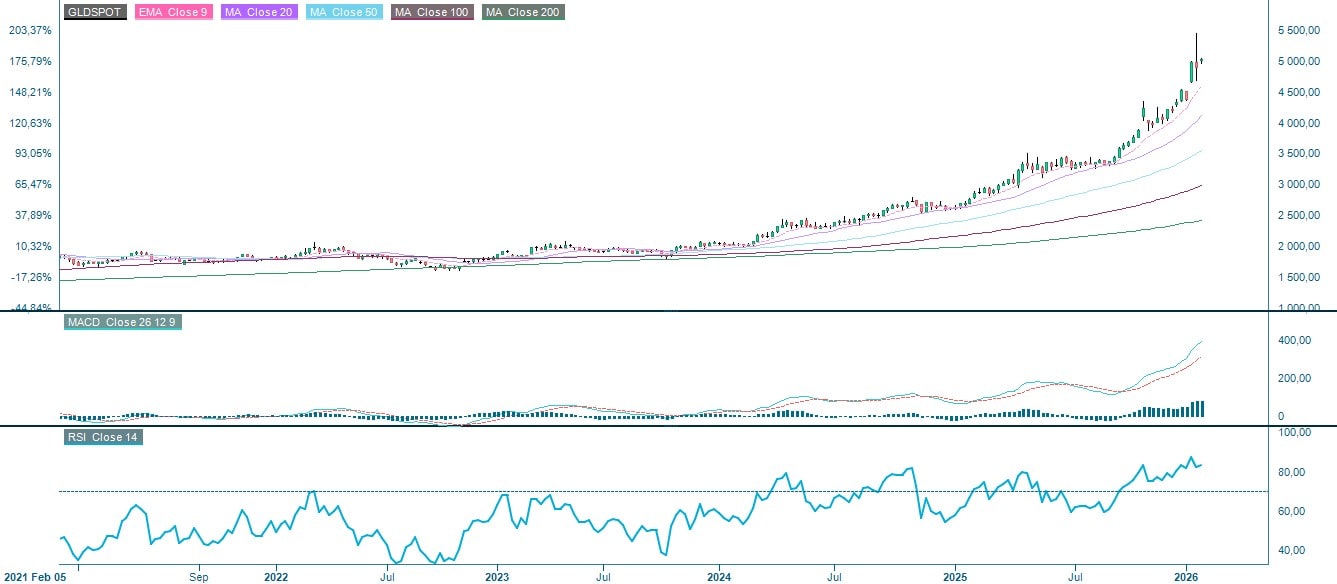
There has been significant volatility in precious metals. In recent weeks. Substantial price increases in silver and gold since the beginning of 2025 culminated in parabolic upward movement, followed by a sharp correction. The gold price subsequently dropped by approximately USD 1,200 from highs around USD 5,600 per troy ounce — over 20 percent — before recovering somewhat.
Key factors behind the increase in gold prices include concerns over sovereign debt, particularly in the US, and the returns on fixed-income assets. Combined with a more aggressive U.S. foreign policy, central banks and private investors have diversified away from U.S. bonds into precious metals, primarily gold. Geopolitical events so far in 2026, including US military operations in Venezuela and rhetoric surrounding the possible annexation of Greenland, have undoubtedly contributed to this trend.
Despite the volatility, the gold price has managed to avoid entering a bear market for now (i.e., a prolonged correction of more than 20 percent) for now. Currently, gold futures have recovered to around USD 5,000 per troy ounce, and prices are trending bullishly above the 20-day moving average (MA20) level.
One question is whether gold can climb back toward its all-time highs in the short term, or if it will consolidate over a longer period. If the price falls below $5,000 USD, the MA20 at approximately $4,840 USD could provide support. Over the next couple of weeks, the price development could likely be influenced by macroeconomic news and other geopolitical events. This week, the US Consumer Price Index (CPI) and nonfarm payroll numbers will offer insight into US inflation and the job market. The latter has shown signs of deterioration. On February 20, the US Supreme Court may rule on the legality of Trump’s tariffs. If the tariffs are deemed illegal, the US dollar might drop, and precious metals might consequently gain.
Gold spot indicator (USD per troy ounce), one-year daily chart

Gold spot indicator (USD per troy ounce), five-year weekly chart
Related Products
Macro comments
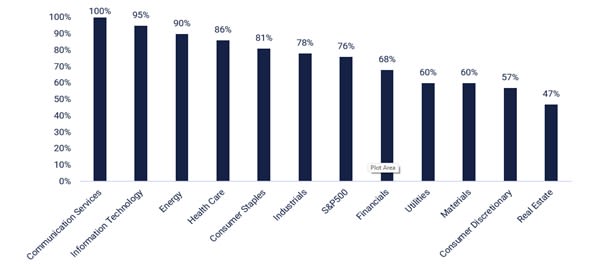
As of 6 February 2026, 59% of S&P 500 companies had reported their Q4 2025 results. According to Earnings Insight, 76% of these companies reported positive earnings per share (EPS), with 73% experiencing positive revenue surprises. Earnings growth in Q4 of 2025 has increased from 12% to 13% over the past week. For Q1 of 2026, Wall Street analysts are projecting earnings growth of 11.3% and revenue growth of 8.7%. The graph below illustrates the earnings scorecard in the form of better-than-anticipated EPS in Q4 of 2025, ranked by S&P 500 sector.
By Friday, 6 February 2026, 71 of the Swedish OMX companies for which consensus figures were available had published their Q4 2025 earnings. 56% of these results were better than expected, and revenues exceeded analysts' estimates in 44% of cases. Of the eight companies that reported order intake for which there were consensus expectations, five (63%) exceeded them.
S&P 500 earnings above estimates in Q4 2025, ranked by sector
The following major Nordic companies will report their quarterly results on Wednesday, February 11: Aker BP, Kojamo, Storebrand, Sweco and Yara. Also reporting their Q4 2025 results are the German bank Commerzbank and major US companies Cisco, McDonald's, Shopify, and T-Mobile US. In terms of macro statistics, China's consumer and producer price indexes will star for January. OPEC will release a monthly oil report. The United States will release the January Nonfarm Payroll report and the weekly oil stock statistics from the Department of Energy.
On Thursday, February 12, the following companies will report their interim results: Swedish companies Nibe and Hufvudstaden, as well as Finnish companies Kemira, Metso, Outokumpu, and Tietoevry, Norwegian companies Orkla and Veidekke, and Danish company TGS. Companies outside the Nordic region reporting will include Mercedes-Benz and Siemens (Germany), Nestlé (Switzerland), Unilever (United Kingdom), SoftBank (Japan), as well as Anheuser-Busch InBev, Applied Materials, Arista Networks and Twilio (U.S.). Turning to macro news, we begin with Japan's producer price index for January. Next is the UK's Gross Domestic Product (GDP) for Q4 and industrial production in December. The IEA will release a monthly oil report. The U.S. will release weekly jobless claims and existing home sales for January.
On Friday 13 February, we will receive interim reports from the following major Nordic companies: Aker, Elkem, Huhtamaki, Kalmar, Norsk Hydro, Norwegian and Tomra. Major companies reporting quarterly outside of the Nordic region include the French luxury goods company Hermès International and the aerospace and defence company Safran, the American biotech company Moderna, and the Japanese electronics company Sony. The macro news starts with Germany's wholesale prices and Spain's consumer price index for January, followed by the release of the Eurozone's December trade balance and Q4 GDP. The US will release CPI for January.
Could yields be the trigger for new highs in the U.S.?
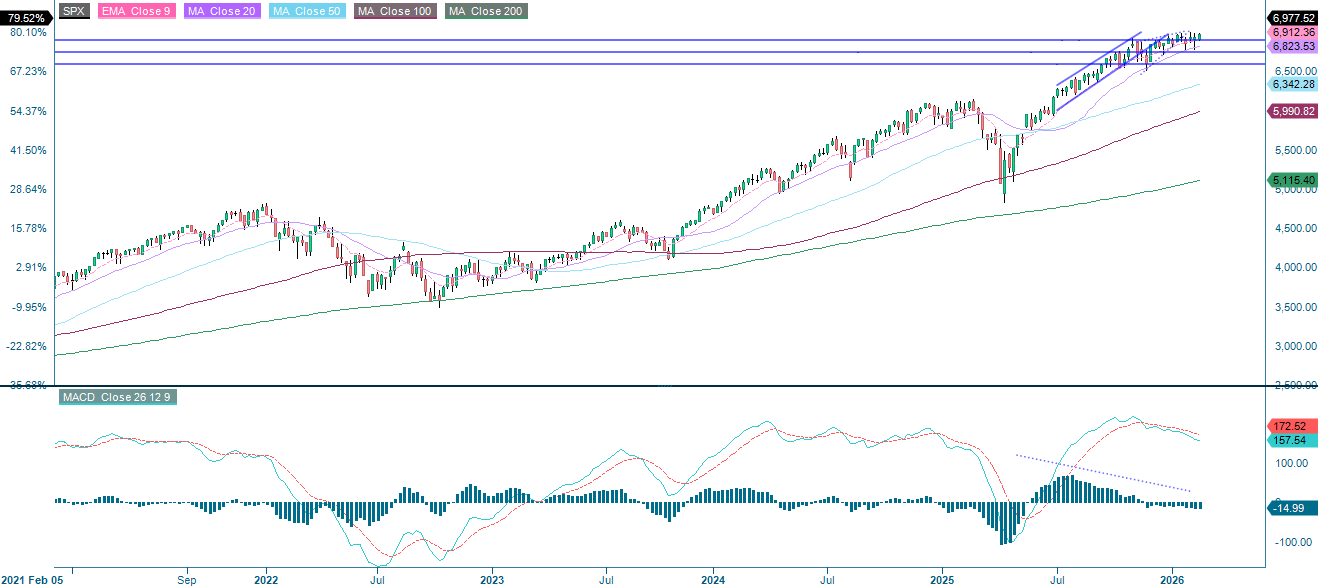
The S&P 500 rebounded convincingly from support at the 100-day moving average (MA100), bolstered by robust earnings reports from AMD and Alphabet. However, the current bounce has not provided enough momentum for the index to reach new highs. Therefore, the S&P 500 may continue consolidating within the range between 6,807 and 7,000 for a while.
Related Products
S&P 500 (in USD), one-year daily chart

S&P 500 (in USD), five-year weekly chart
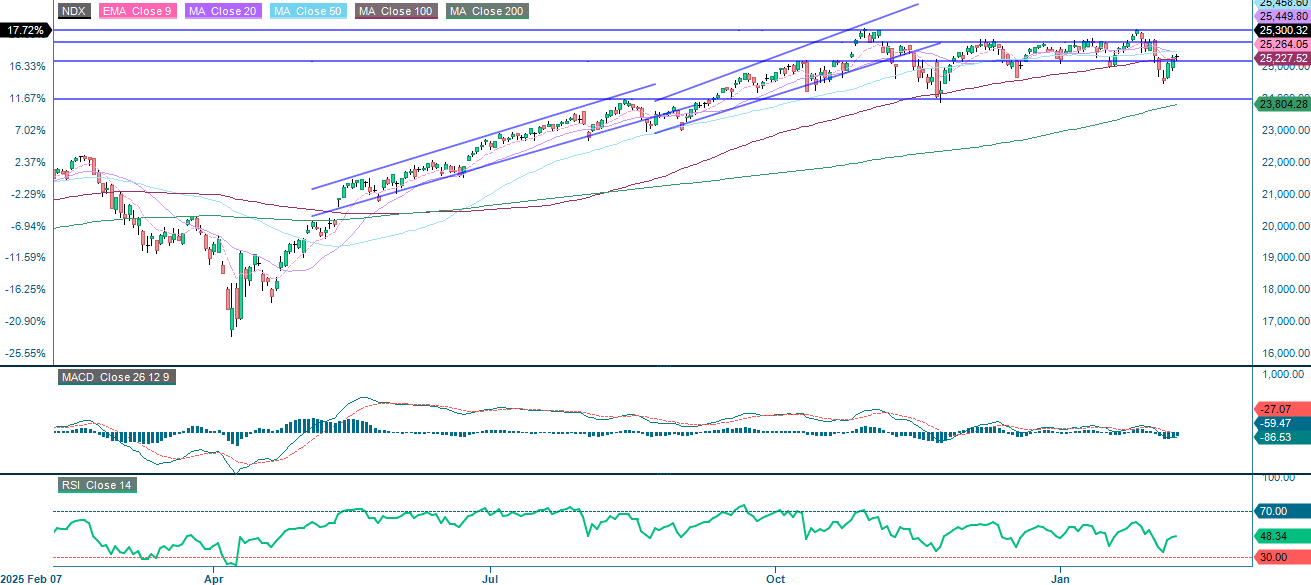
The NASDAQ-100 is currently facing resistance at around 25,540. Ahead of Friday’s CPI release, the U.S. 2-year Treasury yield is approaching a 12-month low. Further weakness in yields could be a catalyst for equities and help the NASDAQ-100 regain positive momentum.
Nasdaq-100 (in USD), one-year daily chart
Nasdaq-100 (in USD), five-year weekly chart

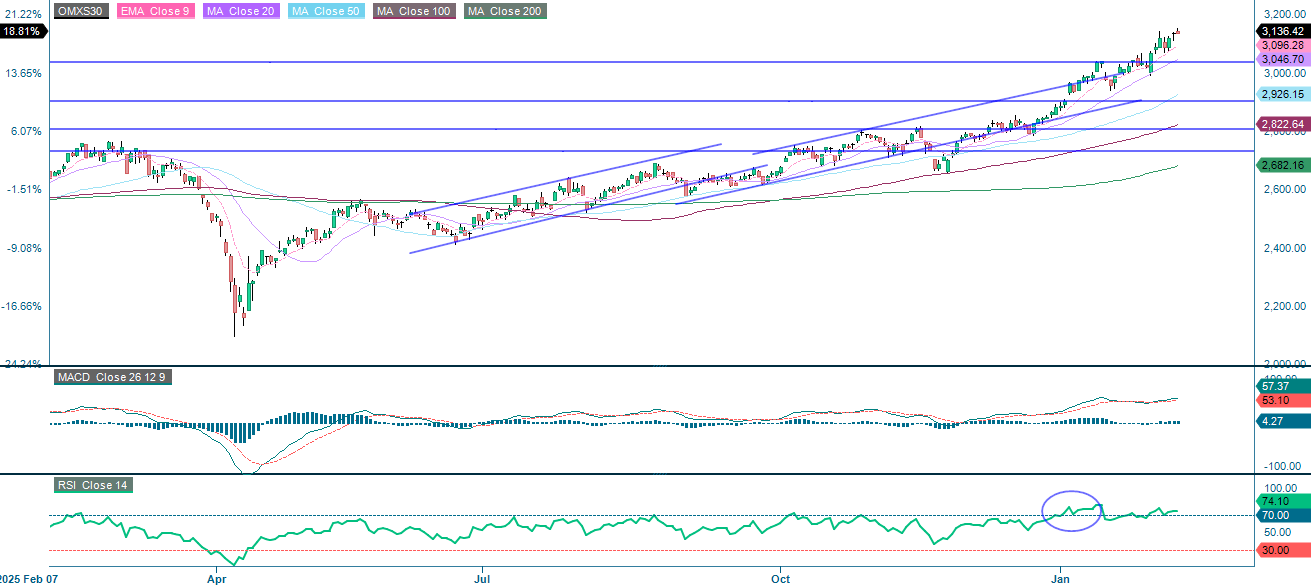
In Sweden, the OMXS30 continues to trend higher, despite the Relative Strength Index (RSI) indicating overbought conditions. The index has been supported by Investor, a heavyweight that has boosted overall performance. Therefore, keep an eye on the Investor share price.
OMX30 (in SEK), one-year daily chart
OMX30 (in SEK), five-year weekly chart

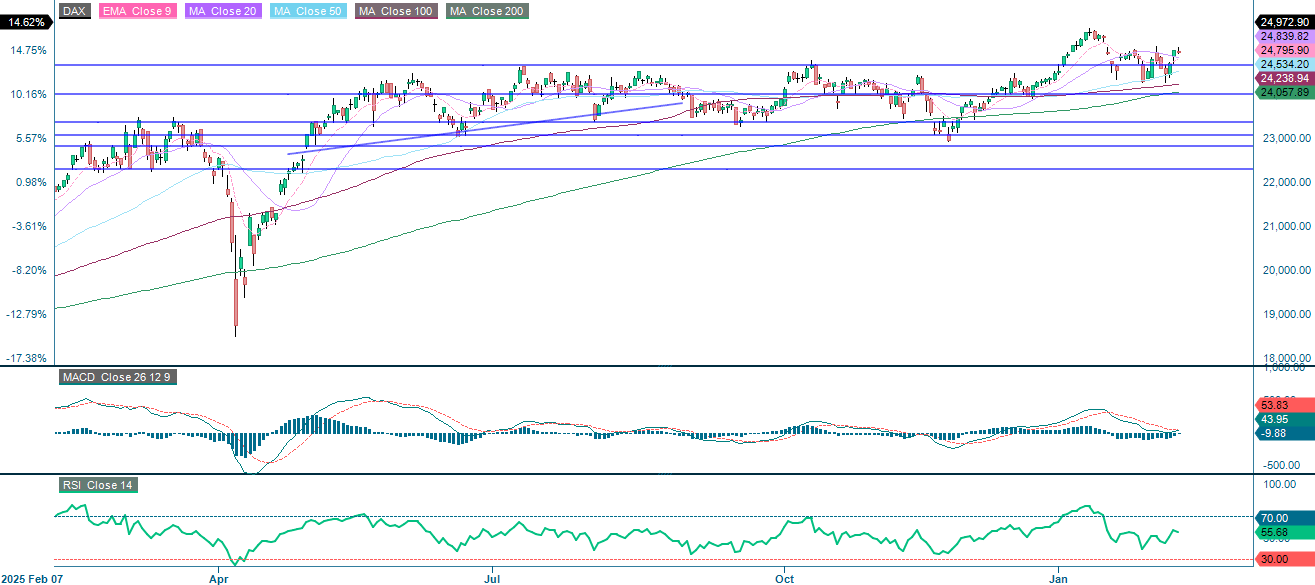
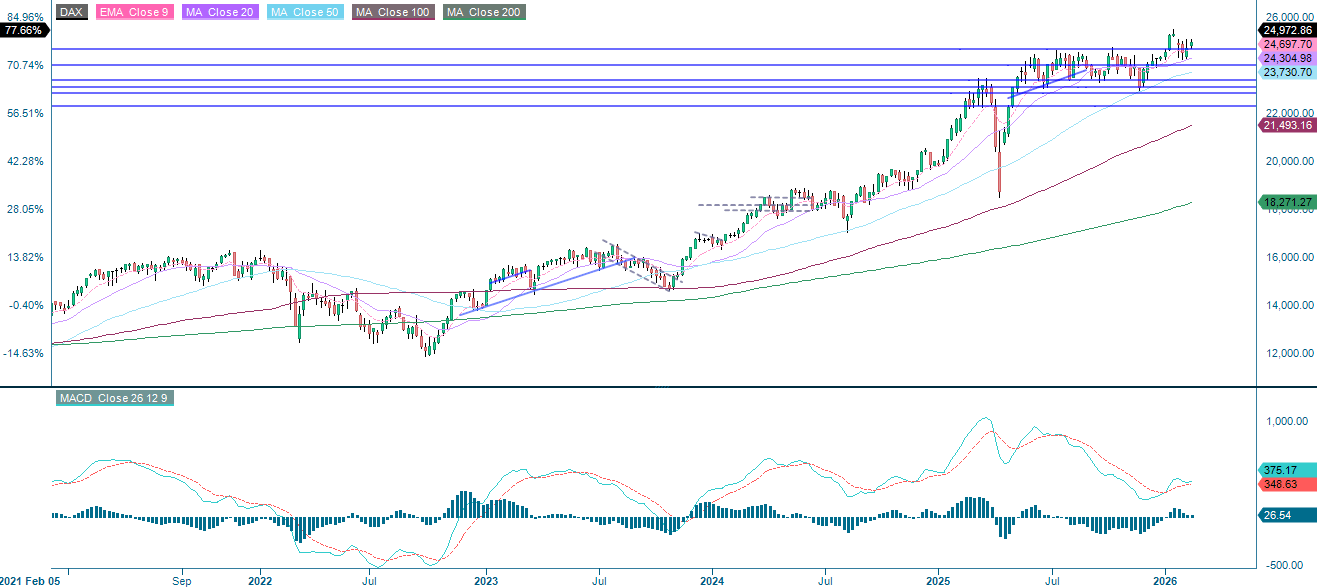
The DAX in Germany is consolidating, with the Moving Average Convergence Divergence (MACD) edging toward a tentative buy signal. Improving momentum in the U.S. could provide additional support for the DAX.
Related Products
DAX (in EUR), one-year daily chart
DAX (in EUR), five-year weekly chart
The full name for abbreviations used in the previous text:
EMA 9: 9-Day Exponential Moving Average
Fibonacci: There are several Fibonacci lines used in technical analysis. Fibonacci numbers are a sequence in which each successive number is the sum of the two previous numbers.
MA20: 20-day Moving Average
MA50: 50-day Moving Average
MA100: 100-day Moving Average
MA200: 200-day Moving Average
MACD: Moving Average Convergence Divergence
Risks
Credit risk of the issuer:
Investors in the products are exposed to the risk that the Issuer or the Guarantor may not be able to meet its obligations under the products. A total loss of the invested capital is possible. The products are not subject to any deposit protection.
Currency risk:
If the product currency differs from the currency of the underlying asset, the value of a product will also depend on the exchange rate between the respective currencies. As a result, the value of a product can fluctuate significantly.
External author:
This information is in the sole responsibility of the guest author and does not necessarily represent the opinion of Bank Vontobel Europe AG or any other company of the Vontobel Group. This information is sponsored by Bank Vontobel Europe AG, which may be a counterparty to transactions involving the financial instruments discussed in this information. The further development of the index or a company as well as its share price depends on a large number of company-, group- and sector-specific as well as economic factors. When forming his investment decision, each investor must take into account the risk of price losses. Please note that investing in these products will not generate ongoing income.
The products are not capital protected, in the worst case a total loss of the invested capital is possible. In the event of insolvency of the issuer and the guarantor, the investor bears the risk of a total loss of his investment. In any case, investors should note that past performance and / or analysts' opinions are no adequate indicator of future performance. The performance of the underlyings depends on a variety of economic, entrepreneurial and political factors that should be taken into account in the formation of a market expectation.
Market risk:
The value of the products can fall significantly below the purchase price due to changes in market factors, especially if the value of the underlying asset falls. The products are not capital-protected
Product costs:
Product and possible financing costs reduce the value of the products.
Risk with leverage products:
Due to the leverage effect, there is an increased risk of loss (risk of total loss) with leverage products, e.g. Bull & Bear Certificates, Warrants and Mini Futures.
Disclaimer:
This information is neither an investment advice nor an investment or investment strategy recommendation, but advertisement. The complete information on the products (securities) mentioned herein, in particular the structure and risks associated with an investment, are described in the base prospectus, together with any supplements, as well as the final terms relating to the securities. The base prospectus and final terms constitute the solely binding sales documents for the products mentioned herein. It is recommended that potential investors read these documents before making any investment decision. The documents and the key information document are published on the website of the issuer, Vontobel Financial Products GmbH, Bockenheimer Landstrasse 24, 60323 Frankfurt am Main, Germany, on https://prospectus.vontobel.com and are available from the issuer free of charge. The approval of the prospectus should not be understood as an endorsement of the securities. The securities are products that are not simple and may be difficult to understand. This information includes or relates to figures of past performance. Past performance is not a reliable indicator of future performance. This information may only be distributed or published in countries where such distribution or publication is permitted by applicable law. As stated in the relevant base prospectus, the distribution of the securities mentioned in this information is subject to restrictions in certain jurisdictions. This advertisement may not be reproduced or redistributed without prior permission by Vontobel.
© Bank Vontobel Europe AG and / or affiliated companies. All rights reserved.