The earnings season starts

Earnings season is underway, and this week, the US banking and financial sector will begin reporting. JP Morgan, Bank of America, Morgan Stanley and Goldman Sachs will be among the companies to report their results. The results of major banks can set the tone for market expectations, but they also often highlight macroeconomic uncertainties.
Financial sector earnings first
Financial reporting has traditionally provided a solid start to the season, with results often in line with or slightly above expectations. However, the sector often highlights economic uncertainties such as geopolitical tensions and macroeconomic data. News from this sector, such as JP Morgan Chase’s large Security and Resiliency Initiative introduced last year, underscores its role in the broader economic context.
The financial sector performed strongly
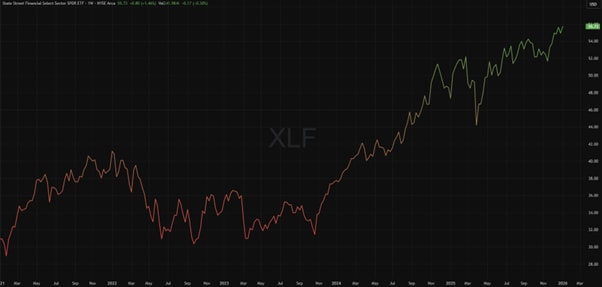
The financial sector has shown strong performance in late 2025 and early this year. This is also reflected in the price development of the XLF fund, which tracks the sector. XLF's price development provides a good framework for how much the financial sector's expectations may already be priced in before the start of the earnings season.
XLF, 5-year chart
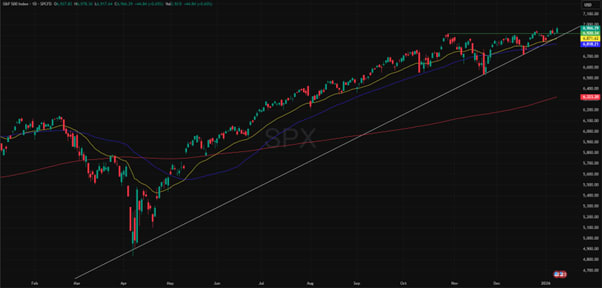
S&P 500, 1-year chart
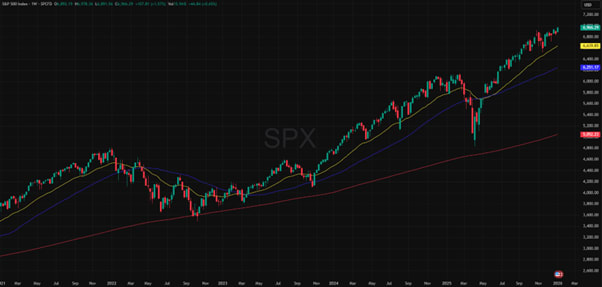
S&P 500, 5-year chart
Related Products
The S&P 500 index has performed positively at the end of last year and the beginning of this year. At the end of 2025, the index was able to make new ATH readings (All Time High) at the price level of $6,945, which can be considered positive for the entire market. This also made the technical outlook of the index even more positive as we moved into this year. The rise has continued at the beginning of this year, and the index has already been able to make new ATH readings (All Time High) in the first full trading week.
The price is above the moving averages visible on the chart showing EMA25 (25-Day Exponential Moving Average) in yellow, SMA50 (50-Day Simple Moving Average) in blue, SMA200 (200-Day Simple Moving Average) in red, and their order on the chart also indicates a clear upward trend. A horizontal line (green) is drawn on the 1-year chart from the peaks of October 2025, which can be considered an important level from a technical perspective. An ascending trend line (white) drawn through the bottoms is also visible, which provides additional insight into the technical picture of the index. In a possible downward correction, these levels and the moving averages shown on the chart could act as potential support areas. If the price falls below these levels or moving averages drawn on the chart, the technical picture of the index would weaken compared to the current situation.
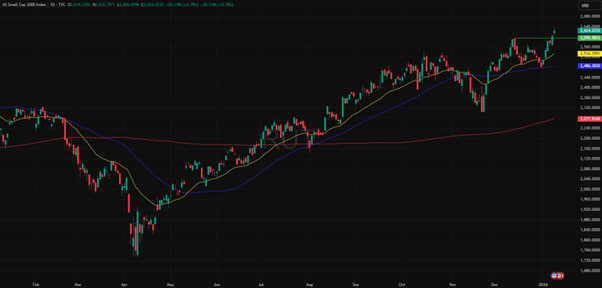
Russell 2000, 1-year chart
Russell 2000, 5-year chart
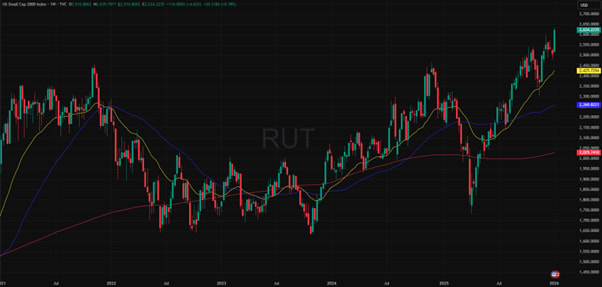
The upcoming earnings season and financial sector reporting can also be strongly reflected in the Russell 2000 index, given the significant share of the financial sector. Financial sector results can cause significant price movements in the index. Heading into the earnings season, the technical outlook of the Russell 2000 Index is positive. In early December 2025, the index reached new ATH readings (All Time High) at the price level of $2,595, but towards the end of 2025, the index saw a downward movement. However, since the beginning of this year, the index has performed positively, making new ATH readings (All Time High).
At the time of writing, the increase since the beginning of this year exceeds 5%. The price is above the moving averages visible on the chart (EMA25, SMA50, SMA200), and their order on the chart is in line with the uptrend. The 1-year chart also features a horizontal line (green) from the 2025 highs, which provides additional information about the index technical picture. If the price remains above that level, the technical outlook for the index will remain positive. Conversely, if the index sees a correction and the price falls below that level or the moving averages shown on the chart, the technical outlook would weaken.
Summary
The earnings season is about to begin with reports from the financial sector, which will provide initial information about the upcoming earnings season. Strong financial sector performance before the earnings season can provide a positive outlook, however, it also poses a risk of setting expectations too high.
Indicators shown on the graphs:
● SMA200: 200-Day Moving Average, red.
● SMA50: 50-Day Moving Average, blue.
● EMA25: 25-Day Exponential Moving Average, yellow.
Risks
Credit risk of the issuer:
Investors in the products are exposed to the risk that the Issuer or the Guarantor may not be able to meet its obligations under the products. A total loss of the invested capital is possible. The products are not subject to any deposit protection.
Currency risk:
If the product currency differs from the currency of the underlying asset, the value of a product will also depend on the exchange rate between the respective currencies. As a result, the value of a product can fluctuate significantly.
Market risk:
The value of the products can fall significantly below the purchase price due to changes in market factors, especially if the value of the underlying asset falls. The products are not capital-protected
Product costs:
Product and possible financing costs reduce the value of the products.
Risk with leverage products:
Due to the leverage effect, there is an increased risk of loss (risk of total loss) with leverage products, e.g. Bull & Bear Certificates, Warrants and Mini Futures.
External author:
This information is in the sole responsibility of the guest author and does not necessarily represent the opinion of Bank Vontobel Europe AG or any other company of the Vontobel Group. This information is sponsored by Bank Vontobel Europe AG, which may be a counterparty to transactions involving the financial instruments discussed in this information. The further development of the index or a company as well as its share price depends on a large number of company-, group- and sector-specific as well as economic factors. When forming his investment decision, each investor must take into account the risk of price losses. Please note that investing in these products will not generate ongoing income.
The products are not capital protected, in the worst case a total loss of the invested capital is possible. In the event of insolvency of the issuer and the guarantor, the investor bears the risk of a total loss of his investment. In any case, investors should note that past performance and / or analysts' opinions are no adequate indicator of future performance. The performance of the underlyings depends on a variety of economic, entrepreneurial and political factors that should be taken into account in the formation of a market expectation.
Disclaimer:
This information is neither an investment advice nor an investment or investment strategy recommendation, but advertisement. The complete information on the products (securities) mentioned herein, in particular the structure and risks associated with an investment, are described in the base prospectus, together with any supplements, as well as the final terms relating to the securities. The base prospectus and final terms constitute the solely binding sales documents for the products mentioned herein. It is recommended that potential investors read these documents before making any investment decision. The documents and the key information document are published on the website of the issuer, Vontobel Financial Products GmbH, Bockenheimer Landstrasse 24, 60323 Frankfurt am Main, Germany, on https://prospectus.vontobel.com and are available from the issuer free of charge. The approval of the prospectus should not be understood as an endorsement of the securities. The securities are products that are not simple and may be difficult to understand. This information includes or relates to figures of past performance. Past performance is not a reliable indicator of future performance. This information may only be distributed or published in countries where such distribution or publication is permitted by applicable law. As stated in the relevant base prospectus, the distribution of the securities mentioned in this information is subject to restrictions in certain jurisdictions. This advertisement may not be reproduced or redistributed without prior permission by Vontobel.
© Bank Vontobel Europe AG and / or affiliated companies. All rights reserved.