Investors are shifting towards financials and cyclicals


This week, a look at Novo Nordisk, whose stock has fallen sharply in 2025 due to slower growth. Meanwhile, Eli Lilly has gained market share in the diabetes and obesity sector with its lead drug, tirzepatide, compared to Novo's semaglutide. Although we are cautious about Novo Nordisk's interim report on 4 February 2026, the company has a robust pipeline of drug candidates expected to reach the market within the next few years. At a macro level, we have noted an investor rotation out of technology and into financials and cyclical sectors, the latter of which have benefited from the Fed’s rate cut last week.
Case of the week: Healthy development for Pharma - time for Novo to recover?
Despite US policy headwinds at the beginning of the year, the healthcare sector performed decently in 2025, only slightly underperforming the S&P 500 index by only a small margin. Pharmaceutical and biotech companies have performed well. This is evident in the performance of the IHE ETF, which comprises a portfolio of 47 pharmaceutical companies, with the largest weightings allocated to Eli Lilly and Johnson & Johnson. So far in 2025, the ETF has risen by nearly 30 per cent in USD terms.
A change of scene occurred at the beginning of October, when the political issues of Big Pharma started to ease. The Trump administration made deals with companies such as Pfizer and AstraZeneca to supply drugs directly to consumers at steep discounts via the federally run website, 'TrumpRx'. A separate agreement was also made to guarantee so-called Most Favoured Nation prices for Medicaid programmes. However, as these deals primarily affect the relatively small number of patients paying out of pocket, their impact on drug companies’ revenue is limited. For now, at least, the sector seems to have been let off the hook, as these measures are much milder than had been feared. Meanwhile, strong earnings and positive clinical updates from industry giants such as Johnson & Johnson and Eli Lilly have boosted sector performance.
Novo Nordisk share price vs US Pharmaceuticals ETF IHE (DKK), five-year chart
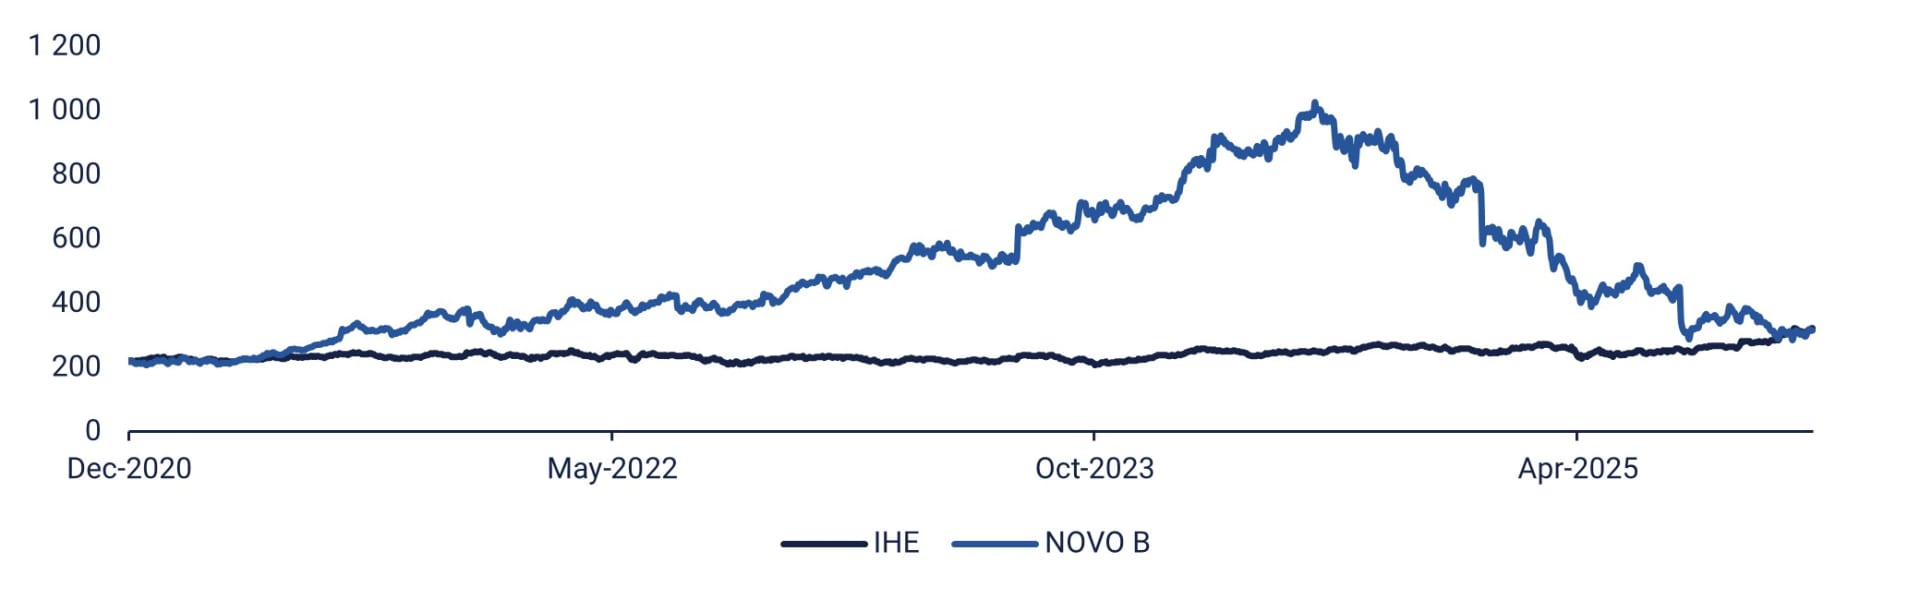
This contrasts with the decline in the value of Novo Nordisk shares. Once the clear leader in diabetes and obesity drugs, the Danish company has seen its growth fade as competitor Eli Lilly has proven to be more innovative and has rapidly captured market share. This is due to the superior weight-loss properties of the company's lead drug, tirzepatide, compared to Novo’s semaglutide. Following a drop in the share price of almost 70 per cent since its all-time high in summer 2024, the price-to-earnings ratio for the current year (2025E) is 13.7x for the Novo share (according to consensus estimates compiled by S&P Capital IQ), compared to 23x five years ago.
Growth prospects for 2026 are arguably dim due to competitive pressures in the diabetes sector and patent expiries in certain markets. Consequently, there is a risk that Novo will adopt a cautious approach in its Q4 report on 4 February 2026. Nevertheless, Novo has a robust pipeline of drug candidates expected to reach the market in the next few years. Notably, a pill version of the recently popular weight-loss drug Wegovy is anticipated to receive FDA approval before the end of 2025. It will be the first oral glucagon-like peptide-1 (GLP-1) analog drug for obesity, offering a more convenient alternative to current injectable treatments. Last week, a bill was introduced in the US Congress to limit the ability of compounding pharmacies to sell copies of drugs such as semaglutide in the US. This issue arose due to the shortage of weight loss drugs a few years ago, which prompted regulators to allow copies to be sold on the market. Despite the shortage now being resolved, copies are still being marketed, which impacts sales of branded drugs such as Wegovy. Therefore, a crackdown on these compounding pharmacies would benefit Novo. Overall, there is an opportunity for more positive news in the short term.
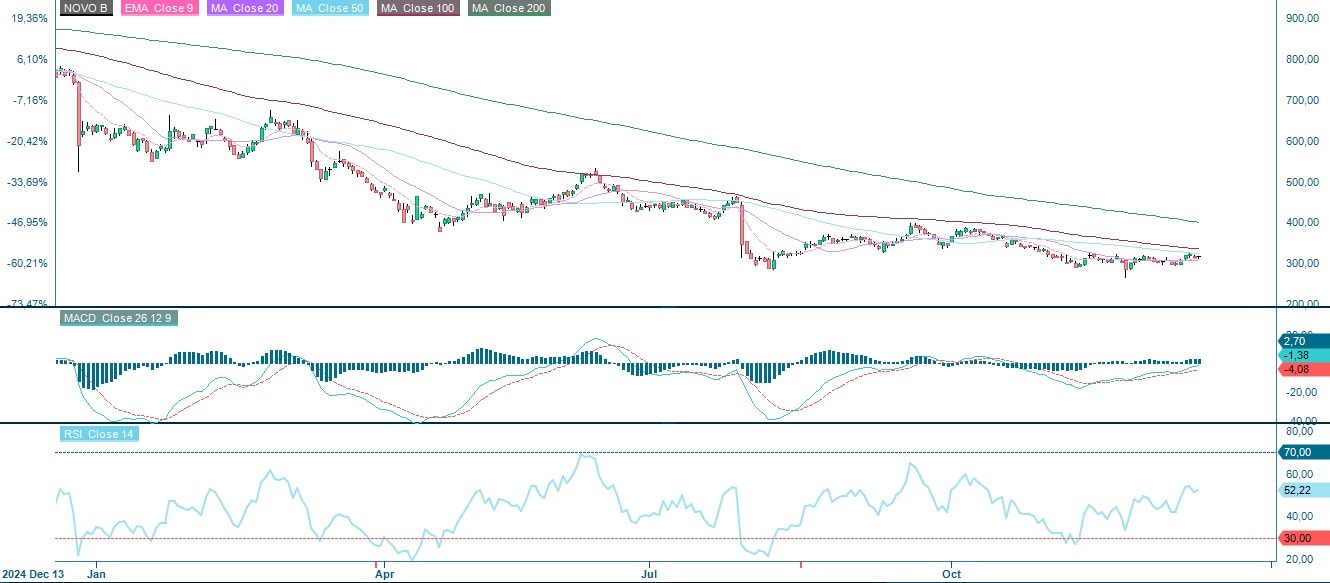
From a technical perspective, there are signs that the downtrend in the share price is ending. A double bottom occurred around DKK 290 per share in conjunction with the Q2 report in August and the negative outcome of the EVOKE Alzheimer's disease studies in November. The 50-Day Moving Average (MA50) level, at around DKK 327 per share, could act as a resistance level, while the 20-Day Moving Average (MA20) level, at approximately DKK 309, could provide support.
Related Products
Novo Nordisk (DKK), one-year daily chart
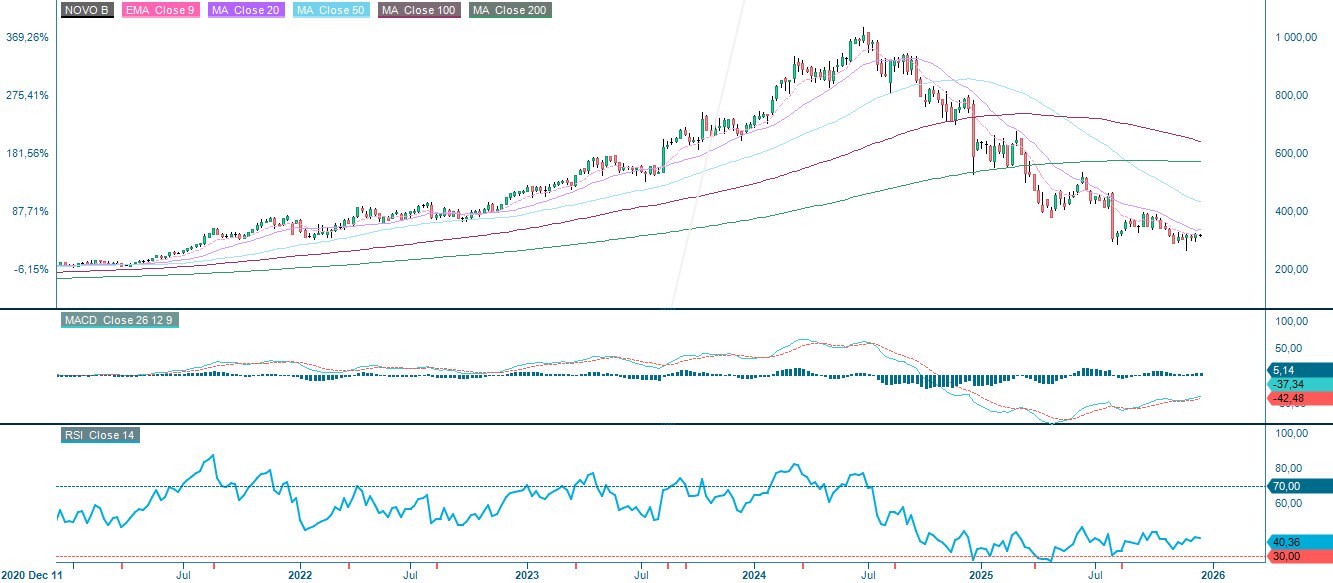
Novo Nordisk (DKK), five-year weekly chart
Macro comments
As expected, on Wednesday, December 10, the Federal Reserve lowered the US benchmark interest rate by 0.25%, on Wednesday, December 10, 2025, bringing it into a range of 3.50–3.75%. US stock markets rose, with the S&P 500 index up 0.7%. On Thursday, December 11, the day after the Fed rate announcement, developments in Europe and the US were broadly similar. The strongest performers within the S&P 500 were the cyclical sectors, with industrials performing the strongest at 1.8%. On Thursday, the strongest sectors were finance, basic industries and engineering, while the weakest were energy and information technology. The tech sector had a bad week following weaker-than-anticipated interim reports from Oracle and Broadcom. It finished the week down by 1.6%, dropping by 1.1% on Friday, December 12. From December 8 to 12, the Dow Jones increased by 1.1%, while the NASDAQ decreased by 2.2%.
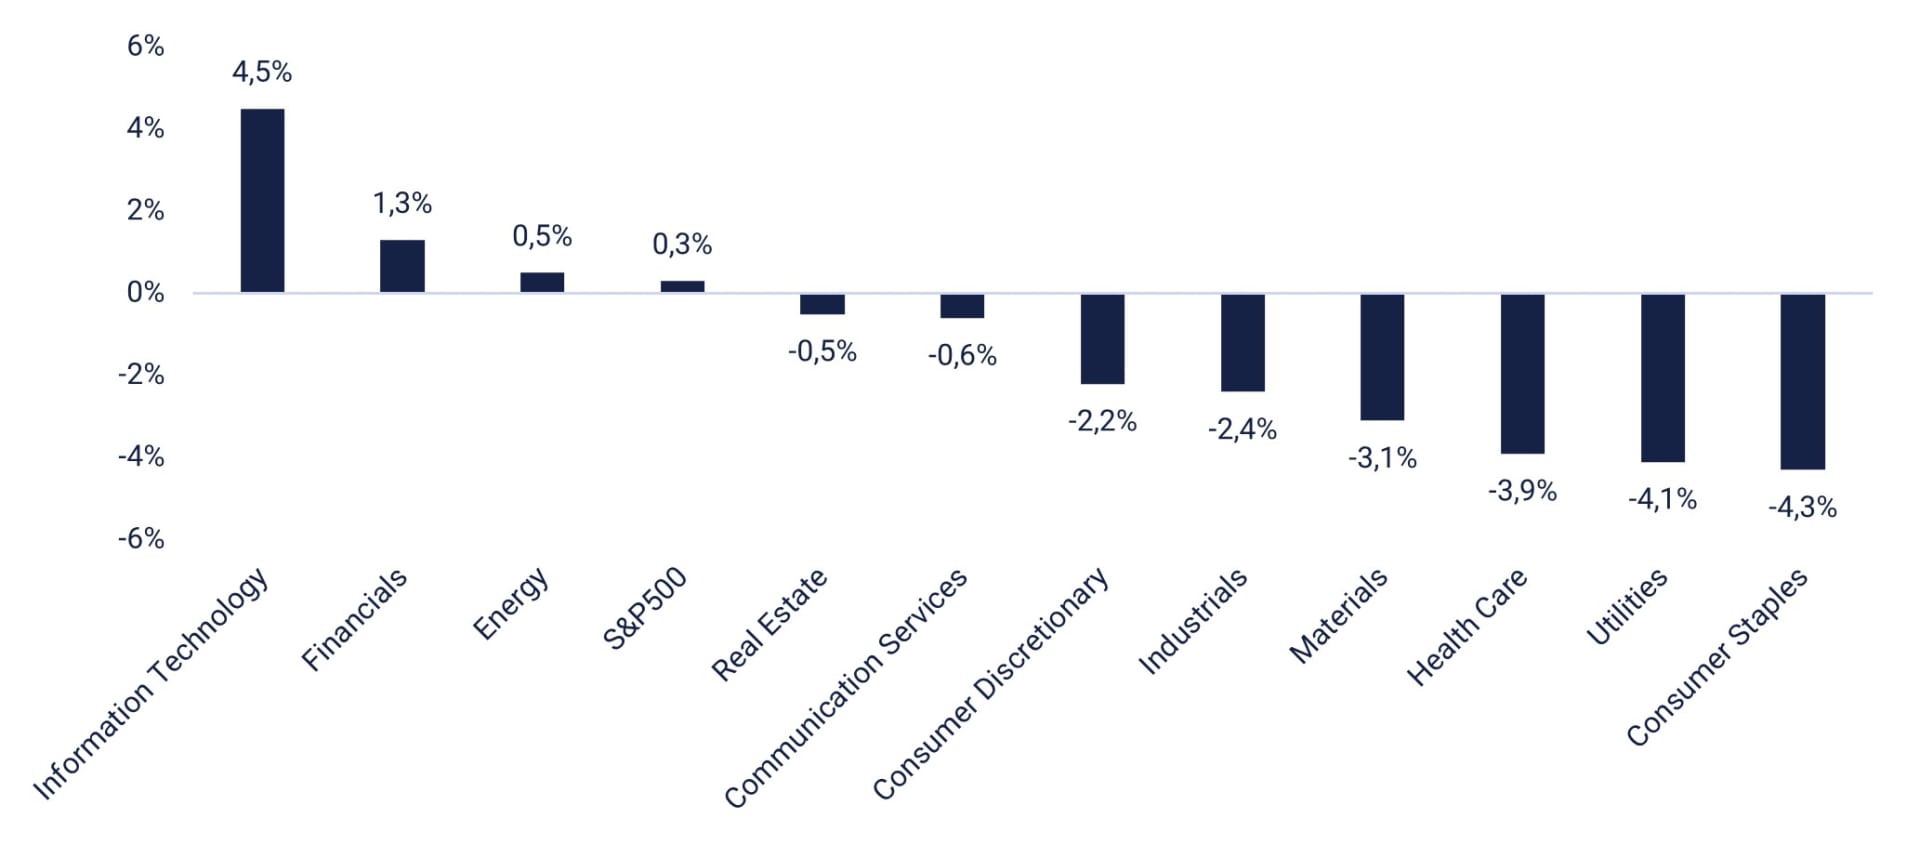
From September 30 to November 30 2025, Wall Street analysts raised their Q4 2025 earnings forecasts for S&P 500 companies by an average of 0.3%. As the graph below shows, the Information Technology sector saw the largest increase in Q4 2025 earnings estimates (4.5%), while analysts lowered their EPS estimates for the Industrial sector by 2.4%. The industrial sector was one of the sectors that gained the most from the Fed's interest rate decision, alongside real estate and utilities.
S&P 500: Change in sector-level EPS estimates for Q4 (September 30 to November 30 2025)
On Wednesday, December 17, the US company Micron Technology is scheduled to release its interim report. The day's macroeconomic news agenda begins with the release of Japan's machinery orders and trade balance figures for November. This will be followed by the UK's consumer and producer price indices for November. Next is Germany's IFO index for December. From the Eurozone, the Consumer Price Index for November and its labour cost index for Q3 will be published. At lunchtime in Europe, the UK's CBI industrial trends for December will be released. In the afternoon, attention turns to North America, where Canada's Consumer Price Index (CPI) for November and the US Department of Energy's weekly oil stock statistics will be published.
On Thursday, December 18, the following US companies are due to release their interim reports: Accenture, Cintas, FedEx and Nike. In terms of macro statistics, the French industry confidence indicator for December will be released. Construction production figures for October will also be published in the Eurozone. However, the US will provide the most macroeconomic data on Thursday, including the November Consumer Price Index (CPI), the December Philadelphia Fed Index and the December Kansas City Fed Index, as well as weekly initial jobless claims. The Riksbank in Sweden, the Norges Bank in Norway, the Bank of England and the ECB will anonounce their interest rates. The EU is also holding a summit in Brussels.
On Friday December 19, the macro news starts with Japan's CPI for November and an interest rate announcement from the Bank of Japan will be released. A few hours later, retail sales figures for November will be released in Sweden and the UK. The NIESR (Swedish: “Konjunkturinstitutet”) will release a business barometer for December. This will be followed by Germany's GfK consumer confidence index for January and the producer price index for November. The UK will present its CBI industrial trends for December. Finally, in terms of Europe, we receive a confidence indicator for Eurozone households in December. The US will contribute existing home sales figures for November and the Michigan index for December.
Would you dare to go against Santa?
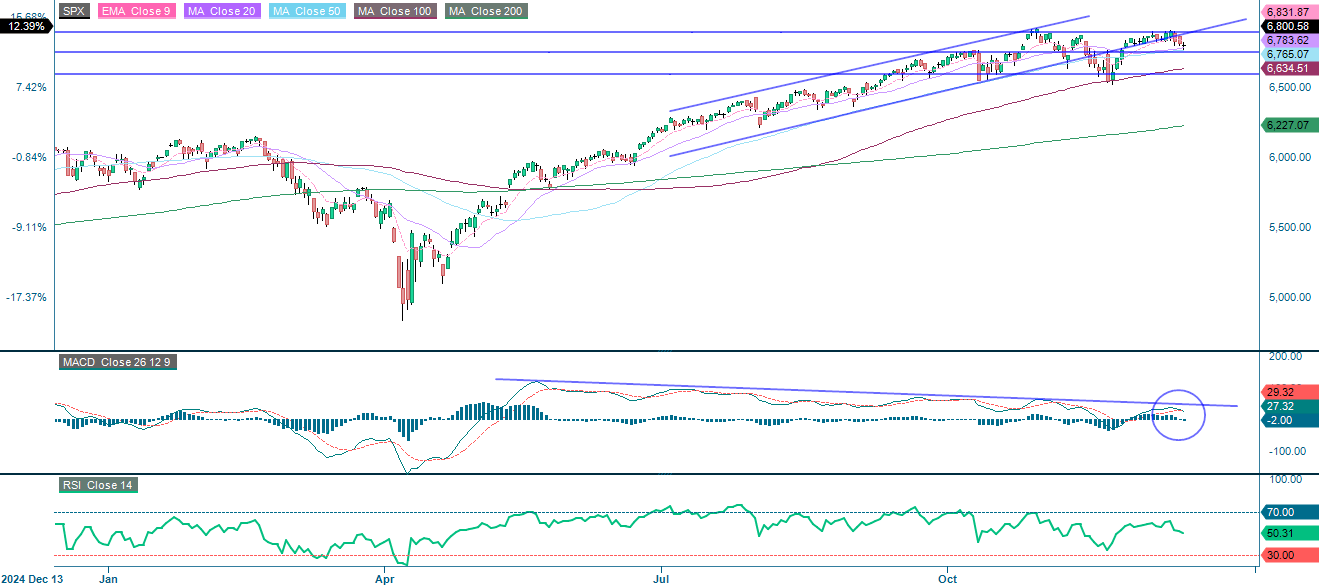
So far, Santa has been unable to push the S&P 500 to new, decisive highs. Meanwhile, momentum is fading, and the Moving Average Convergence Divergence (MACD) has produced a mild sell signal. Breaking below the 20-Day Moving Average and 6,750 could lead to a further downside movement towards the 100-day Moving Average, which is currently at 6,634.
Related Products
S&P 500 (in USD), one-year daily chart
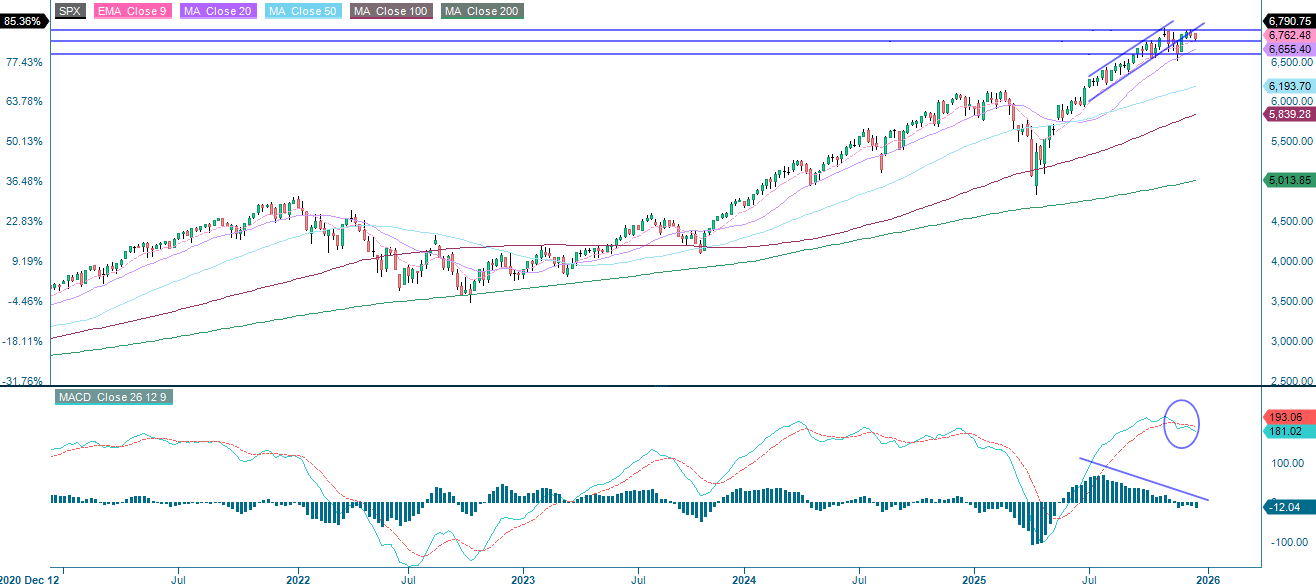
S&P 500 (in USD), five-year weekly chart
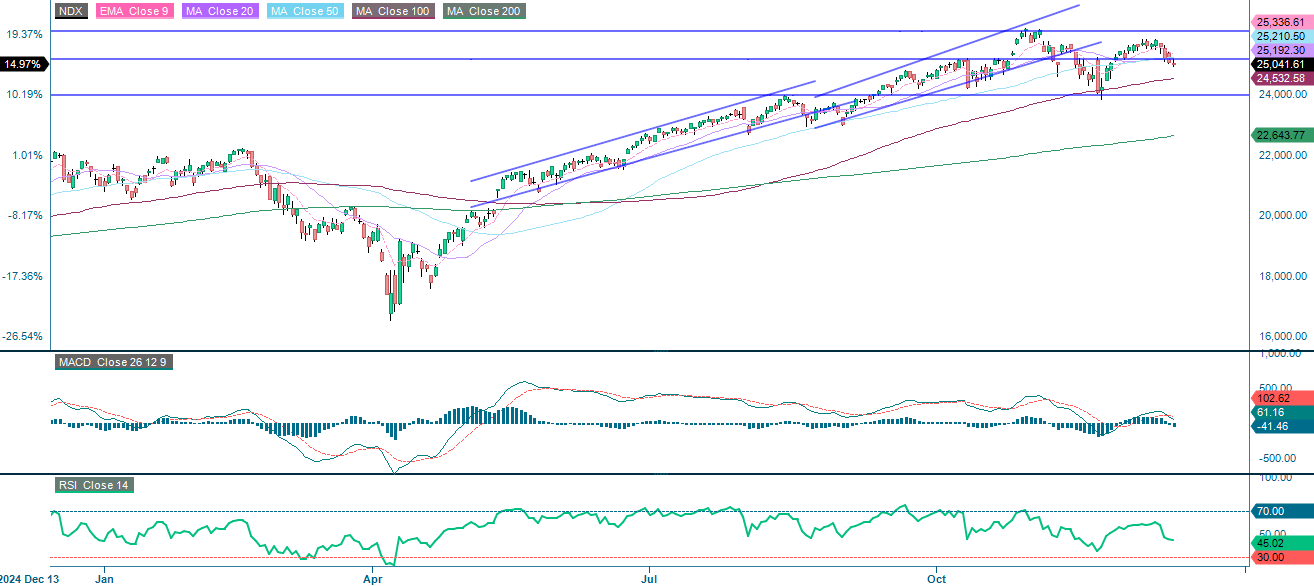
The NASDAQ-100 is currently trading below the 25,150 support level. Moving Average Convergence Divergence (MACD) has again generated another soft sell signal, and the index is approaching the 24.532 Moving Average (MA). However, while the 10-year US Treasury yield has started to trade sideways, the 2-year yield is falling. Would you dare to go against Santa?
Related Products
NASDAQ-100 (in USD), one-year daily chart
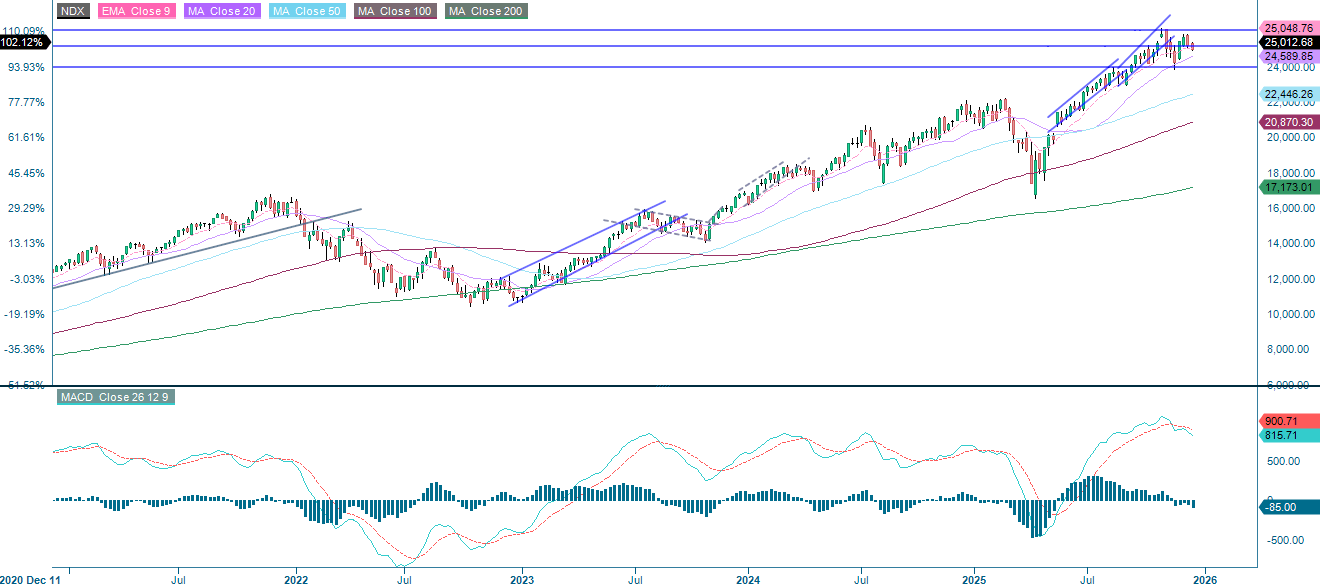
NASDAQ-100 (in USD), five-year weekly chart
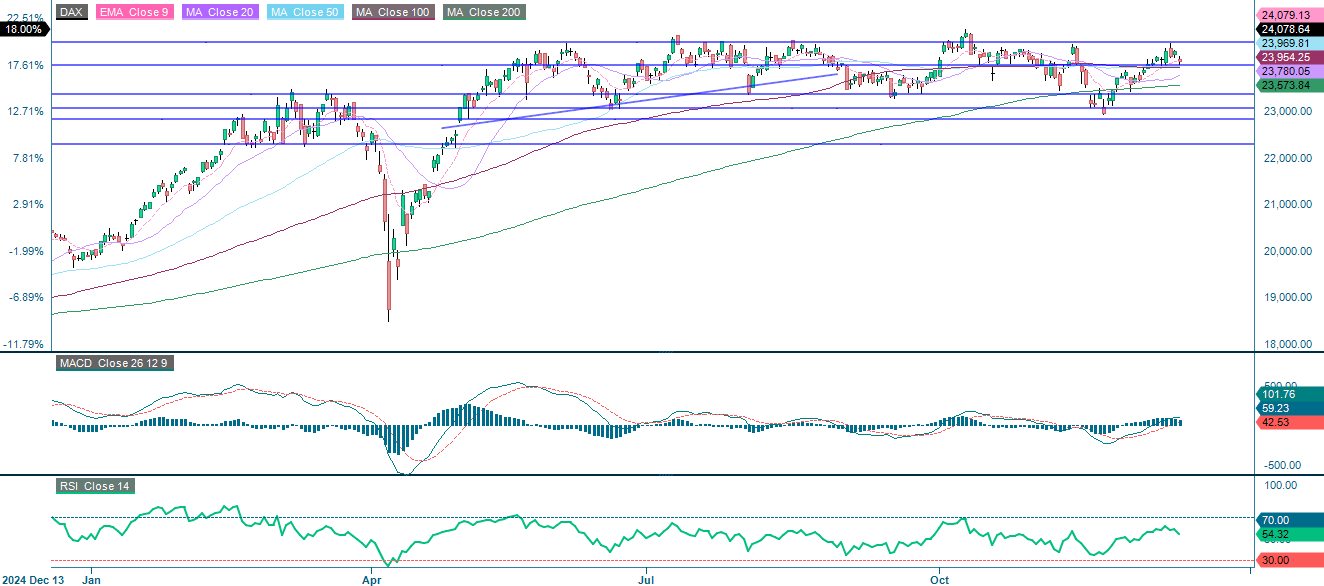
The German DAX is currently trading below the 9-Day Exponential Moving Average (EMA9) but above the 100-Day Moving Average (MA100). The next step could be a break below the MA100 and 20-Day Moving Average (MA20), which are currently at 23,779.
Related Products
DAX (in EUR), one-year daily chart
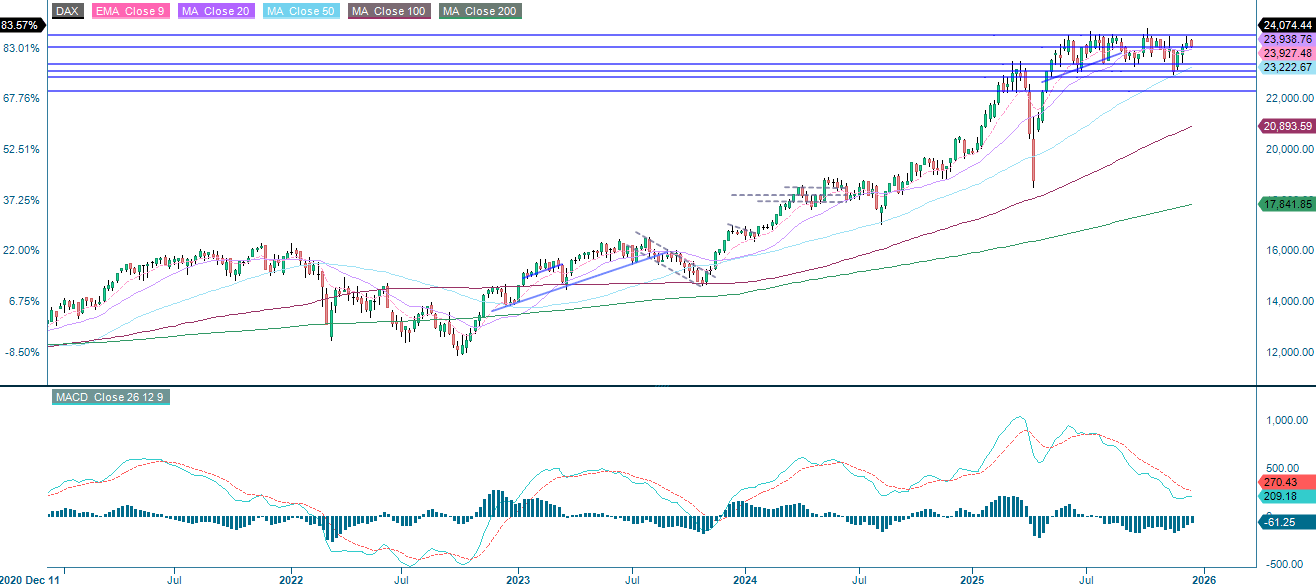
DAX (in EUR), five-year weekly chart
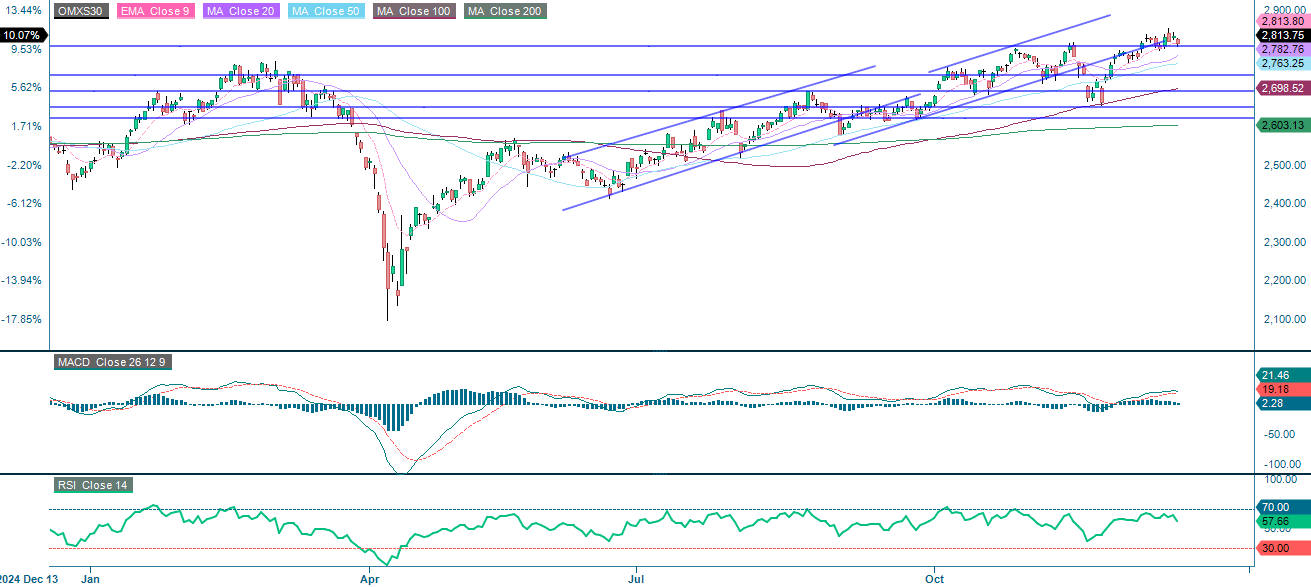
The Swedish OMXS30 index is currently trading at the 9-Day Exponential Moving Average (EMA9) level. The next step could be a break below EMA9 and 2,783.
OMX30 (in SEK), one-year daily chart
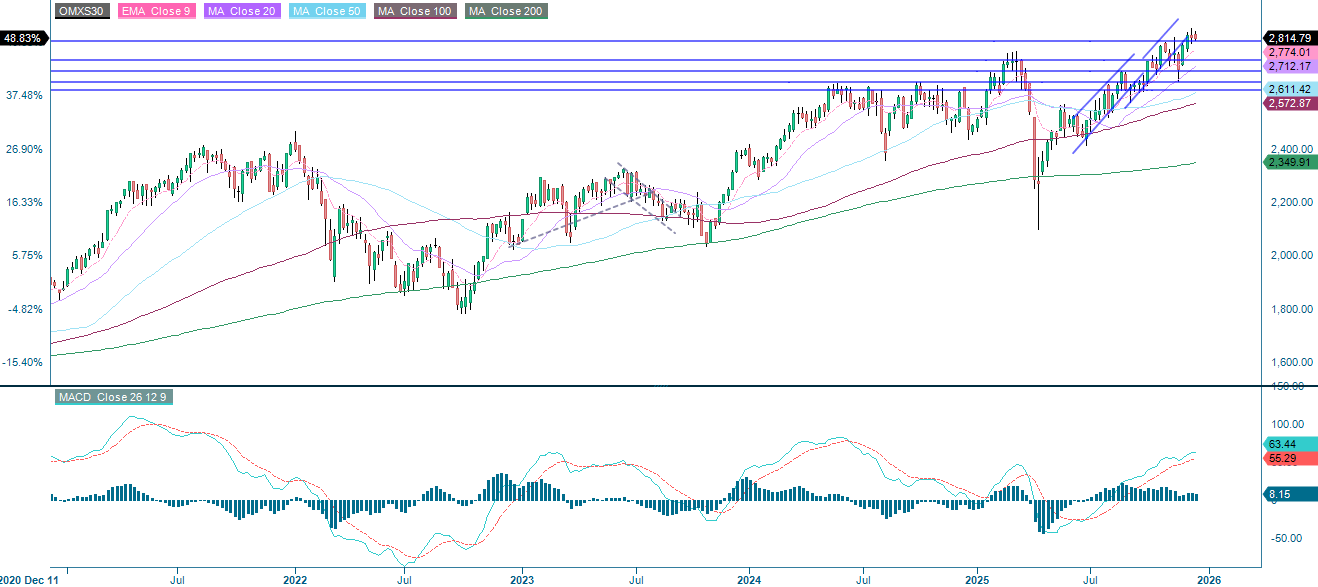
OMX30 (in SEK), five-year weekly chart
The full name for abbreviations used in the previous text
EMA 9: 9-Day Exponential Moving Average
Fibonacci: There are several Fibonacci lines used in technical analysis. Fibonacci numbers are a sequence in which each successive number is the sum of the two previous numbers.
MA20: 20-Day Moving Average
MA50: 50-Day Moving Average
MA100: 100-Day Moving Average
MA200: 200-Day Moving Average
MACD: Moving Average Convergence Divergence
Risks
Credit risk of the issuer:
Investors in the products are exposed to the risk that the Issuer or the Guarantor may not be able to meet its obligations under the products. A total loss of the invested capital is possible. The products are not subject to any deposit protection.
Currency risk:
If the product currency differs from the currency of the underlying asset, the value of a product will also depend on the exchange rate between the respective currencies. As a result, the value of a product can fluctuate significantly.
Market risk:
The value of the products can fall significantly below the purchase price due to changes in market factors, especially if the value of the underlying asset falls. The products are not capital-protected
Product costs:
Product and possible financing costs reduce the value of the products.
Risk with leverage products:
Due to the leverage effect, there is an increased risk of loss (risk of total loss) with leverage products, e.g. Bull & Bear Certificates, Warrants and Mini Futures.
External author:
This information is in the sole responsibility of the guest author and does not necessarily represent the opinion of Bank Vontobel Europe AG or any other company of the Vontobel Group. This information is sponsored by Bank Vontobel Europe AG, which may be a counterparty to transactions involving the financial instruments discussed in this information. The further development of the index or a company as well as its share price depends on a large number of company-, group- and sector-specific as well as economic factors. When forming his investment decision, each investor must take into account the risk of price losses. Please note that investing in these products will not generate ongoing income.
The products are not capital protected, in the worst case a total loss of the invested capital is possible. In the event of insolvency of the issuer and the guarantor, the investor bears the risk of a total loss of his investment. In any case, investors should note that past performance and / or analysts' opinions are no adequate indicator of future performance. The performance of the underlyings depends on a variety of economic, entrepreneurial and political factors that should be taken into account in the formation of a market expectation.
Disclaimer:
This information is neither an investment advice nor an investment or investment strategy recommendation, but advertisement. The complete information on the products (securities) mentioned herein, in particular the structure and risks associated with an investment, are described in the base prospectus, together with any supplements, as well as the final terms relating to the securities. The base prospectus and final terms constitute the solely binding sales documents for the products mentioned herein. It is recommended that potential investors read these documents before making any investment decision. The documents and the key information document are published on the website of the issuer, Vontobel Financial Products GmbH, Bockenheimer Landstrasse 24, 60323 Frankfurt am Main, Germany, on https://prospectus.vontobel.com and are available from the issuer free of charge. The approval of the prospectus should not be understood as an endorsement of the securities. The securities are products that are not simple and may be difficult to understand. This information includes or relates to figures of past performance. Past performance is not a reliable indicator of future performance. This information may only be distributed or published in countries where such distribution or publication is permitted by applicable law. As stated in the relevant base prospectus, the distribution of the securities mentioned in this information is subject to restrictions in certain jurisdictions. This advertisement may not be reproduced or redistributed without prior permission by Vontobel.
© Bank Vontobel Europe AG and / or affiliated companies. All rights reserved.