Silver - Market Surpriser in 2025

Silver has been one of the biggest market winners in 2025, garnering widespread attention from investors. The price of silver has risen to record levels, surpassing previous ATH (All Time High) levels.
New all-time highs
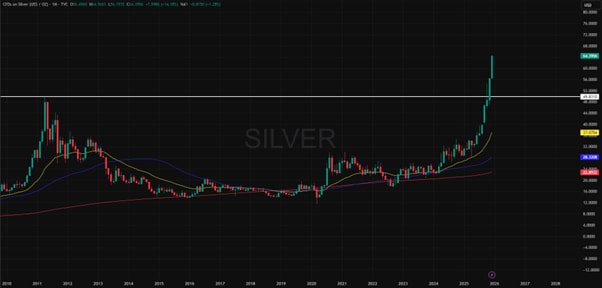
At the time of writing, the price of silver is just over 64 USD / OZ, whereas at the beginning of 2025 the price was closer to the price level of 30 USD / OZ. Therefore, the price of silver has therefore more than doubled during 2025. In percentage terms, the increase since the beginning of the year is just over 120%, taking into account the price level at the time of writing. The last time the price of silver rose so strongly was in 2020, following the Covid recession and earlier, after the 2008 financial crisis. This strong price increase in silver can therefore be considered very exceptional, because the increase has been unusual compared to recent years. The price has broken the previous ATH (All Time High) from 2011, as shown in the chart below (white horizontal line).
Silver’s price increase has also been clearly stronger than golds. Since the beginning of 2025, gold has risen by about 66%, or about half as much as silver.
SILVER (USD / OZ), since 2010
Behind market movements
A supply shortage is one key factor behind the rise in silver prices. The silver market has suffered from consecutive deficits for several years, meaning that global demand has consistently exceeded supply. The decline in physical inventories and scarcity have particularly squeezed the market tighter, often accentuating price movements as demand increases.
Industrial demand for silver also plays a significant role. Large investments by companies in data centers and technology, for example, consume large amounts of silver, due to its conductive properties. Therefore, silver plays a significant role in technological infrastructure.
Silver technical analysis
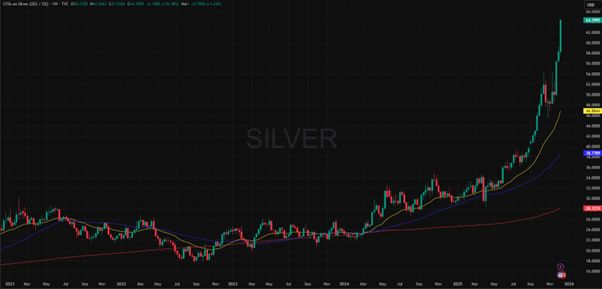
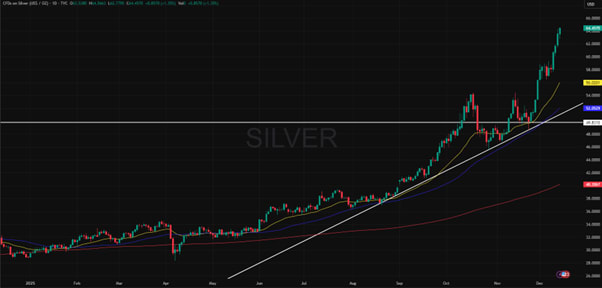
The silver price chart is in a very strong uptrend, with no end in sight to the current rise. The price has managed to break the previous ATH (All Time High) readings, which strengthens the technical outlook for silver. The price is also clearly above all the visible moving averages on the chart, both on the daily and weekly candles. The order of these is also in line with a clear uptrend. The one-year chart also shows the ATH reading from 2011 (white) and the rising trend line drawn from the lows of the previous months (white). In the event of a downward correction, these levels and the moving averages could act as possible support levels or areas. If the price falls below these levels, the technical picture would weaken, at least temporarily. However, there have been no signs of this so far.
Related Products
SILVER (USD / OZ), five-year chart
SILVER (USD / OZ), one-year chart
Summary
Silver is one of the biggest winners in 2025, and investors have paid a lot of attention to the underlying asset t over the past year. There are also clear macroeconomic factors behind the price increase that have supported the price increase. While the increase in the price of silver has been significant, it is also important to remember that possible corrections and even large intraday movements are common in the commodity market.
Indicators shown on the graphs:
● SMA200: 200 Day Moving Average, red
● SMA50: 50 Day Moving Average, blue
● EMA25: 25-Day Exponential Moving Average, yellow
Risks
Credit risk of the issuer:
Investors in the products are exposed to the risk that the Issuer or the Guarantor may not be able to meet its obligations under the products. A total loss of the invested capital is possible. The products are not subject to any deposit protection.
Currency risk:
If the product currency differs from the currency of the underlying asset, the value of a product will also depend on the exchange rate between the respective currencies. As a result, the value of a product can fluctuate significantly.
Market risk:
The value of the products can fall significantly below the purchase price due to changes in market factors, especially if the value of the underlying asset falls. The products are not capital-protected
Product costs:
Product and possible financing costs reduce the value of the products.
Risk with leverage products:
Due to the leverage effect, there is an increased risk of loss (risk of total loss) with leverage products, e.g. Bull & Bear Certificates, Warrants and Mini Futures.
External author:
This information is in the sole responsibility of the guest author and does not necessarily represent the opinion of Bank Vontobel Europe AG or any other company of the Vontobel Group. This information is sponsored by Bank Vontobel Europe AG, which may be a counterparty to transactions involving the financial instruments discussed in this information. The further development of the index or a company as well as its share price depends on a large number of company-, group- and sector-specific as well as economic factors. When forming his investment decision, each investor must take into account the risk of price losses. Please note that investing in these products will not generate ongoing income.
The products are not capital protected, in the worst case a total loss of the invested capital is possible. In the event of insolvency of the issuer and the guarantor, the investor bears the risk of a total loss of his investment. In any case, investors should note that past performance and / or analysts' opinions are no adequate indicator of future performance. The performance of the underlyings depends on a variety of economic, entrepreneurial and political factors that should be taken into account in the formation of a market expectation.
Disclaimer:
This information is neither an investment advice nor an investment or investment strategy recommendation, but advertisement. The complete information on the products (securities) mentioned herein, in particular the structure and risks associated with an investment, are described in the base prospectus, together with any supplements, as well as the final terms relating to the securities. The base prospectus and final terms constitute the solely binding sales documents for the products mentioned herein. It is recommended that potential investors read these documents before making any investment decision. The documents and the key information document are published on the website of the issuer, Vontobel Financial Products GmbH, Bockenheimer Landstrasse 24, 60323 Frankfurt am Main, Germany, on https://prospectus.vontobel.com and are available from the issuer free of charge. The approval of the prospectus should not be understood as an endorsement of the securities. The securities are products that are not simple and may be difficult to understand. This information includes or relates to figures of past performance. Past performance is not a reliable indicator of future performance. This information may only be distributed or published in countries where such distribution or publication is permitted by applicable law. As stated in the relevant base prospectus, the distribution of the securities mentioned in this information is subject to restrictions in certain jurisdictions. This advertisement may not be reproduced or redistributed without prior permission by Vontobel.
© Bank Vontobel Europe AG and / or affiliated companies. All rights reserved.