The focus is on Nvidia this week


This week, we are focusing on the USD/JPY currency pair. Given that the prospect of a US interest rate cut has diminished, we believe that the USD could strengthen. Meanwhile, weaknesses in the Japanese economy are unlikely to increase the value of the yen. Separately, concerns over whether the Fed will cut interest rates in December have led to a decline in global stock markets. Investors are also awaiting Nvidia's quarterly report on Wednesday.
Case of the week: The yen might slide further against the US dollar
The longest shutdown of the US government has come to an end. This could help to normalise the US economy. At the same time, the probability of a rate cut from the Federal Reserve in December has decreased to around 40 per cent. Together, these factors should bolster the US dollar, while the Japanese yen remains vulnerable.
The Japanese tilt toward looser policies
The Japanese yen remains under sustained downward pressure due to a combination of policy decisions and economic factors. Firstly, the public support of Prime Minister Sanae Takaichi for prolonged loose fiscal and monetary policies signals that Japan will maintain accommodative conditions, thereby reinforcing the appeal of yen-funded carry trades. Secondly, the resolution of the US government shutdown could increase global appetite for risk, despite ongoing concerns about its potential impact on US growth.
The interest rate differential and structural factors are the long-term drivers behind yen weakness
The significant interest rate difference between Japan and the US has resulted in sustained yen weakness. If the yen falls sharply, the Bank of Japan (BOJ) may intervene to support it. However, the Bank of Japan’s loose monetary policy, combined with high interest rates in the US, ensures that capital moves towards the dollar. This makes the yen the world’s preferred funding currency, thereby sustaining its decline. Structural factors reinforce this trend: Japan’s anaemic growth, low wages and substantial government debt prevent significant tightening of monetary policy, while yen weakness benefits exporters and corporate profits, reducing the pressure for appreciation.
The latest data confirm these structural headwinds. Japan’s Q3 2025 GDP fell by 1.8% on an annualised basis, due to slowing consumer spending and weak exports. This leaves the BOJ with little reason to tighten. Overall, yen weakness in the short and long term appears likely, reflecting broader policy and market fundamentals.
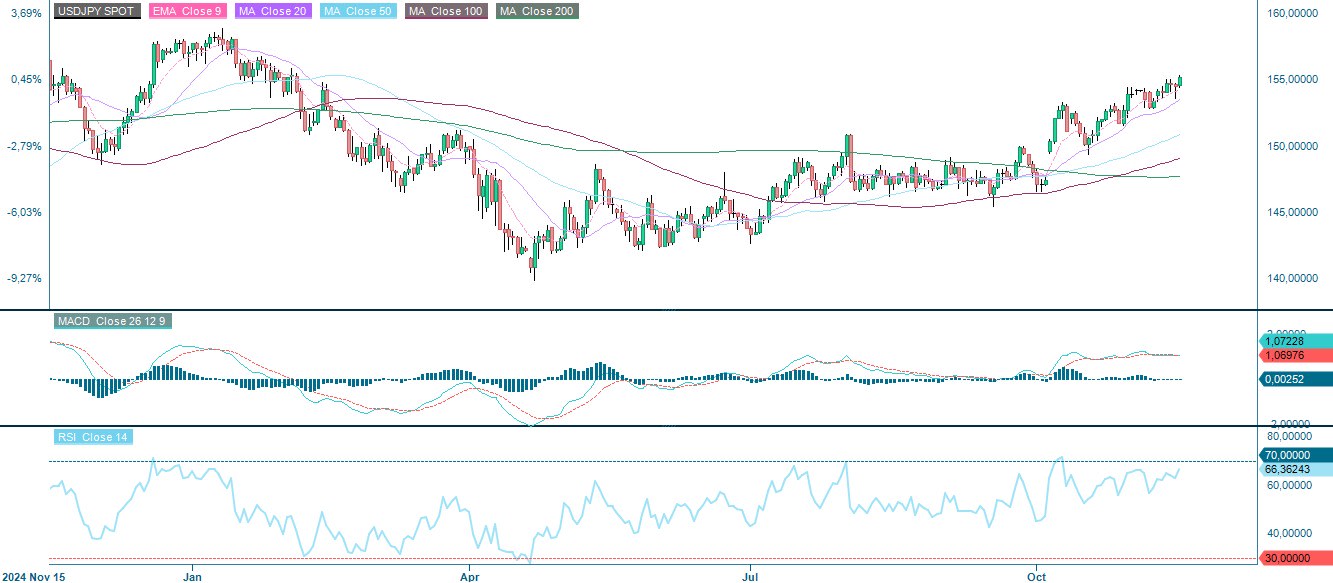
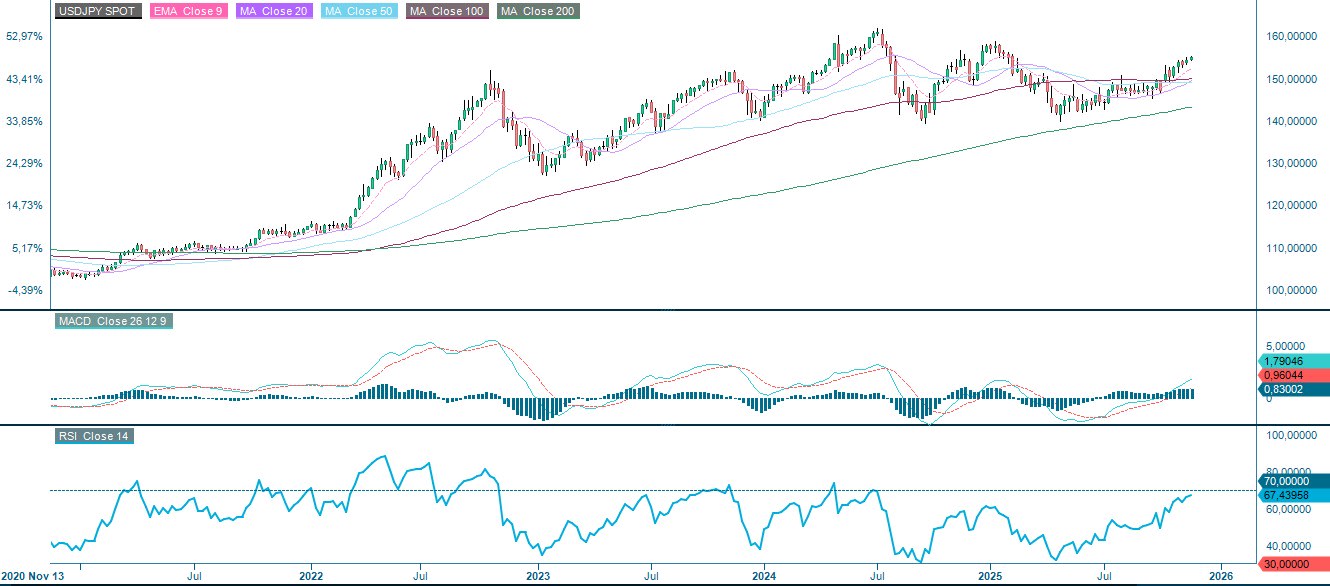
The uptrend in USD/JPY remains clear on both the daily and weekly charts. The publication of the Fed's October meeting minutes on Wednesday and Japanese inflation figures for October on Thursday this week may influence expectations for monetary policy and therefore the currency pair.
USDJPY (US dollar/Japanese Yen), one-year daily chart
USDJPY (US dollar/Japanese Yen), five-year weekly chart
Macro comments
European and US stock markets ended last week on a weak note, with most of the leading indices in
the red on Friday November 14. Investors are becoming increasingly unconvinced that the Federal Reserve will further cut interest rates at its December meeting. Currently, the market is pricing in a probability of just over 42% for a 25-basis point cut, compared to 70% a week ago. Additionally, attention is turning to the high valuation of the AI-related stock sector in the US, which is having a significant impact on developments in stock markets around the world.
Nvidia, the most important company in the tech and AI sector, will be under scrutiny when it reports its quarterly results on Wednesday, November 19. Also reporting their quarterly results on Wednesday are the US companies Lowe’s Companies, Palo Alto Networks, and the TJX Companies, as well as the Chinese company Nio Inc. Meanwhile, Assa Abloy and Nokia will each host a capital markets day. The day's macroeconomic news will begin with the release of Japan's October trade balance and September machinery orders. A few hours later, the UK's Consumer Price Index (CPI) and Producer Price Index (PPI) figures for October will be released. From the Eurozone, the September trade balance, October CPI and Q3 labour costs will be presented. The US will contribute October's housing construction data, the Department of Energy's weekly oil inventory statistics, and the minutes from the Fed's policy meeting on October 29.
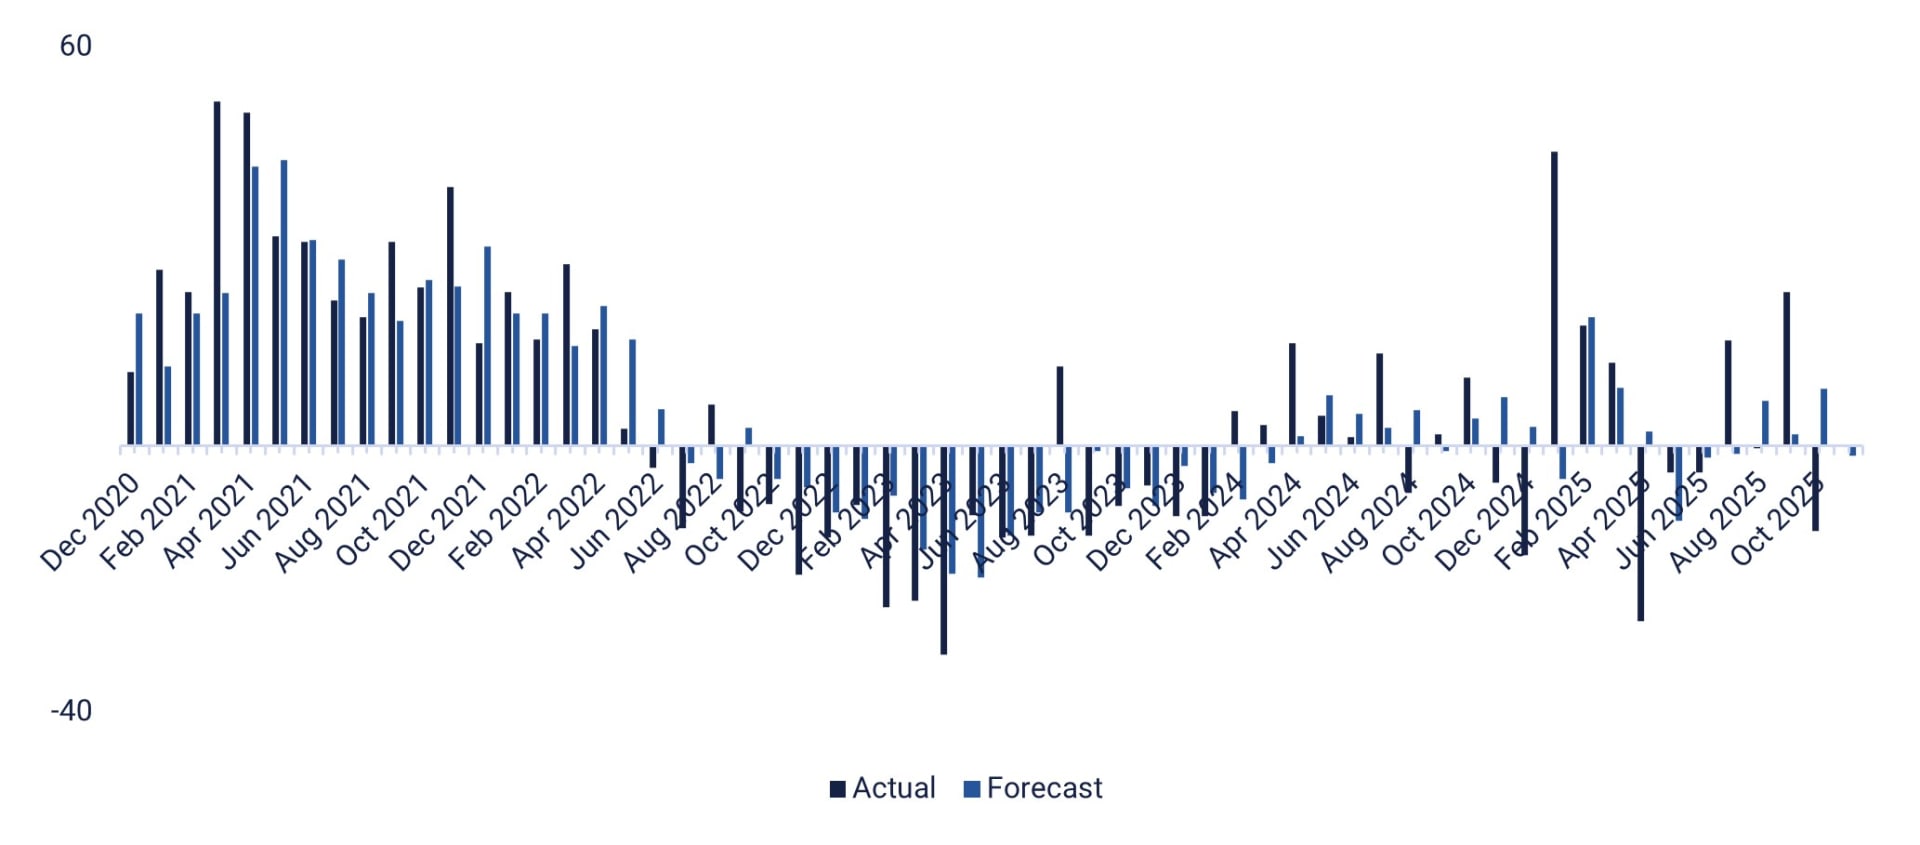
On Thursday, November 20, Gap, Intuit and Walmart will announce their quarterly results in the US. Also on that day, the Swedish company Thule is holding a capital markets day. Thursday's macroeconomic news from continental Europe will consist of Germany's Producer Price Index for October and Eurozone construction production figures for September. The UK will release CBI industrial trends for November, and a Eurozone household confidence indicator for October is also expected. A series of macroeconomic statistics are also scheduled for release in the US, including the Philadelphia Fed Index for November (see graph below), initial weekly jobless claims, existing home sales for October and the Kansas City Fed Index for November, as well as the US nonfarm payrolls for September.
On Friday 21 November, the macro news focus will be on the purchasing managers' indices for November from Japan, India, France, Germany, the eurozone, the UK and the US. Other releases include Japan's CPI and UK retail sales for October, a confidence indicator from the French industry for November, and the US Michigan index for November.
US Philadelphia Manufacturing Index, actual and forecast from December 2020 to November 2025
The risk has shifted to the downside. Is this an opportunity to buy?
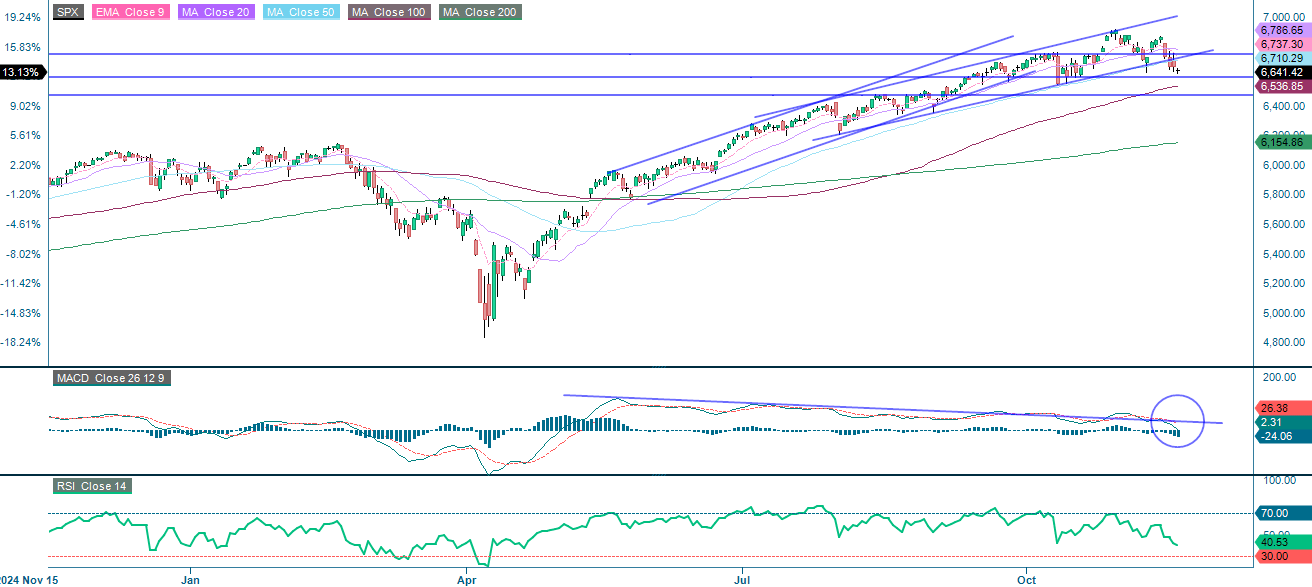
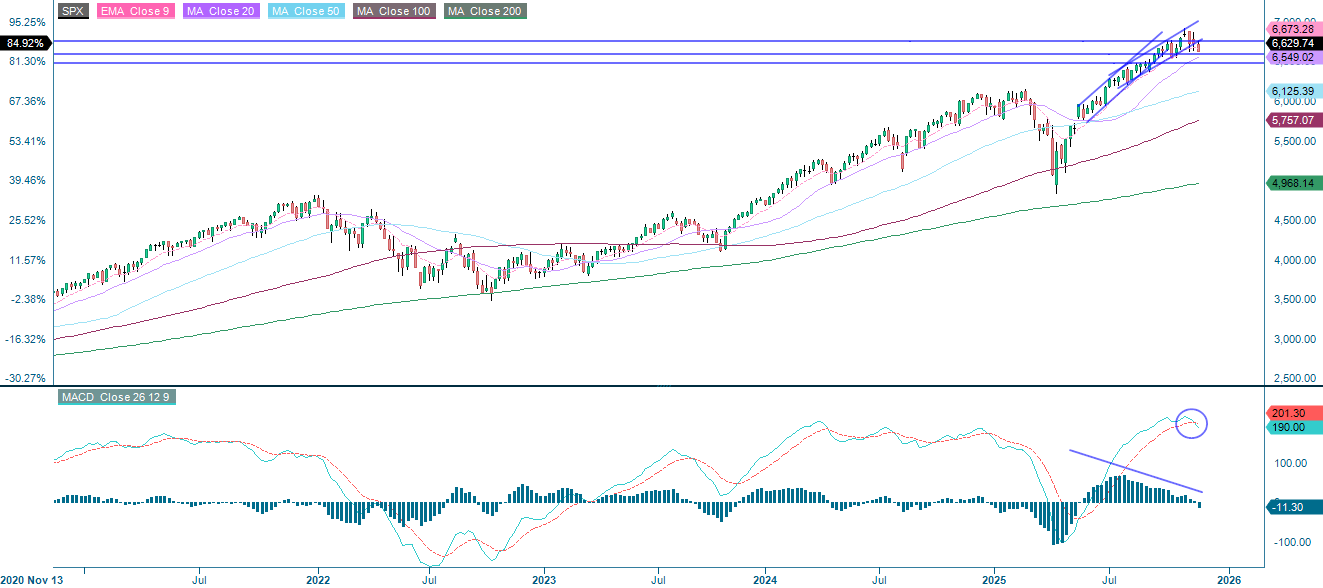
The S&P 500 is currently under pressure, with the Moving Average Convergence Divergence (MACD) having generated a sell signal. The main factors behind this negative momentum are concerns about valuations in the technology sector and apprehension about economic data and rising interest rates. Support levels can be found at around 6,600 and at the 100-Day Moving Average (MA100), as well as near 6,500. However, interest rates are beginning to ease and most MAG7 stocks are at or approaching key support levels. Consequently, this may present an opportunity for the brave to consider buying.
S&P 500 (in USD), one-year daily chart
S&P 500 (in USD), weekly five-year chart
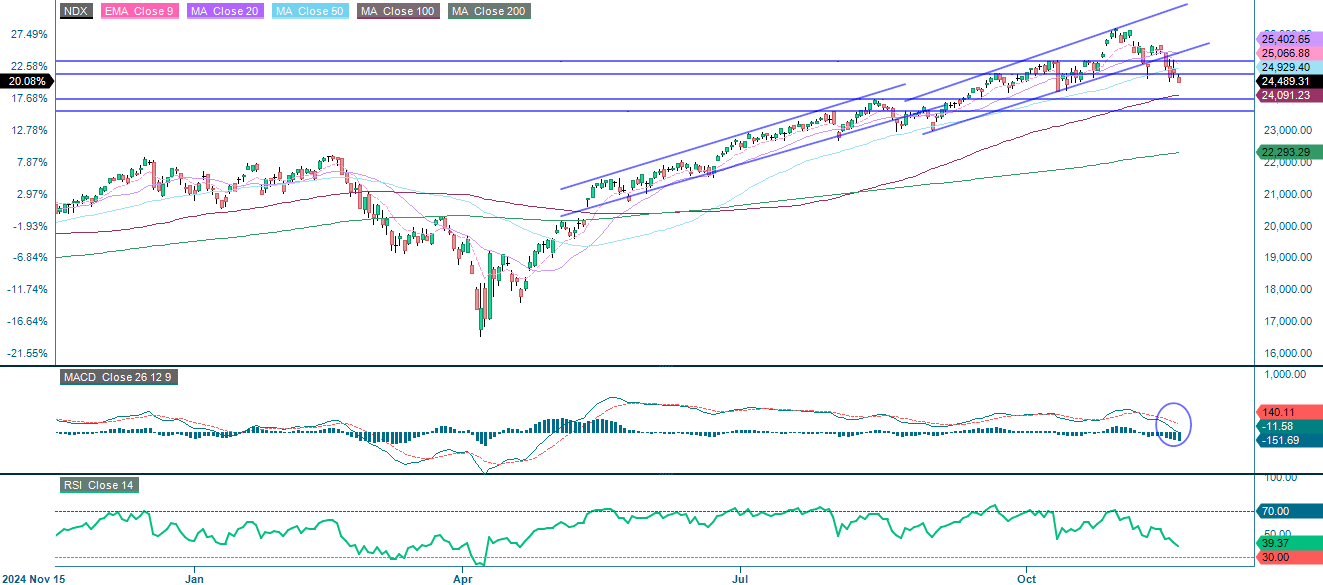
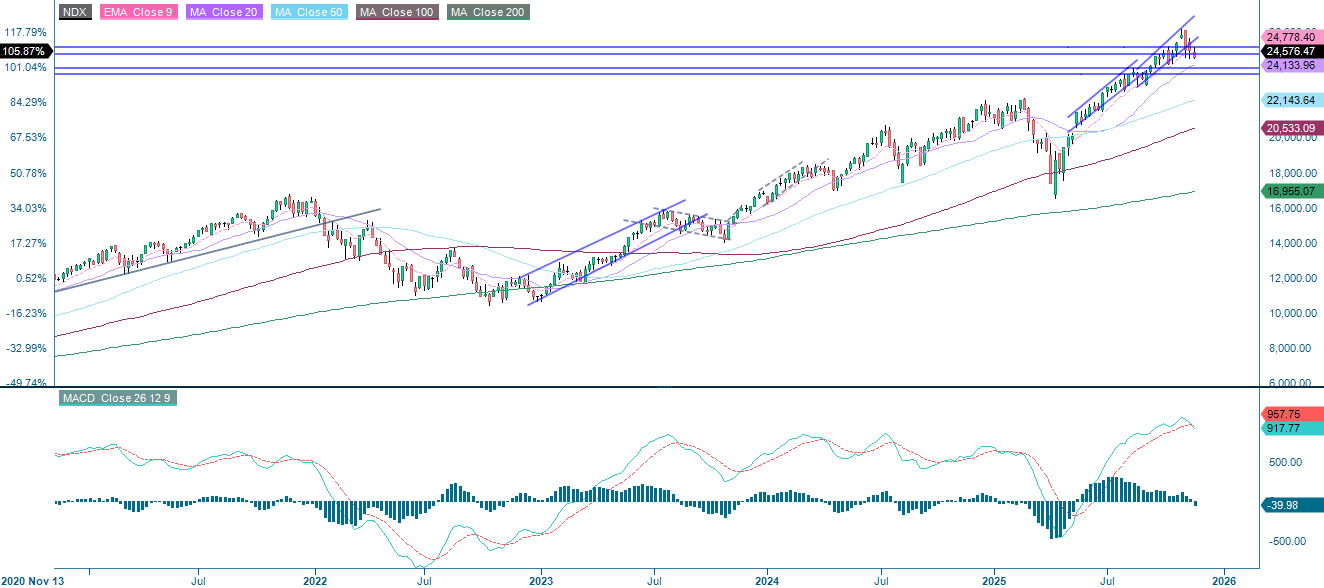
Conversely, the NASDAQ-100 is currently trading below the support level of 24,740. Having generated a sell signal, the MACD indicates a clear risk of further decline towards levels between 24,000 and 24,220. Continued weakness in the tech sector would also put pressure on the S&P 500. However, keep an eye on MAG7 for a potential rebound.
Related Products
NASDAQ-100 (in USD), one-year daily chart
NASDAQ-100 (in USD), weekly five-year chart
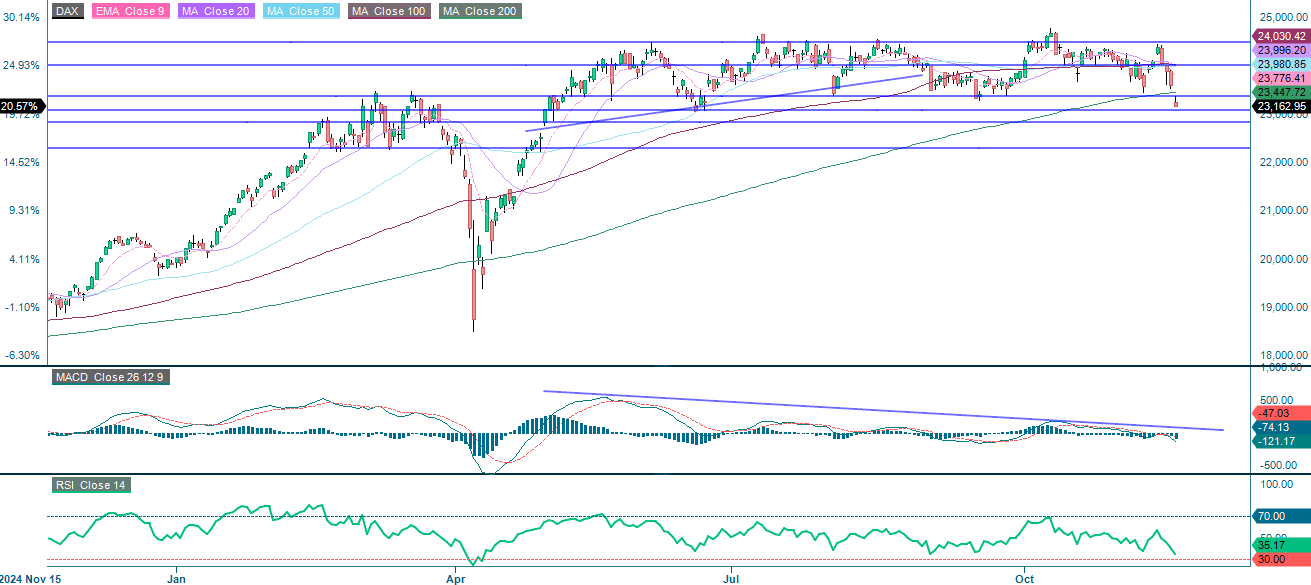
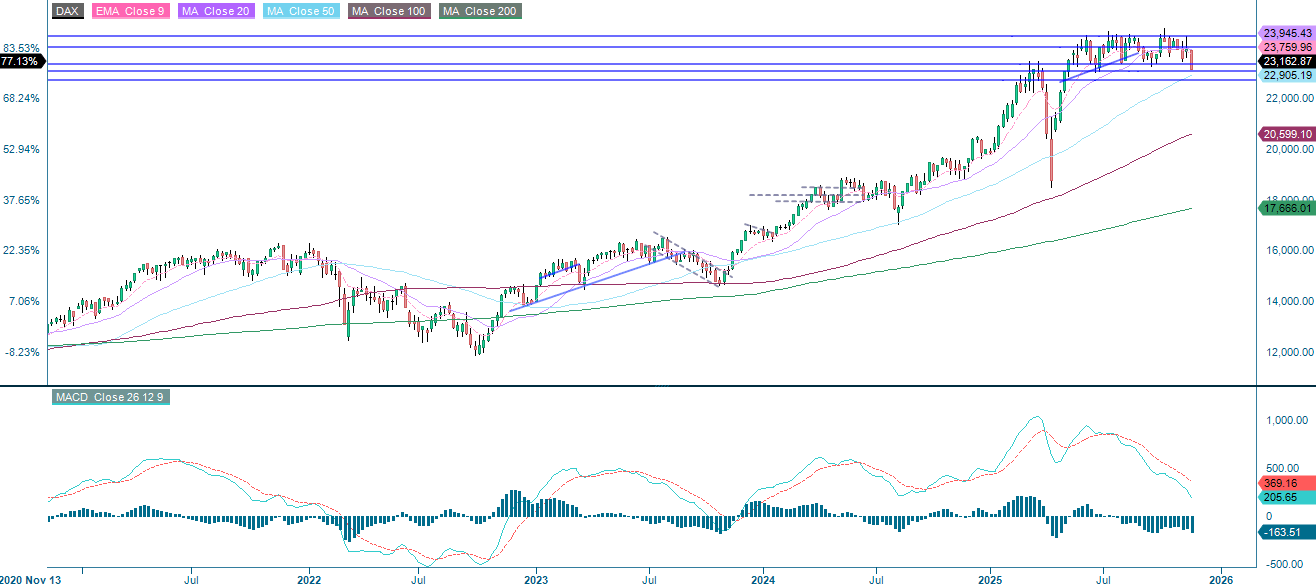
The German DAX is currently trading below its 200-Day Moving Average, approaching a support level just above 23,000. The MACD indicates negative momentum, while the Relative Strength Index (RSI) is approaching oversold territory, albeit with some remaining room. If the index falls below 23,000, the next support levels are 22,825 and 22,300.
Related Products
DAX (in EUR), one-year daily chart
DAX (in EUR), weekly five-year chart
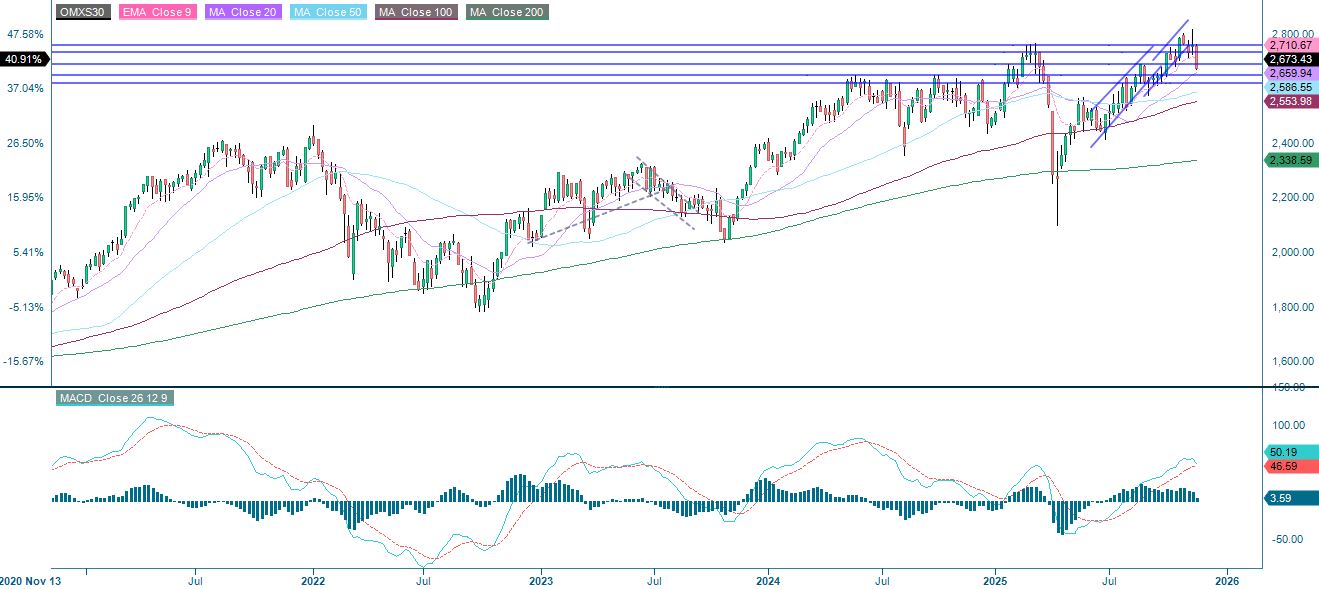
Meanwhile, the OMXS30 in Sweden is currently trading below both its 50-day moving average and the 2,700 level. The next support levels are 2,650 and 2,620, followed by the 200-Day Moving Average, which is currently at 2,595.
OMX30 (in SEK), one-year daily chart
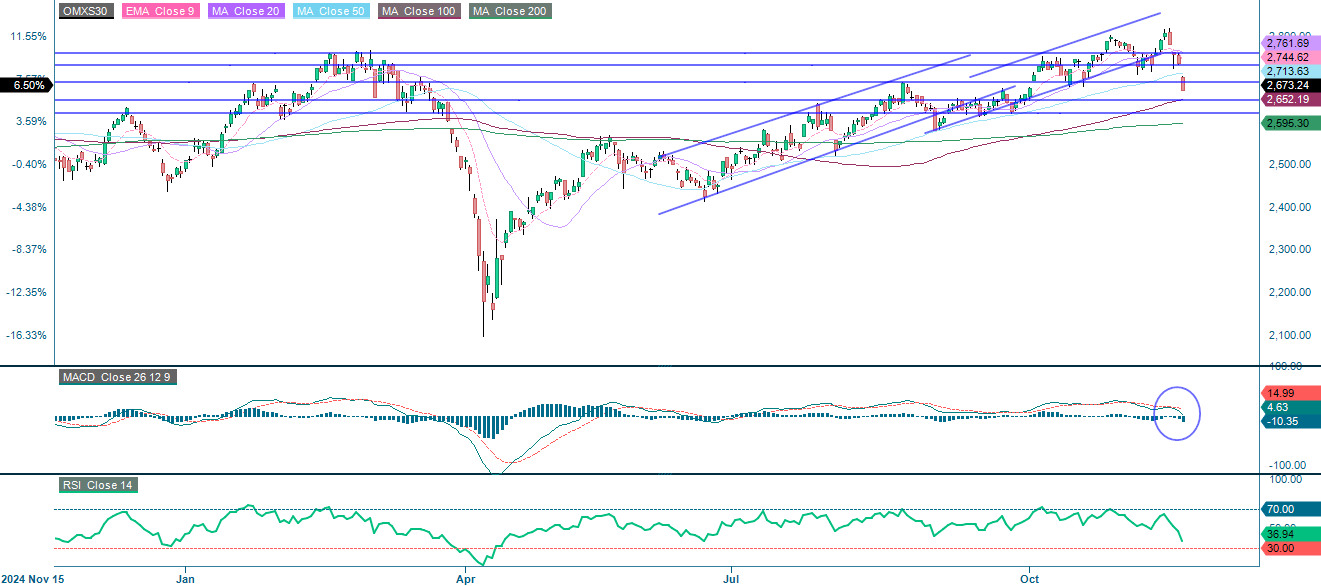
OMX30 (in SEK), weekly five-year chart
The full name for abbreviations used in the previous text:
EMA 9: 9-day Exponential Moving Average
Fibonacci: There are several Fibonacci lines used in technical analysis. Fibonacci numbers are a sequence in which each successive number is the sum of the two previous numbers.
MA20: 20-day Moving Average
MA50: 50-day Moving Average
MA100: 100-day Moving Average
MA200: 200-day Moving Average
MACD: Moving Average Convergence Divergence
Risks
Credit risk of the issuer:
Investors in the products are exposed to the risk that the Issuer or the Guarantor may not be able to meet its obligations under the products. A total loss of the invested capital is possible. The products are not subject to any deposit protection.
Currency risk:
If the product currency differs from the currency of the underlying asset, the value of a product will also depend on the exchange rate between the respective currencies. As a result, the value of a product can fluctuate significantly.
Market risk:
The value of the products can fall significantly below the purchase price due to changes in market factors, especially if the value of the underlying asset falls. The products are not capital-protected
Product costs:
Product and possible financing costs reduce the value of the products.
Risk with leverage products:
Due to the leverage effect, there is an increased risk of loss (risk of total loss) with leverage products, e.g. Bull & Bear Certificates, Warrants and Mini Futures.
External author:
This information is in the sole responsibility of the guest author and does not necessarily represent the opinion of Bank Vontobel Europe AG or any other company of the Vontobel Group. This information is sponsored by Bank Vontobel Europe AG, which may be a counterparty to transactions involving the financial instruments discussed in this information. The further development of the index or a company as well as its share price depends on a large number of company-, group- and sector-specific as well as economic factors. When forming his investment decision, each investor must take into account the risk of price losses. Please note that investing in these products will not generate ongoing income.
The products are not capital protected, in the worst case a total loss of the invested capital is possible. In the event of insolvency of the issuer and the guarantor, the investor bears the risk of a total loss of his investment. In any case, investors should note that past performance and / or analysts' opinions are no adequate indicator of future performance. The performance of the underlyings depends on a variety of economic, entrepreneurial and political factors that should be taken into account in the formation of a market expectation.
Disclaimer:
This information is neither an investment advice nor an investment or investment strategy recommendation, but advertisement. The complete information on the products (securities) mentioned herein, in particular the structure and risks associated with an investment, are described in the base prospectus, together with any supplements, as well as the final terms relating to the securities. The base prospectus and final terms constitute the solely binding sales documents for the products mentioned herein. It is recommended that potential investors read these documents before making any investment decision. The documents and the key information document are published on the website of the issuer, Vontobel Financial Products GmbH, Bockenheimer Landstrasse 24, 60323 Frankfurt am Main, Germany, on https://prospectus.vontobel.com and are available from the issuer free of charge. The approval of the prospectus should not be understood as an endorsement of the securities. The securities are products that are not simple and may be difficult to understand. This information includes or relates to figures of past performance. Past performance is not a reliable indicator of future performance. This information may only be distributed or published in countries where such distribution or publication is permitted by applicable law. As stated in the relevant base prospectus, the distribution of the securities mentioned in this information is subject to restrictions in certain jurisdictions. This advertisement may not be reproduced or redistributed without prior permission by Vontobel.
© Bank Vontobel Europe AG and / or affiliated companies. All rights reserved.