Uncertainty lurks beneath the surface


This week, we argue that November could be an opportune time to take a long volatility position via the VIX. From an investor's perspective, one of the most imminent risks is the debate surrounding a potential bubble in AI-related sectors, given that these sectors are expected to drive further gains in US stock indices. Furthermore, political risk remains due to the growing US federal deficit.
Case of the week: A VIX jump scare for Halloween, but more could come
As autumn turns to winter and 2026 approaches, we recognise an asymmetric opportunity to add long-volatility exposure, driven by several factors. The ongoing US federal government shutdown, which began on 1 October 2025, has had an impact on volatility so far, with news surrounding tariffs causing the VIX to soar several times in October. Furthermore, bearish sentiment has become more prevalent recently, due to concerns over bubble-like conditions in the AI and AI-related technology sectors. Spikes in the VIX reaching above 20 were also observed in November. Third, while November tends to be a down month for the VIX, seasonal patterns indicate that December and January tend to see higher uncertainty. Overall, November may be a good month to take a long volatility position.
Thr failure by the US Congress to pass either full-year appropriations or a continuing resolution by October 1, triggered a partial federal government shutdown involving mass furloughs. Between October 1 to October 10, fourteen Senate cloture votes failed to advance a funding bill, prolonging the impasse. In an unprecedented escalation, the White House ordered agencies to prepare for permanent staffing cuts as a negotiating tactic. More recently, efforts have been made to end the shutdown. The Senate passed a resolution to end the record-long shutdown by a majority vote of 60–40. However the House of Representatives still needs to approve it, and then the president must sign it into law before the shutdown can finally end. This deal coincides with overall turbulence in the markets.
Last week, the technology sector — particularly US AI and AI-related stocks — experienced a sell-off due to widespread concerns about inflated valuations. This market turbulence coincided with warnings from prominent figures in the financial sector. For example, Goldman Sachs CEO David Solomon predicted a 'likely' 10–20% correction in the equity market within the next two years. Similarly, both the International Monetary Fund and the Bank of England have issued warnings. Bank of England Governor Andrew Bailey specifically highlighted the risk of an AI bubble. In a CNBC interview, Bailey stated that, although AI offers "very positive productivity", this could be offset by uncertainty surrounding the future earnings of tech companies. 'We have to be very alert to these risks,' he stated. Despite these concerns, some European companies are capitalising on the AI boom. Legrand, a French firm that supplies cooling systems for servers to companies such as Alphabet and Amazon, has seen its stock price surge by 37% this year — a rise comparable to that of Nvidia. The uncertainty surrounding the sector may continue to exert upward pressure on the VIX.
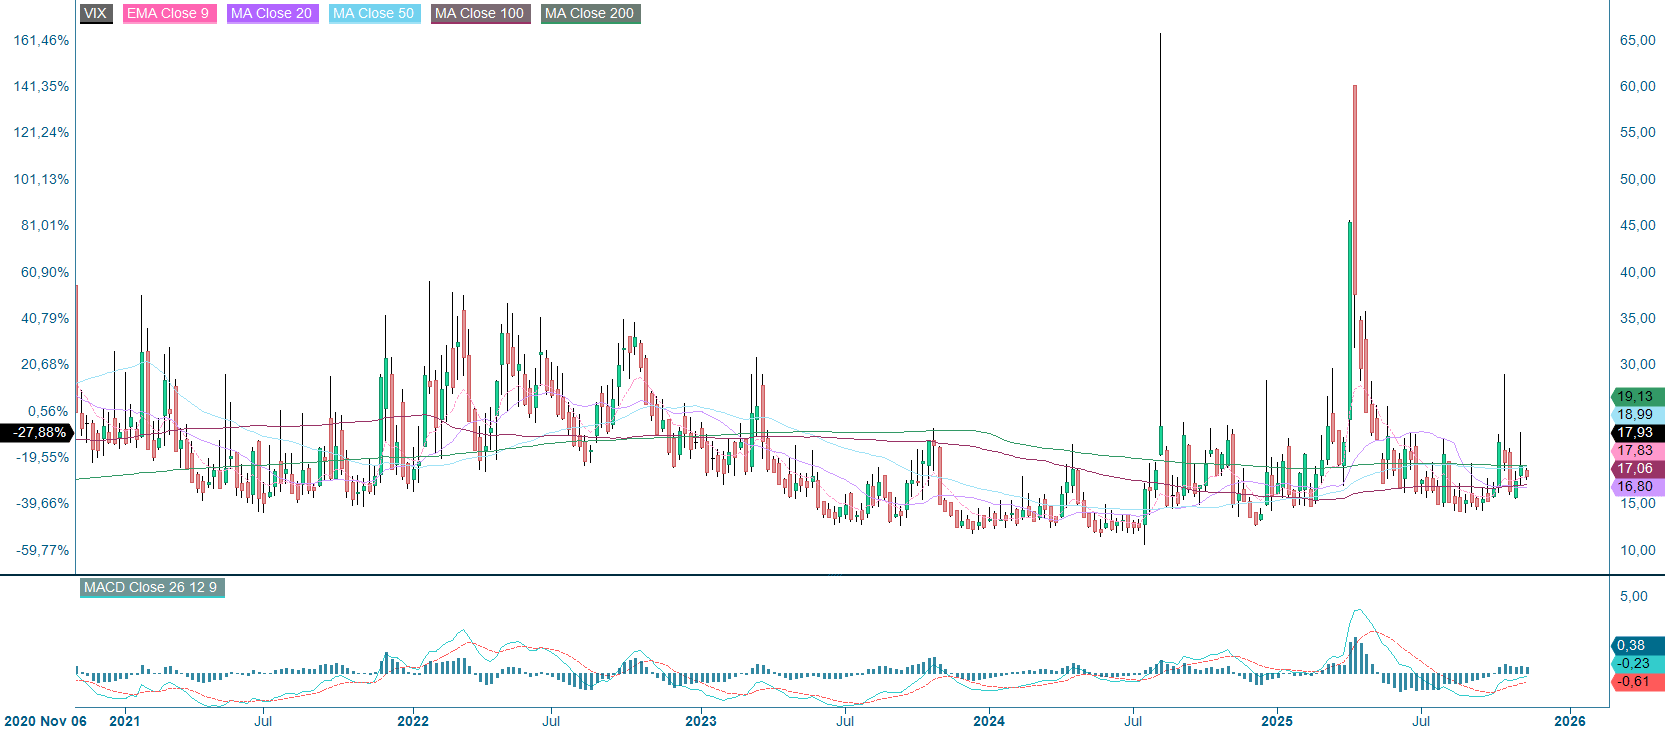
Over the last 15 years, the VIX has shown signs of seasonality. During this period, its value has decreased in 11 out of 15 years. On average, the VIX has fallen by 6.77% in November. Excluding the four positive years, the average decrease observed in negative Novembers was around 18.7%. Conversely, December and January have tended to be good months for the VIX, with average gains of 5.82% and 8.71% respectively over the last 15 years.
Bearing the above in mind, we expect the VIX to drift from the mid-teens to the low 20s as political risk persists, turbulence continues in one of the hottest tech sectors, and seasonal trends take effect.
Related Products
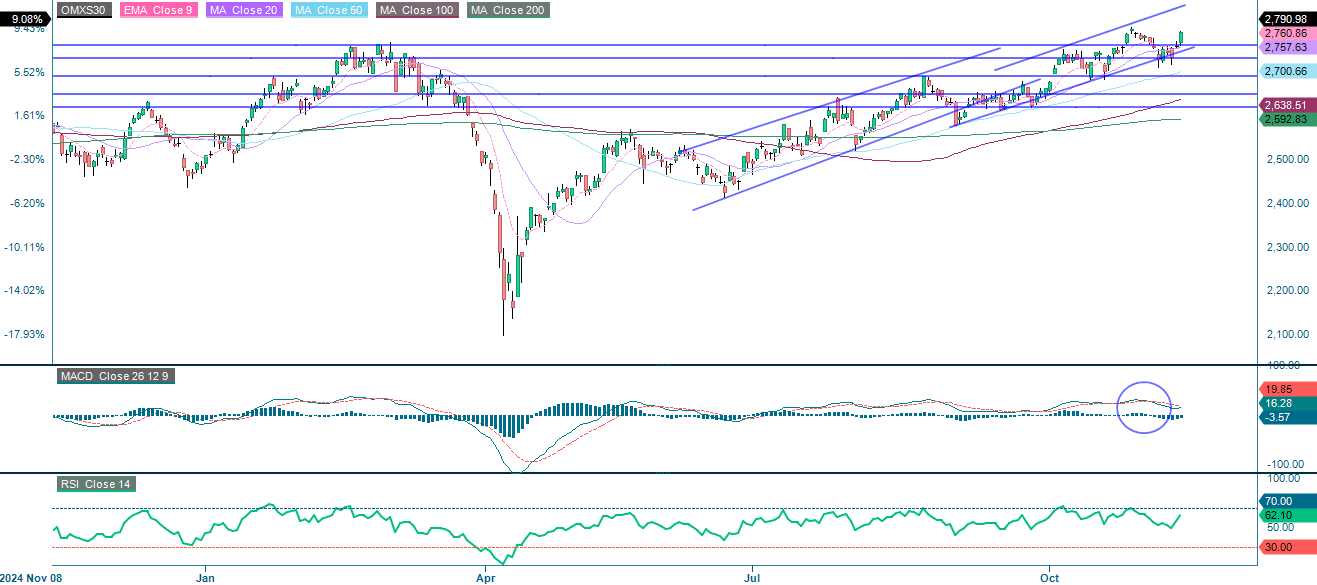
CBOE VIX, one-year daily chart

CBOE VIX, five-year weekly chart
Macro comments
Hopefully, the longest ever shutdown of the US government, which has lasted some 40 days, is now coming to an end. This follows enough Democrats voting alongside Republicans in the Senate to secure the required 60% majority needed to approve a new government budget. On Monday November 10, the S&P 500 and NASDAQ increased by 1.5% and 2.2%, respectively.
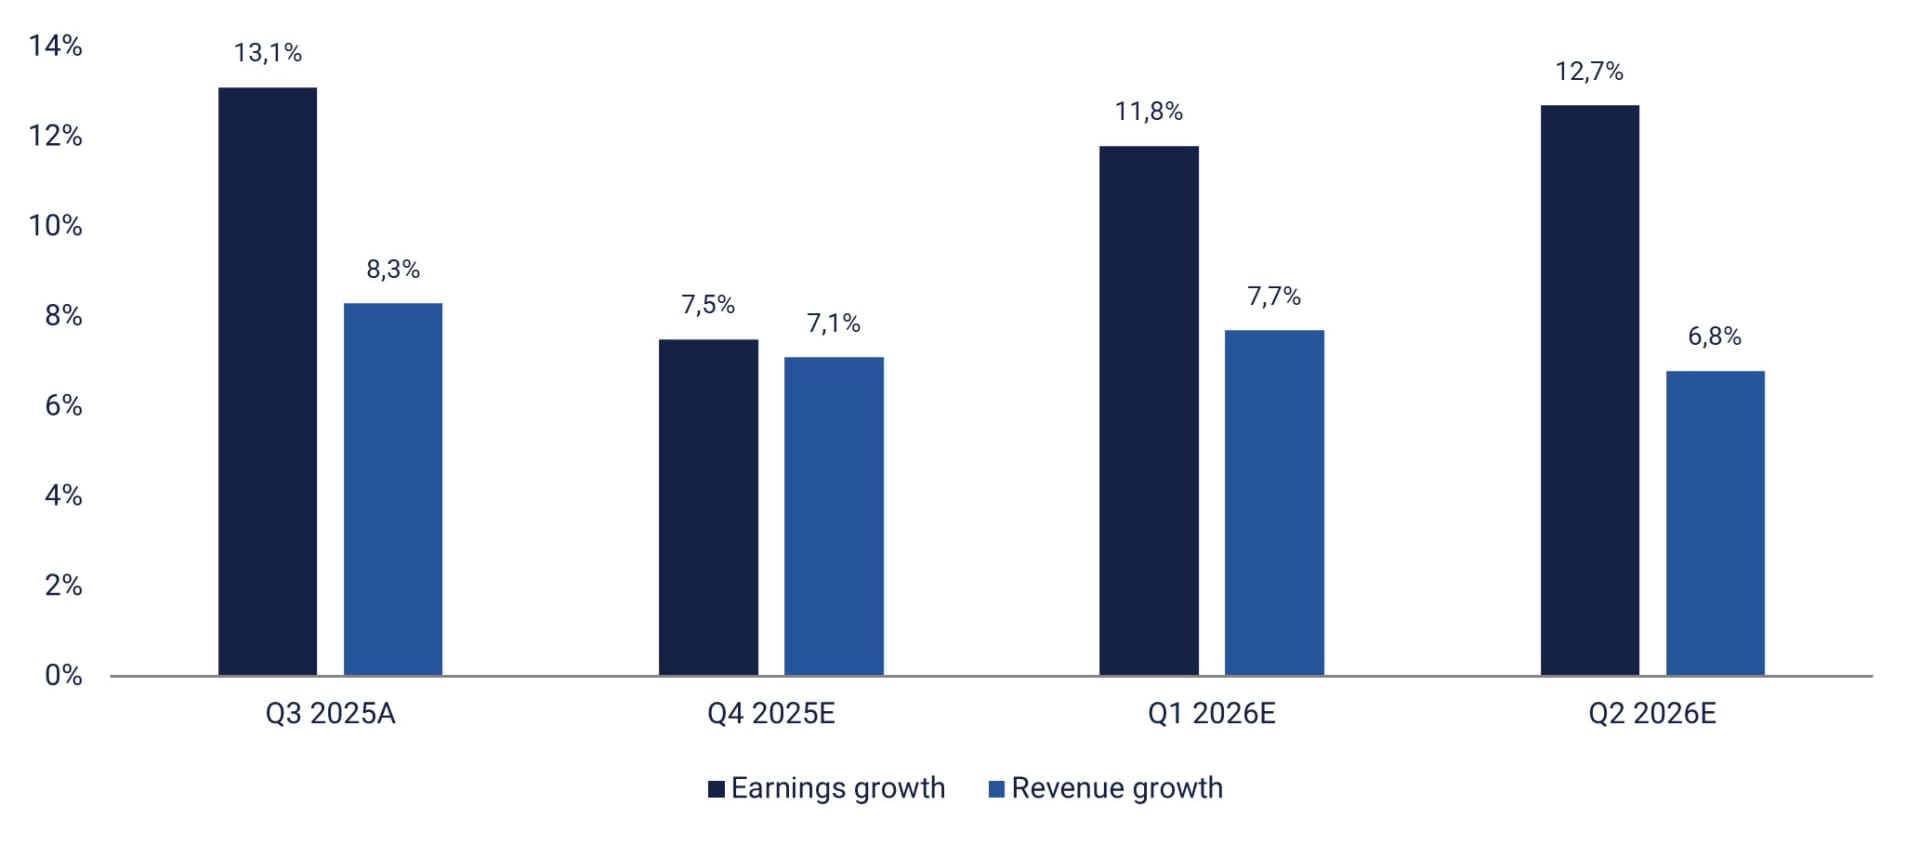
By Friday, November 7, around 455 companies in the S&P 500 had announced their third-quarter 2025 results. According to Earnings Insight, 82% of these companies reported positive earnings surprises and 77% reported positive revenue surprises. The three S&P sectors with the best performance in terms of positive earnings surprises in Q3 2025 were Health Care, Consumer Staples and Information Technology, with respective percentages exceeding analysts’ estimates: of 93%, 93% and 92%.
Quarterly earnings and revenue growth for S&P500 companies (actual figures and estimates)
By Friday November 7, 87 Swedish OMX companies had announced their Q3 results. Of those, 64% exceeded the market's consensus expectations, and 53% surpassed revenue forecasts.
On Wednesday, November 12, the Danish company Lundbeck and the American company Cisco will announce their quarterly results. Also on Wednesday, Germany's October Consumer Price Index (CPI), Redbook's weekly retail sales data for the US, and the US Department of Energy's weekly oil inventories will be released. OPEC will also publish its monthly oil report.
On Thursday November 13, Alibaba and Tencent in China, Siemens and Deutsche Telekom in Germany, and Walt Disney in the US will report their quarterly results. The week's macroeconomic news will begin with the UK's Q3 GDP figures and September's industrial production data. This will be followed by Eurozone industrial production figures for September and the IEA's monthly oil report. The US will also contribute to the day's news with October's Consumer Price Index (CPI) and initial jobless claims data.
On Friday November 14, Sweden's Nibe, Norway's Orkla and Denmark's Bavarian Nordic will report their interim results, as will Germany's Allianz. The week's macroeconomic news will begin with a series of releases from China, including housing prices, industrial production and retail trade figures, as well as investment figures, all for October. From continental Europe, we will receive German wholesale price data for October, as well as French and Spanish CPI data for the same month. Furthermore, the eurozone will release its trade balance for September, as well as its employment and Gross Domestic Product (GDP) figures for Q3. From the US, we will receive producer price index figures, retail sales figures for October, and figures for unsold goods inventory for September.
The OMXS30 looks better than most
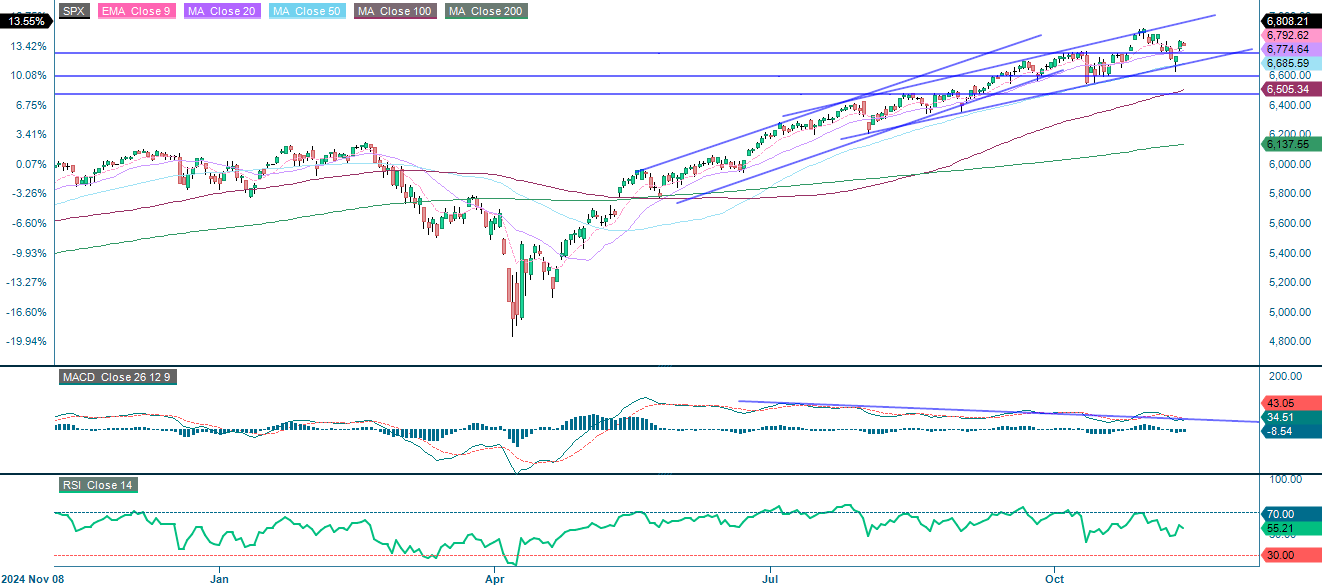
The S&P 500 remains in a strong bullish trend. However, momentum is fading, with the index trading just above the 20 Day Moving Average (MA20). If it breaks below this level, 6,600 may be next. In the event of improved momentum, however, the index would need to break above 6,900 to reach new highs. Keep an eye on 6,600 but stay calm.
Related Products
S&P 500 (in USD), one-year daily chart
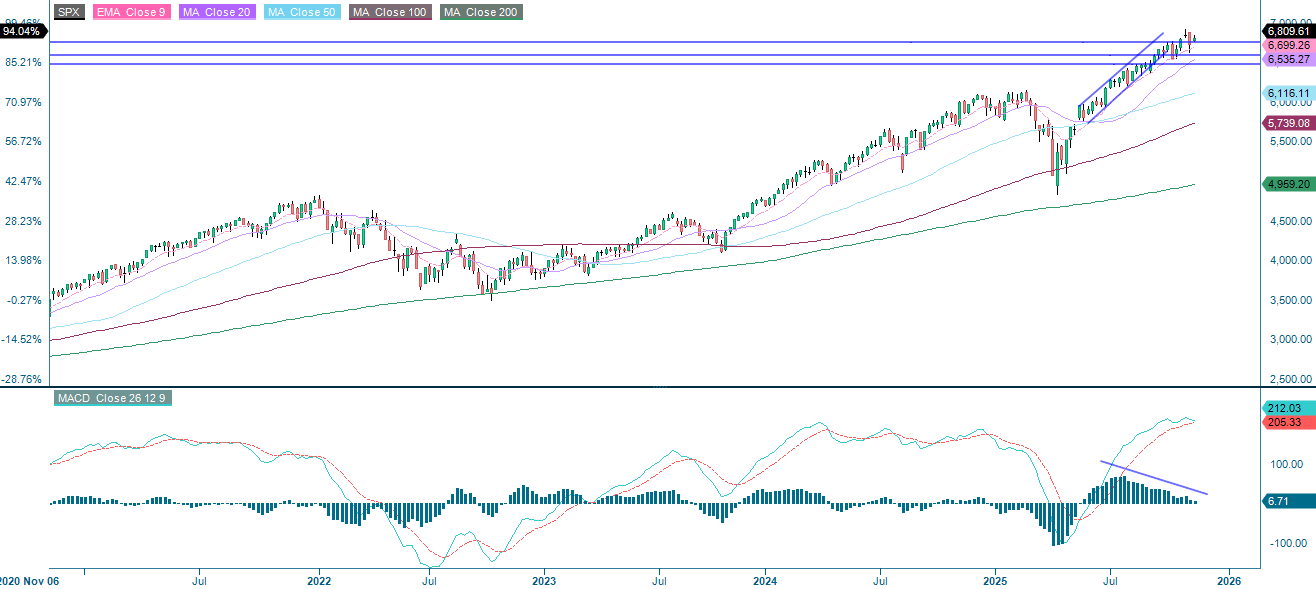
S&P 500 (in USD), weekly five-year chart
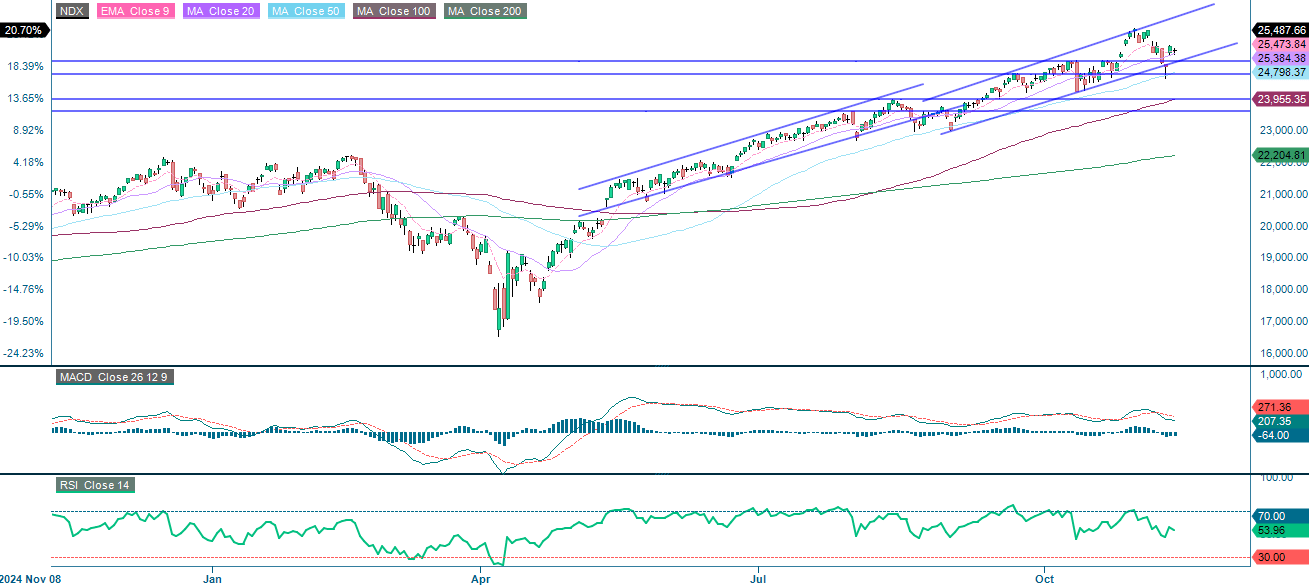
Following a pullback, the NASDAQ-100 is holding at the 25,150-support level, although momentum is fading. The next level to watch is 24,750 followed by the 100 Day Moving Average (MA100), which is currently at 23,916. Conversely, short-term upside potential is found at the previous high of around 26,000.
Related Products
NASDAQ-100 (in USD), one-year daily chart
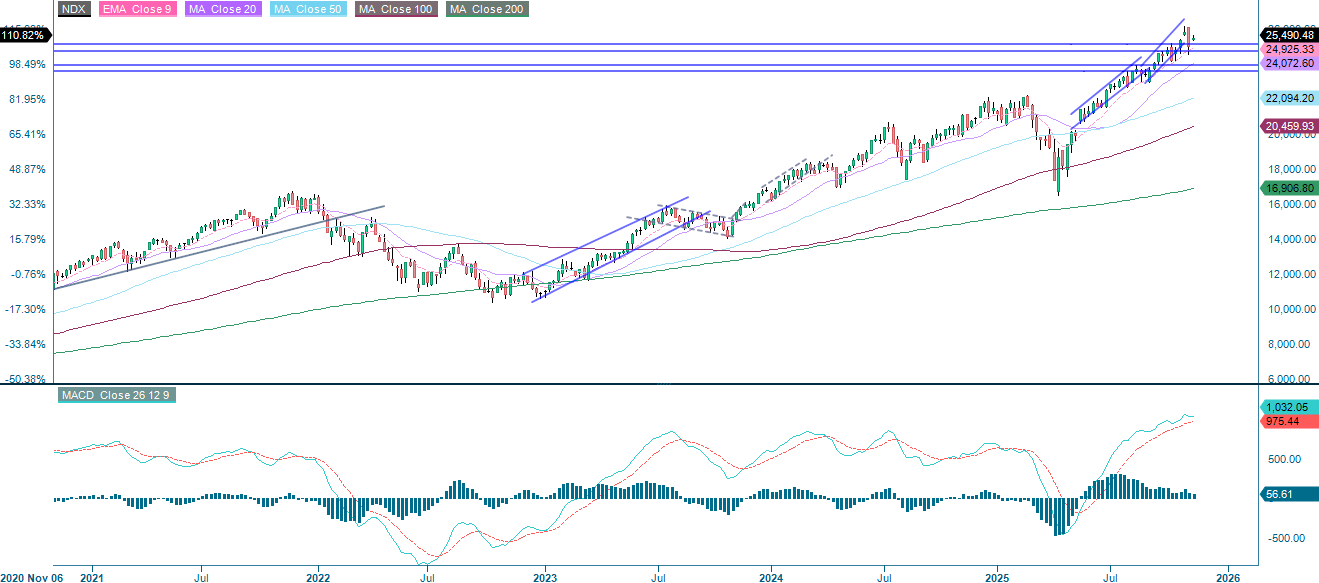
NASDAQ-100 (in USD), weekly five-year chart
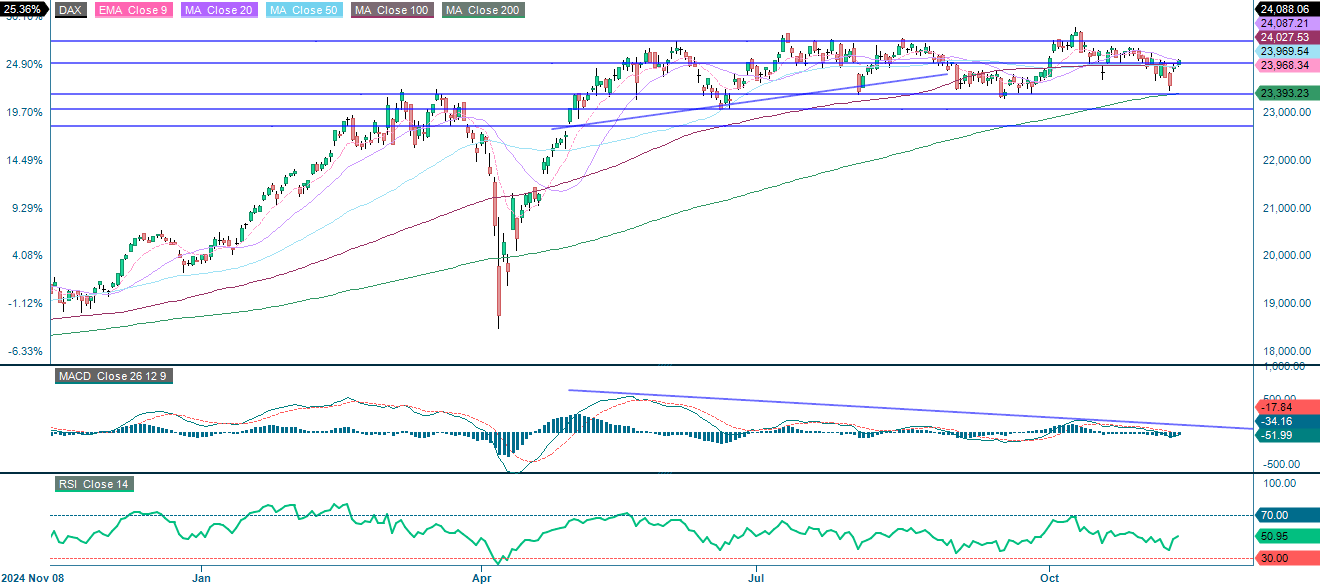
The German DAX index has regained momentum, bouncing back above the 200-day Moving Average. The index is currently testing the resistance level of 24,000. If it breaks above this level, the next target could be 24,475. Conversely, if the bears return, the index may trade downwards towards the 200-Day Moving average.
Related Products
DAX (in EUR), one-year daily chart
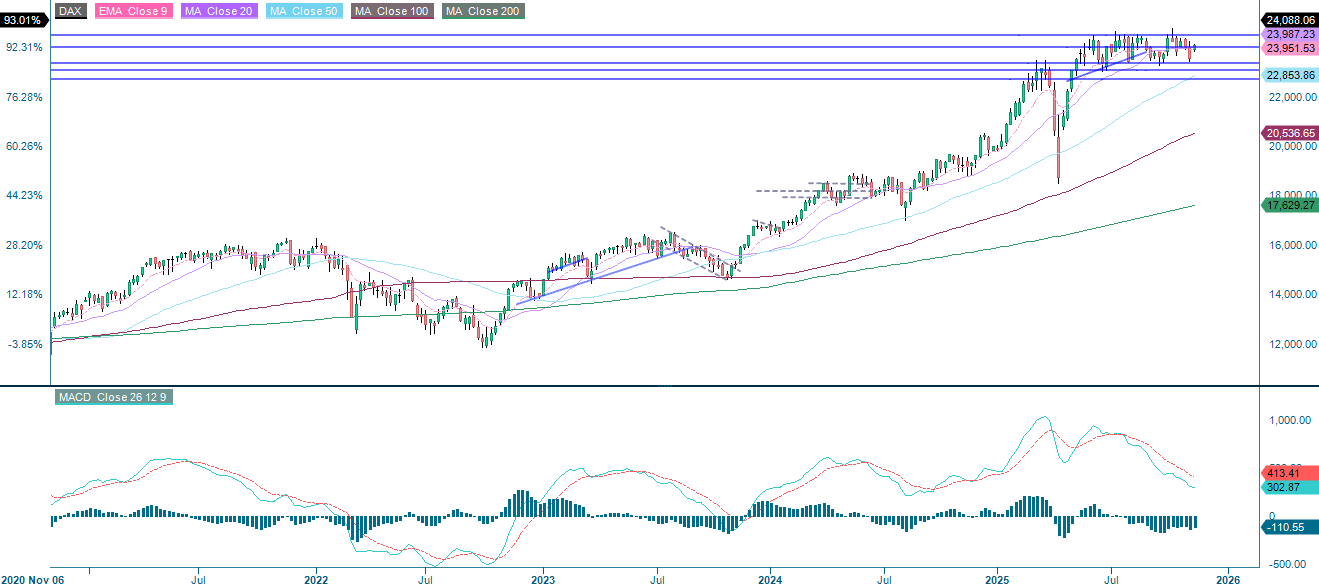
DAX (in EUR), weekly five-year chart
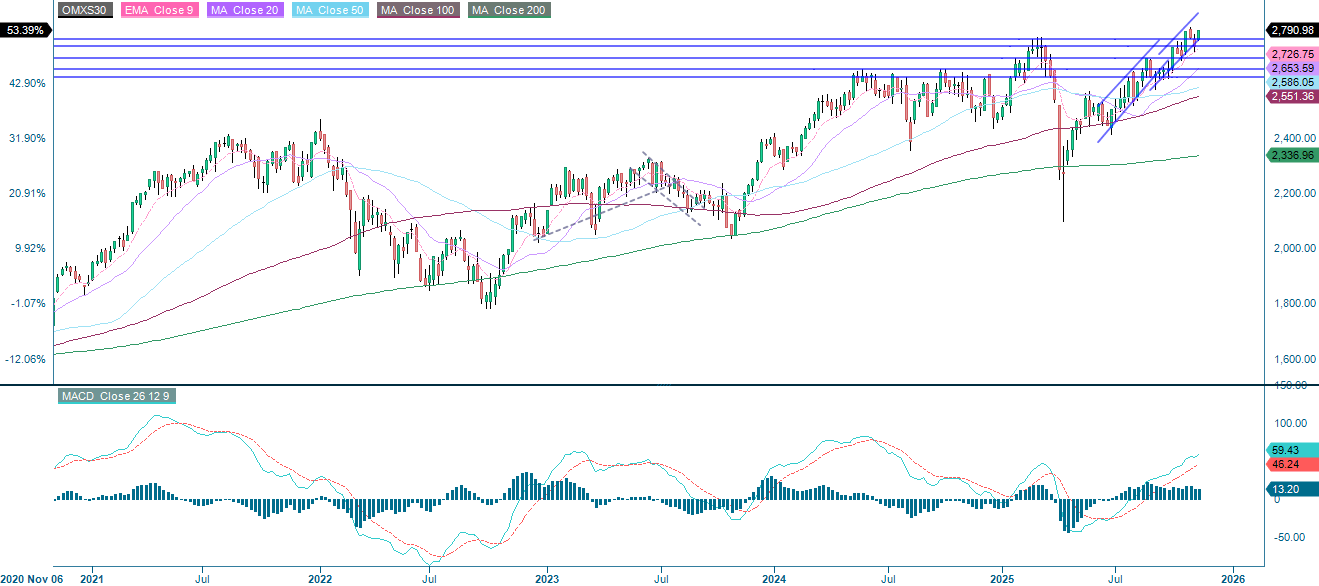
Of the four stock indices we are investigating, the OMXS30 may look the most exciting, as the index is approaching a previous high of around 2,800. If it breaks above this level, the ceiling of the rising trend channel will serve as resistance.
OMX30 (in SEK), one-year daily chart
OMX30 (in SEK), weekly five-year chart
The full name for abbreviations used in the previous text:
EMA 9: 9-day Exponential Moving Average
Fibonacci: There are several Fibonacci lines used in technical analysis. Fibonacci numbers are a sequence in which each successive number is the sum of the two previous numbers.
MA20: 20-day Moving Average
MA50: 50-day Moving Average
MA100: 100-day Moving Average
MA200: 200-day Moving Average
MACD: Moving Average Convergence Divergence
Risks
Credit risk of the issuer:
Investors in the products are exposed to the risk that the Issuer or the Guarantor may not be able to meet its obligations under the products. A total loss of the invested capital is possible. The products are not subject to any deposit protection.
Currency risk:
If the product currency differs from the currency of the underlying asset, the value of a product will also depend on the exchange rate between the respective currencies. As a result, the value of a product can fluctuate significantly.
Market risk:
The value of the products can fall significantly below the purchase price due to changes in market factors, especially if the value of the underlying asset falls. The products are not capital-protected
Product costs:
Product and possible financing costs reduce the value of the products.
Risk with leverage products:
Due to the leverage effect, there is an increased risk of loss (risk of total loss) with leverage products, e.g. Bull & Bear Certificates, Warrants and Mini Futures.
External author:
This information is in the sole responsibility of the guest author and does not necessarily represent the opinion of Bank Vontobel Europe AG or any other company of the Vontobel Group. This information is sponsored by Bank Vontobel Europe AG, which may be a counterparty to transactions involving the financial instruments discussed in this information. The further development of the index or a company as well as its share price depends on a large number of company-, group- and sector-specific as well as economic factors. When forming his investment decision, each investor must take into account the risk of price losses. Please note that investing in these products will not generate ongoing income.
The products are not capital protected, in the worst case a total loss of the invested capital is possible. In the event of insolvency of the issuer and the guarantor, the investor bears the risk of a total loss of his investment. In any case, investors should note that past performance and / or analysts' opinions are no adequate indicator of future performance. The performance of the underlyings depends on a variety of economic, entrepreneurial and political factors that should be taken into account in the formation of a market expectation.
Disclaimer:
This information is neither an investment advice nor an investment or investment strategy recommendation, but advertisement. The complete information on the products (securities) mentioned herein, in particular the structure and risks associated with an investment, are described in the base prospectus, together with any supplements, as well as the final terms relating to the securities. The base prospectus and final terms constitute the solely binding sales documents for the products mentioned herein. It is recommended that potential investors read these documents before making any investment decision. The documents and the key information document are published on the website of the issuer, Vontobel Financial Products GmbH, Bockenheimer Landstrasse 24, 60323 Frankfurt am Main, Germany, on https://prospectus.vontobel.com and are available from the issuer free of charge. The approval of the prospectus should not be understood as an endorsement of the securities. The securities are products that are not simple and may be difficult to understand. This information includes or relates to figures of past performance. Past performance is not a reliable indicator of future performance. This information may only be distributed or published in countries where such distribution or publication is permitted by applicable law. As stated in the relevant base prospectus, the distribution of the securities mentioned in this information is subject to restrictions in certain jurisdictions. This advertisement may not be reproduced or redistributed without prior permission by Vontobel.
© Bank Vontobel Europe AG and / or affiliated companies. All rights reserved.