The financial sector started the earnings season

The earnings season has officially begun, and the focus this past week has been on the US banking and financial sector. Many major banks, including JPMorgan Chase, Citigroup, Wells Fargo, BlackRock, Morgan Stanley and Goldman Sachs, released their results, giving the first guidance for the entire earnings season.
Banks started the earnings season reasonably strongly
The banks' results were mostly in line with expectations or slightly better.
However, economic uncertainty was raised, especially geopolitics, tariffs and inflation.
Another significant piece of news from the financial sector is JPMorgan Chase’s announcement that they will launch a $1.5 trillion “Security and Resiliency Initiative” over a 10-year period. The program aims to support critical industries and strengthen economic resilience. The news mentions developments in infrastructure, supply chain, energy, and technology sectors, for example.
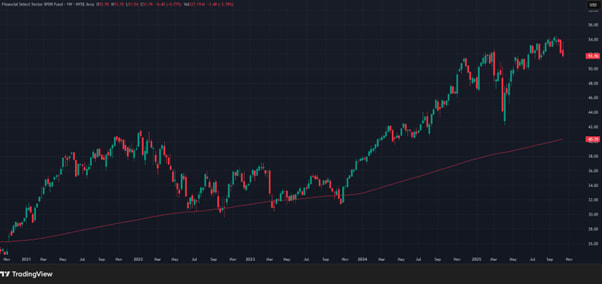
XLF, (in USD), 5-year daily chart
Related Products
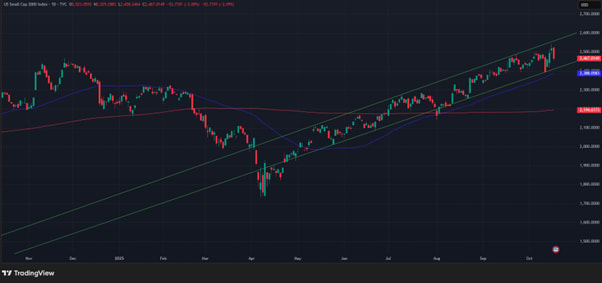
RUSSELL 2000, (in USD), 1-year daily chart
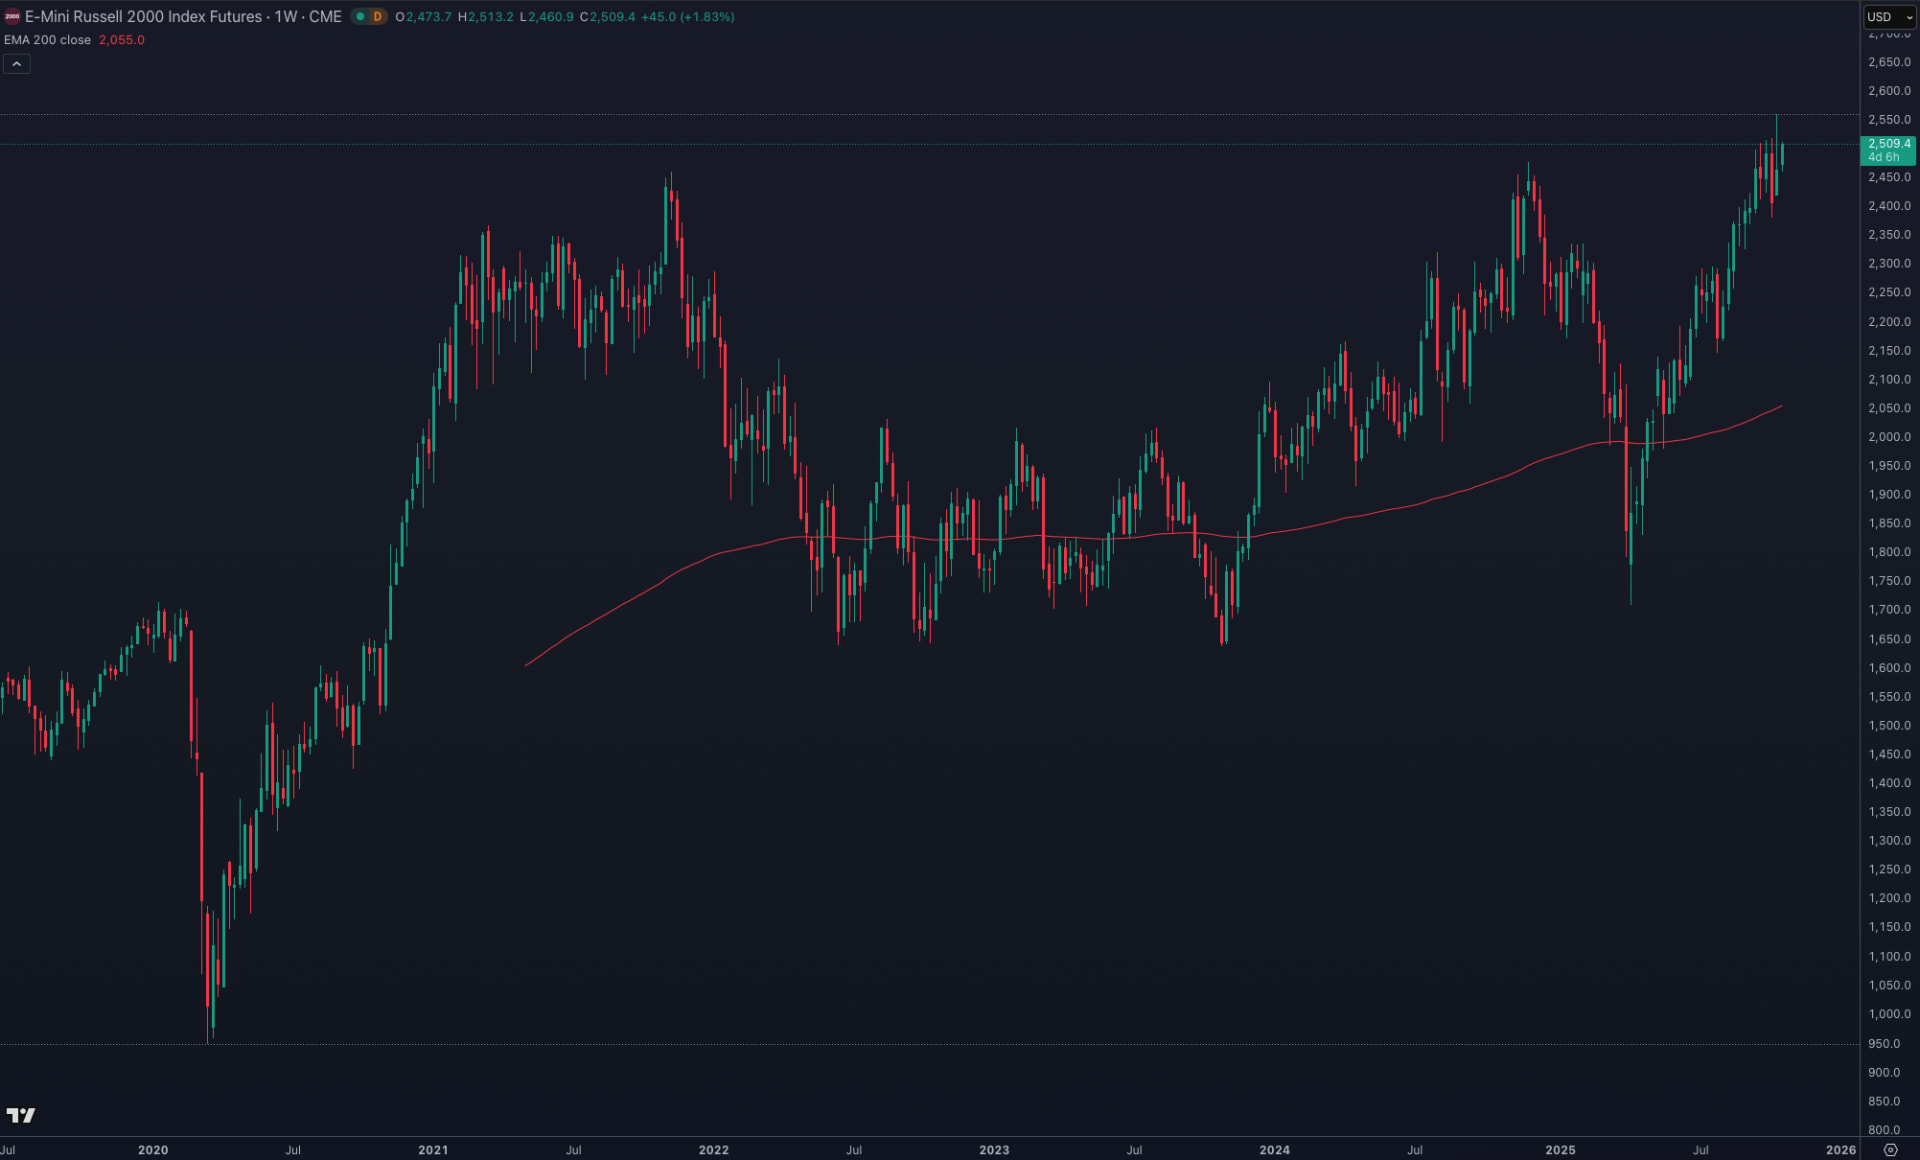
RUSSELL 2000 (in USD), 5-year weekly chart
The financial sector's performance was particularly visible in the Russell 2000 index, where banks have a significant weighting. The index reached a new All Time High, (‘ATH’), readings and has clearly outperformed the S&P500 and NASDAQ indices since the start of the earnings season.
The price has remained within the channel drawn on the chart and is clearly above the SMA50 and 200-Day Simple Moving Average (‘SMA200’) moving averages. However, if the price breaks the lower end of the channel and the SMA50 moving average, the technical picture would become weaker.
The focus shifts to the following sectors
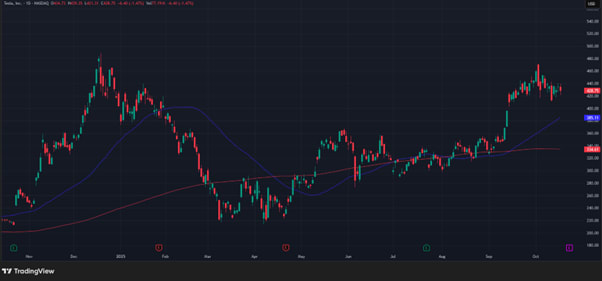
This week and the coming weeks, the earnings season will accelerate even more, as technology companies, industrials and the consumer sector take their turn. Investors are particularly interested in technology and MAG7 companies. Among the larger companies that can be mentioned this week are Tesla and Netflix, which will certainly receive a lot of attention. Tesla will publish its third-quarter results on October 22 after the US market closes.
Reports from industrial companies also provide valuable information on the state of global demand and the situation of supply chains.
The results of the consumer sector, on the other hand, provide indications of how strong purchasing power and confidence in the economy have remained.
Related Products
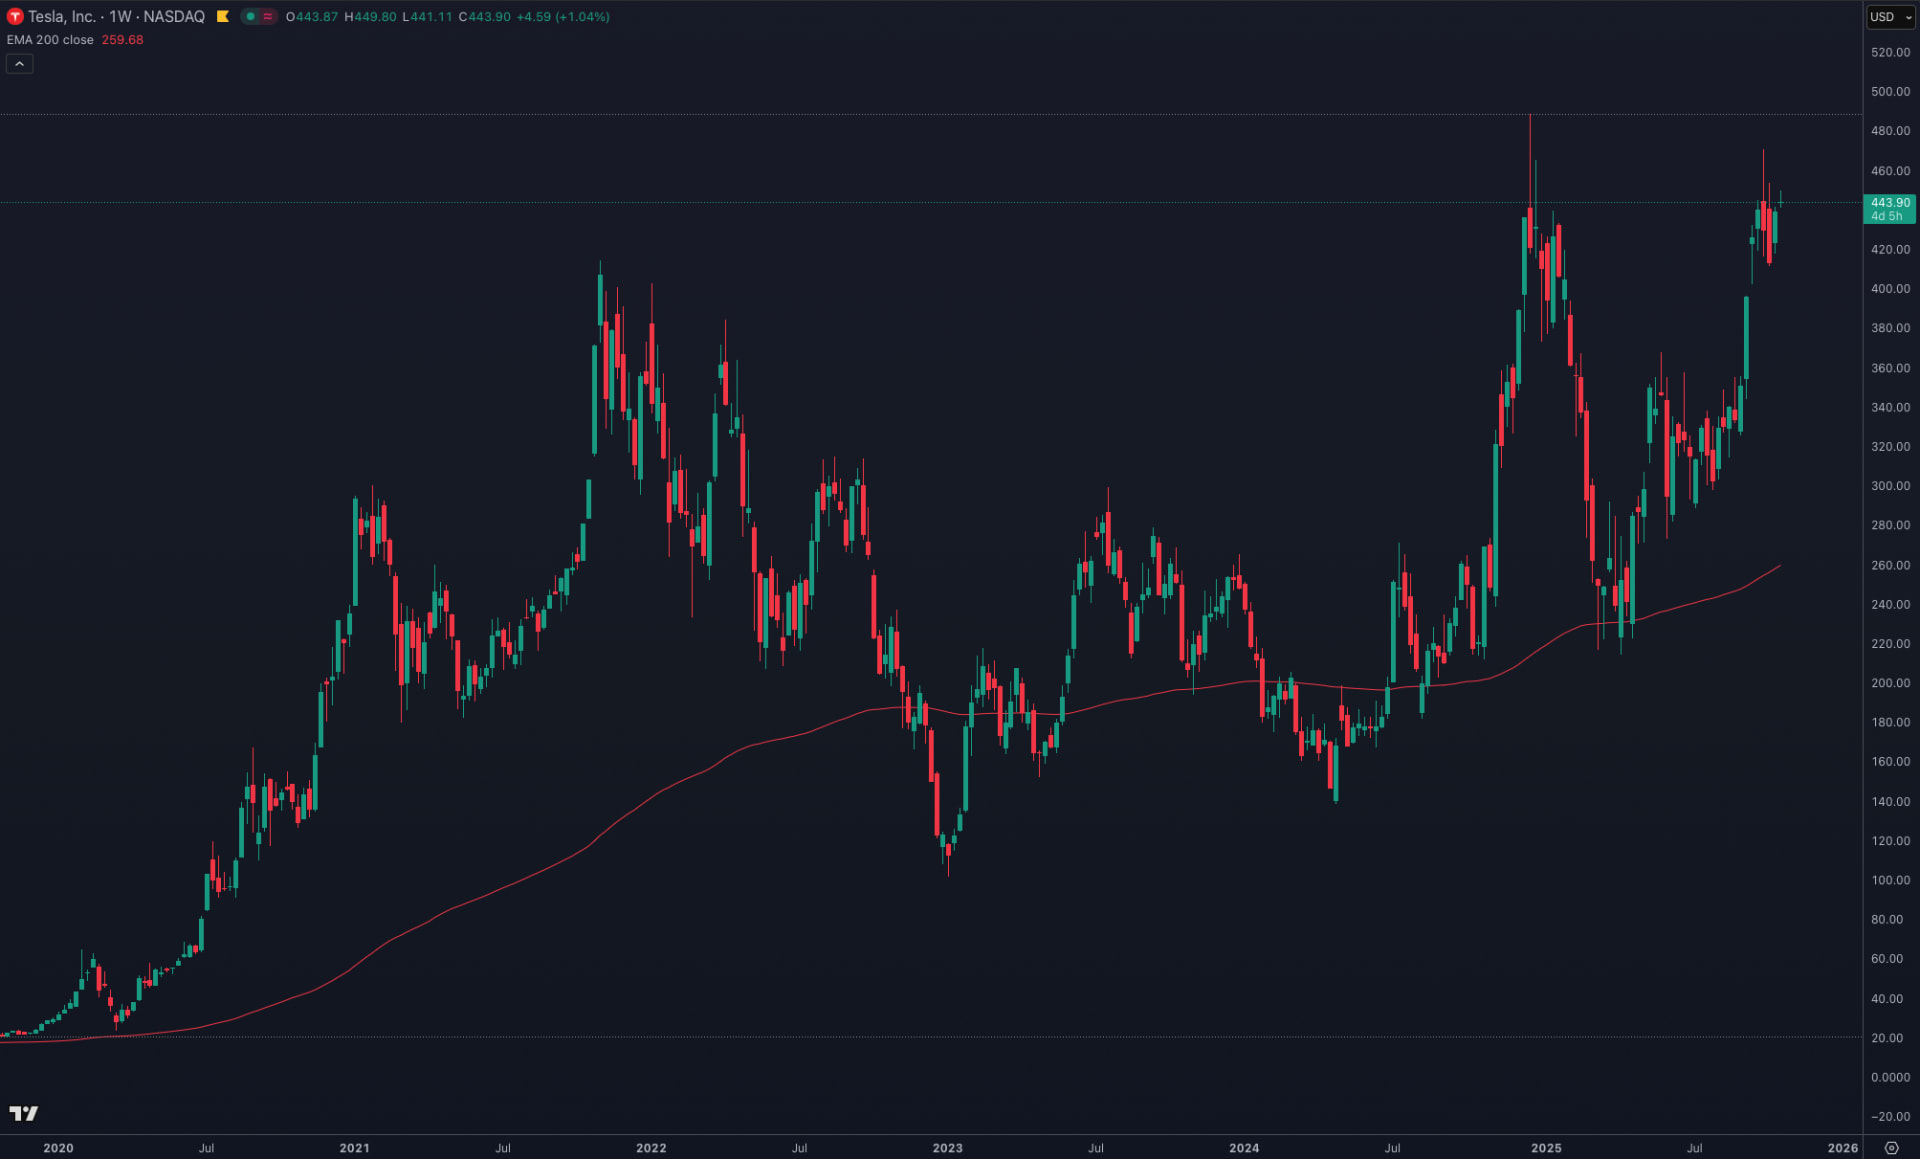
Tesla, (in USD), 1-year daily chart
Tesla, (in USD), 5-year weekly chart
Current market sentiment
The markets are in a somewhat uncertain situation since the start of the earnings season. The price fluctuations of the previous weeks have shown that negative news or topics can cause significant declines in the markets. This was seen very clearly on Friday, October 10, when the trade war between the United States and China intensified.
Uncertainty is also being caused by the US government shutdown, which has not yet been agreed upon at the time of writing. As a result, no relevant macro data has been released from the US for the time being, which is bringing uncertainty to the markets. If macro data were released normally and were strong, it could calm the markets somewhat.
The earnings season has started off solidly, but the biggest excitement is yet to come. The first reports give a positive signal, but in the coming weeks will show whether the strong momentum continues in other industries.
Related Products
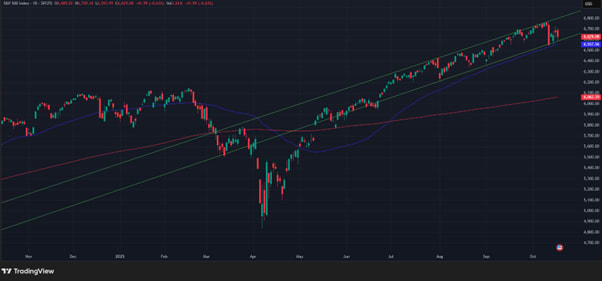
S&P500, (in USD), one-year daily chart 1-year daily chart
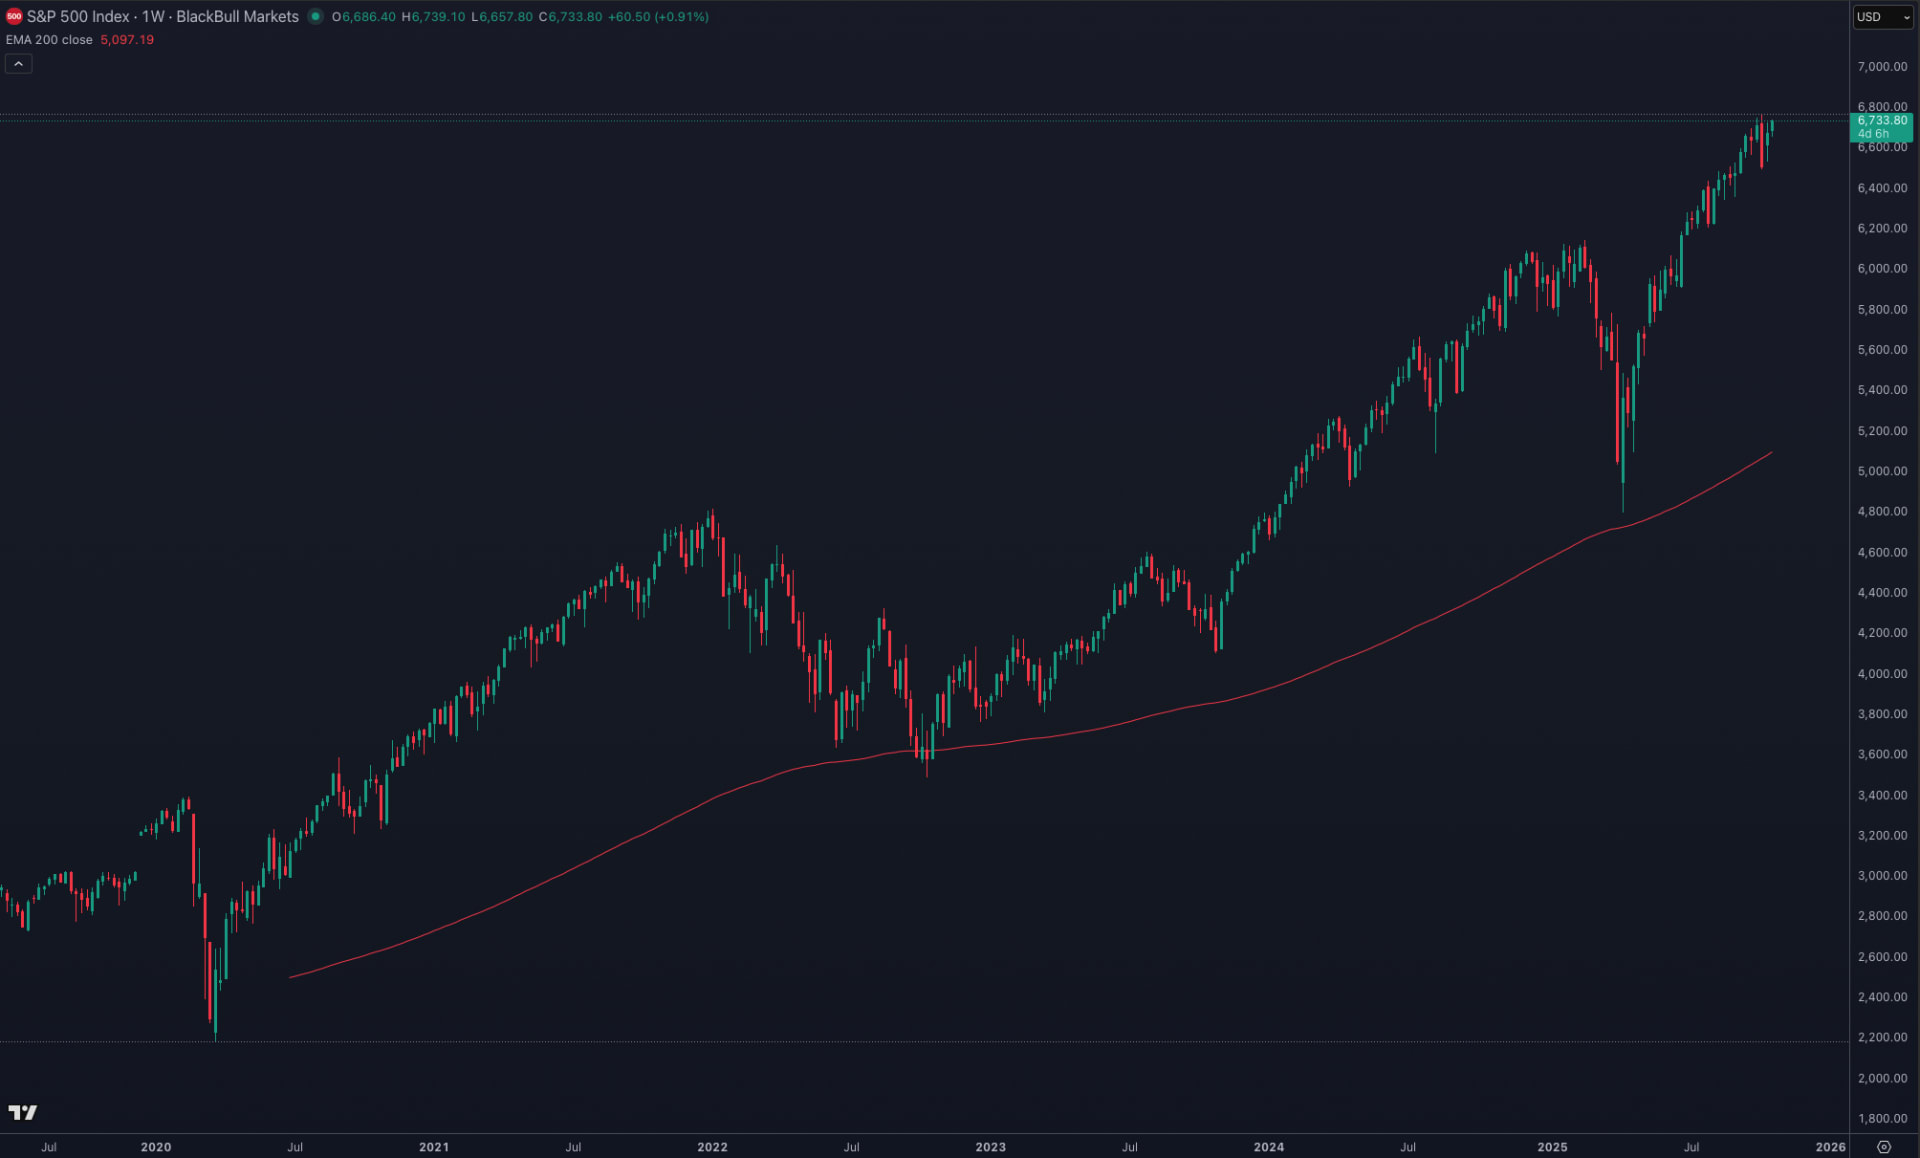
S&P500, (in USD), 5-year weekly chart
The S&P500 index has seen a clear downward movement, and the downward movement seen on Friday, October 10th was the largest since April 2025.
The price is still within the channel drawn on the chart, the lower end of which could act as a potential support. The 50-Day Simple Moving Average (‘SMA50’) moving average is also at the same level. If this level is broken clearly downwards, the technical picture of the index would become clearly weaker.
Compared to the previously viewed RUSSELL 2000 index, the weaker performance of the S&P500 index since the earnings season has begun is more clearly noticeable. The price has also moved more towards the lower end of the channel, which may increase the probability of a breakout of the level.
In the current, uncertain market climate, it may be a good idea to consider, for example, possible portfolio hedging, unless market uncertainties are clarified.
Summary
The earnings season has started off solidly, with the financial sector in particular making a positive start. However, markets remain uncertain due to geopolitical tensions and domestic political challenges in the United States.
The coming weeks will show on the earnings side whether the positive momentum will continue in other sectors or whether the market will find a new direction as the earnings season progresses.
—
Indicators shown on the graphs:
● Simple Moving Average, 50, blue
● Simple Moving Average, 200, red
Risks
Credit risk of the issuer:
Investors in the products are exposed to the risk that the Issuer or the Guarantor may not be able to meet its obligations under the products. A total loss of the invested capital is possible. The products are not subject to any deposit protection.
Currency risk:
If the product currency differs from the currency of the underlying asset, the value of a product will also depend on the exchange rate between the respective currencies. As a result, the value of a product can fluctuate significantly.
Market risk:
The value of the products can fall significantly below the purchase price due to changes in market factors, especially if the value of the underlying asset falls. The products are not capital-protected
Product costs:
Product and possible financing costs reduce the value of the products.
Risk with leverage products:
Due to the leverage effect, there is an increased risk of loss (risk of total loss) with leverage products, e.g. Bull & Bear Certificates, Warrants and Mini Futures.
External author:
This information is in the sole responsibility of the guest author and does not necessarily represent the opinion of Bank Vontobel Europe AG or any other company of the Vontobel Group. This information is sponsored by Bank Vontobel Europe AG, which may be a counterparty to transactions involving the financial instruments discussed in this information. The further development of the index or a company as well as its share price depends on a large number of company-, group- and sector-specific as well as economic factors. When forming his investment decision, each investor must take into account the risk of price losses. Please note that investing in these products will not generate ongoing income.
The products are not capital protected, in the worst case a total loss of the invested capital is possible. In the event of insolvency of the issuer and the guarantor, the investor bears the risk of a total loss of his investment. In any case, investors should note that past performance and / or analysts' opinions are no adequate indicator of future performance. The performance of the underlyings depends on a variety of economic, entrepreneurial and political factors that should be taken into account in the formation of a market expectation.
Disclaimer:
This information is neither an investment advice nor an investment or investment strategy recommendation, but advertisement. The complete information on the products (securities) mentioned herein, in particular the structure and risks associated with an investment, are described in the base prospectus, together with any supplements, as well as the final terms relating to the securities. The base prospectus and final terms constitute the solely binding sales documents for the products mentioned herein. It is recommended that potential investors read these documents before making any investment decision. The documents and the key information document are published on the website of the issuer, Vontobel Financial Products GmbH, Bockenheimer Landstrasse 24, 60323 Frankfurt am Main, Germany, on https://prospectus.vontobel.com and are available from the issuer free of charge. The approval of the prospectus should not be understood as an endorsement of the securities. The securities are products that are not simple and may be difficult to understand. This information includes or relates to figures of past performance. Past performance is not a reliable indicator of future performance. This information may only be distributed or published in countries where such distribution or publication is permitted by applicable law. As stated in the relevant base prospectus, the distribution of the securities mentioned in this information is subject to restrictions in certain jurisdictions. This advertisement may not be reproduced or redistributed without prior permission by Vontobel.
© Bank Vontobel Europe AG and / or affiliated companies. All rights reserved.