Is it time for another recoil?


Although the world's stock market indices quickly recovered from the shock of Trump's tariffs in April, a weaker US-Dollar (USD) appears to be the new norm. Combined with a stronger Swedish Krona (SEK) and disappointing Q1 2025 reports, with only around half of Swedish companies exceeding consensus estimates, it is believed this will put pressure on the OMX30 index. From a technical analysis perspective, it seems that a rebound following the rapid recovery is ahead.
Case of the week: Weak USD and poor Q1 earnings to weigh on OMX
After a one-week drop of around 13% (2-8 April) following President Trump's surprise tariff announcements, global equity markets have since recovered quickly. However, the weakening of the US dollar appears to be a lasting consequence of the uncertainty surrounding the Trump administration. For the first time in many years, the US dollar's role as the world's reserve currency is being challenged, at least in part.
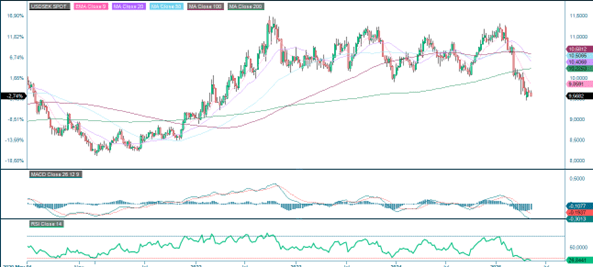
While the USD has weakened towards most currencies, the SEK has appreciated by around 5% against the EUR and 16% against the USD since 1 January 2025. The fall in the USD/SEK exchange rate from 11.15 at the start of 2025 to 9.58 at the time of writing is negative for the majority of large OMX companies.
USD/SEK, weekly five-year chart
The OMX30 index is dominated by large companies in the engineering, mining, and telecommunications sectors which export goods and services. Examples of these companies include Atlas Copco, Epiroc, Ericsson, Sandvik, SKF and Volvo AB, as well as Volvo Cars.
The USD/SEK exchange rate tends to have the largest relative impact on the earnings of Boliden, Ericsson, Skanska and Volvo AB. Skanska is an example of a company with about half of its operations in the United States. A stronger SEK also has a negative impact on the earnings of OMX companies when the earnings of foreign subsidiaries are translated from EUR or USD into SEK. However, a weaker USD also has a negative impact on Sandvik's exports, as well as those of the pulp and paper sector (Stora Enso, Holmen and SCA), whose main competitors are mainly based in North America.
Larger companies often hedge their currency flows over a period of around six months, meaning that the impact of a stronger SEK will gradually be reflected in their quarterly earnings for the rest of 2025. In addition to changes in tariffs between Europe and the United States, currency fluctuations will also affect corporate pricing. In other words, Swedish companies will need to consider whether they should lower their prices to compensate for these effects.
Another factor that could affect the future price of the OMX30 is the weaker-than-expected Q1 2025 results. As of Tuesday, 6 May, 65 Swedish OMX companies had reported their Q1 2025 results. In terms of operating results, 47% were lower than expected, while 53% fell short of sales expectations. Once again, the Swedish banks appear to be the OMX30 sector that performed best relative to expectations. Together with weak industry data, such as the five-year low in North American heavy vehicle orders in April 2025, this suggests that investors should currently limit their exposure to cyclical sectors. The OMX30 index is dominated by cyclical companies. Therefore, it might be suggested shorting the OMX30 index.
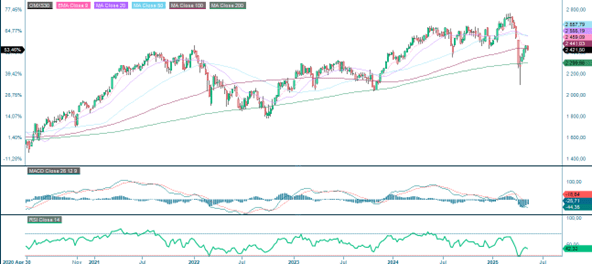
From a technical perspective, the OMXS30 index is currently trading below the resistance level of 2,500. The first level of support is EMA9, currently at 2,424. This is followed by the 2,400 level and the MA20, which is currently at 2,355.
OMX30 (in SEK), one-year daily chart

OMX30 (in SEK), five-year weekly chart
Macro comments
US non-farm payrolls for April came in at 177,000 on Friday 2 May 2025 versus expectations for 130,000 new jobs. This boosted stock market indices in the US, where both the S&P500 closed 1.5% higher on Friday and the NASDAQ rose 1.6%. At the same time, US interest rates also rose significantly.
For Q1 2025, with 72% of S&P500 companies reporting by 25 April 2025, 76% have reported positive EPS (Earnings per Share) surprises and 62% have reported positive revenue surprises. However, from 31 March to 30 April 2025, Wall Street analysts have cut their Q2 2025 EPS estimates by an average of 2.4%. The largest EPS estimate cuts were seen in Energy with 14.8%, followed by Industrials with 4.7% and Consumer Discretionary with 4.0%.
On Wednesday 7 May, interim reports are due from Loomis, Lundin Mining and Skanska in Sweden, Novo Nordisk in Denmark, Storebrand, DNB, Schibsted and Aker BP in Norway, Schaeffler in Germany and Walt Disney in the US. The macro agenda starts with Japan's services PMI (Purchasing Managers’ Index) for April. Then Sweden's CPI (Consumer Price Index) for April is scheduled, followed by Germany's VDMA Machinery Orders and Eurozone Retail Sales, both for March. The main event of the day will be the Fed's (Federal Reserve) interest rate announcement in the evening, according to European time. Weekly oil inventories statistics (Department of Energy) will be received from the US.
On Thursday 8 May, interim reports from Balder, Holmen, Hufvudstaden and Securitas in Sweden, Maersk in Denmark, Rheinmetall in Germany, Nintendo and Toyota in Japan and Anheuser Busch Inbev, Conoco Philips and Shopify in the US are expected. On the macro news front, Germany's trade balance and industrial production for March, followed by Italy's CPI for April. The US contributes with weekly intial jobless claims and wholesale inventories in March will start. Interest rate announcements from the Bank of England, Sveriges Riksbank and Norges Bank are also expected
Bonava and Orkla in the Nordic region, and Enbridge in the US, are among the few companies posting their interim reports on Friday, 9 May. China's trade balance for April will kick off Friday's macro news feed. This will be followed by Swedish household consumption and industrial orders in March, as well as UK industrial production also for March. In the afternoon (European time), Canada will release its April unemployment figures.
One-month, Year-to-Date, and five-year performance of equity indices ranked by last month

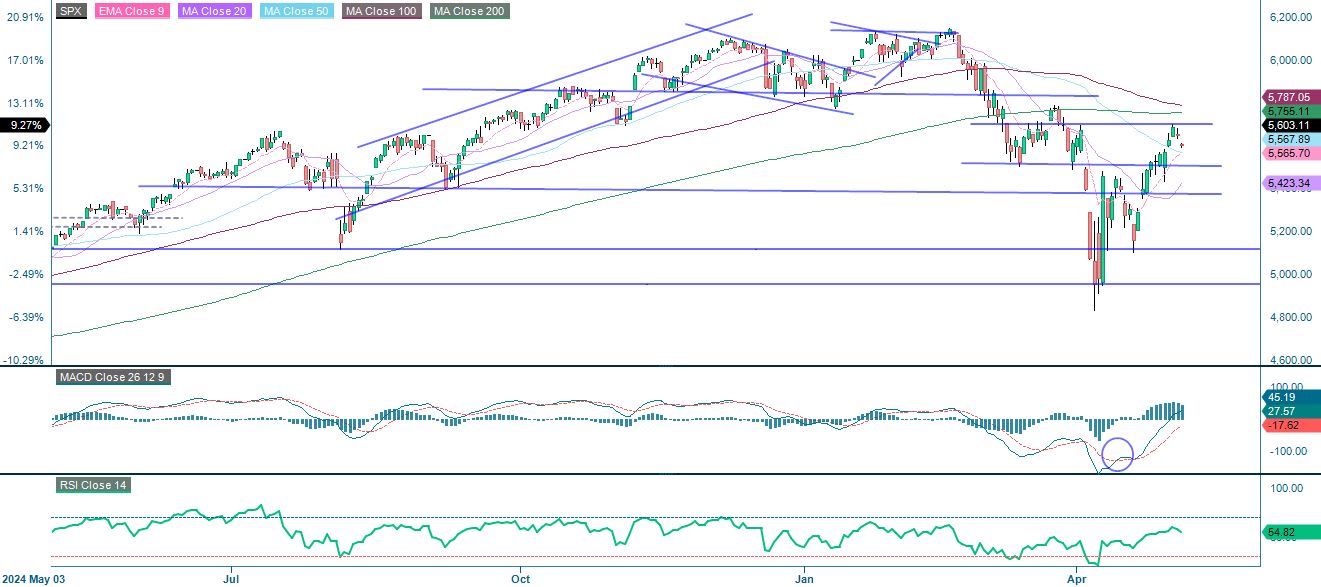
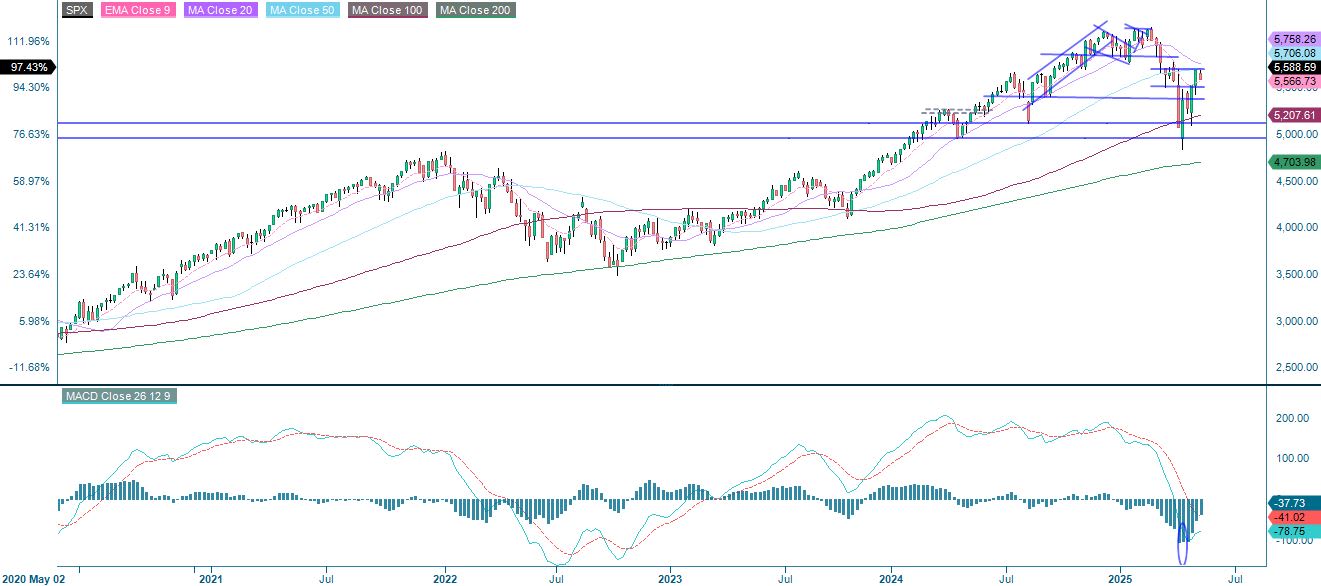
The S&P 500 is at a crossroads
The S&P 500 performed strongly in the second half of April. A break above the MA200, currently at 5,755, is needed for the long-term trend to turn positive. However, the S&P 500 is currently bouncing off resistance at 5,700 and the next support level on the downside is at 5,565. A break below this level could see 5,500 as the next target. Perhaps a sell-off is needed to gather energy for the next wave to break the long-term negative downtrend.
Related Products
S&P 500 (in USD), one-year daily chart
S&P 500 (in USD), five-year weekly chart
The NASDAQ bounced off resistance at MA200 and fell below the support level of around 19,000. The next support level on the downside is EMA9, which is currently at 19,566. If this level is broken, the next level to watch is 19,200.
NASDAQ-100 (in USD), one-year daily chart

NASDAQ-100 (in USD), five-year weekly chart

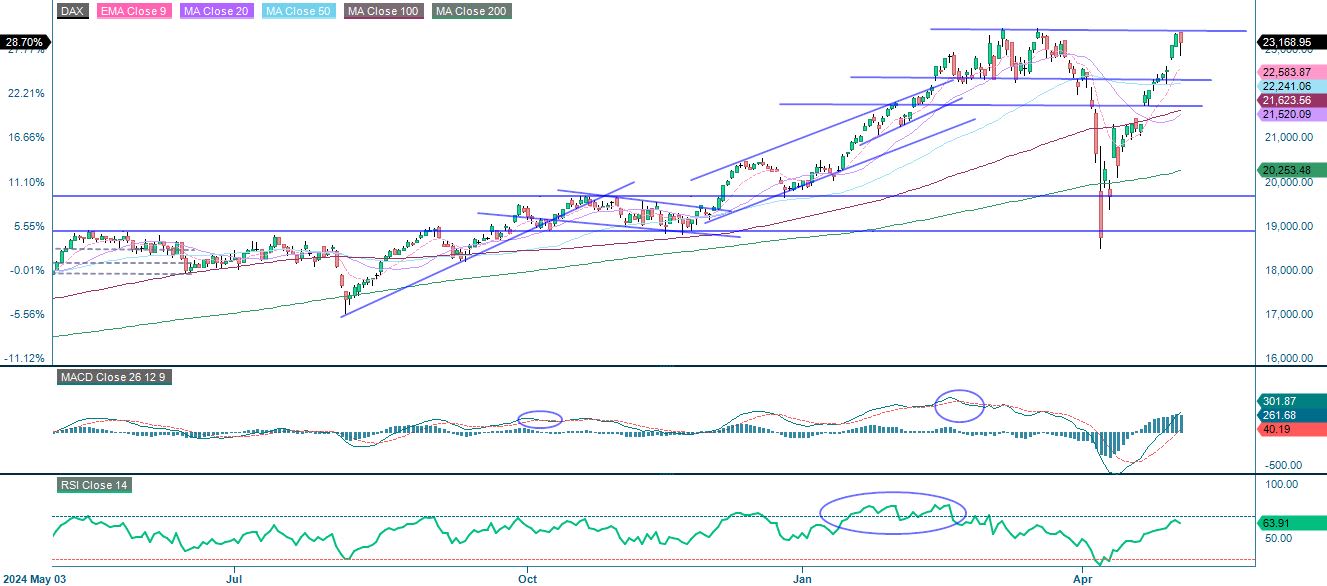
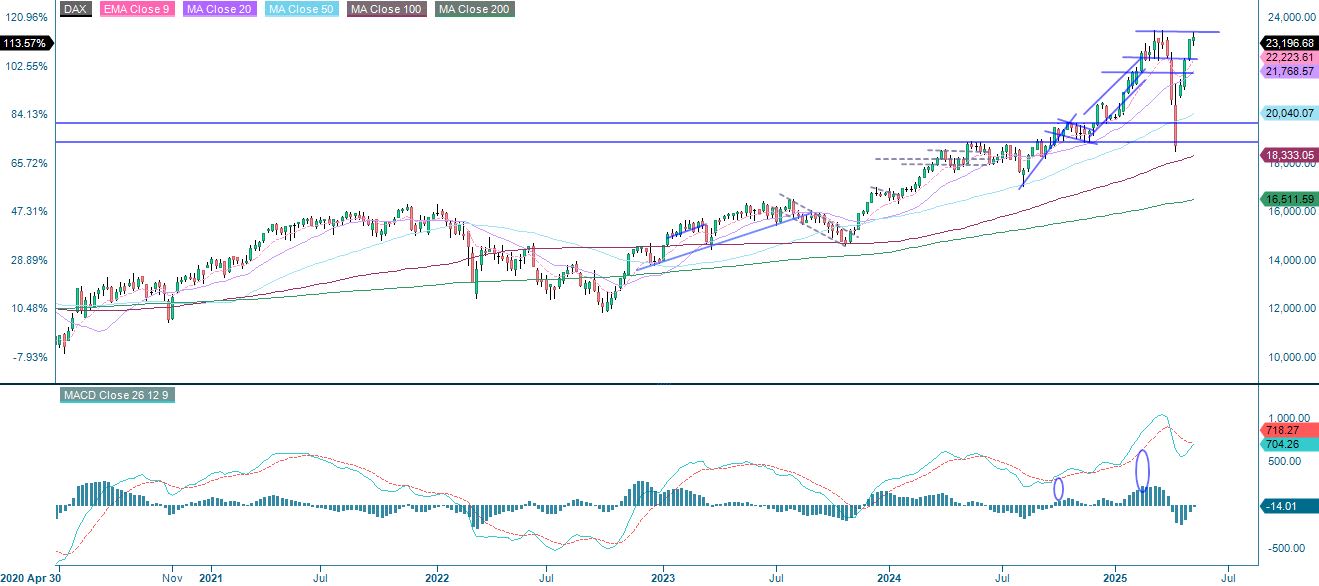
The German DAX is trading close to previous highs following a strong rally from early April lows. This rally has been exceptional, so taking some profits around these levels may not be a bad idea. On the downside, the EMA9, currently at 22,583, serves as the first level of support, followed by 22,325.
DAX (in EUR), one-year daily chart
DAX (in EUR), five-year weekly chart
The full name for abbreviations used in the previous text:
EMA 9: 9-day exponential moving average
Fibonacci: There are several Fibonacci lines used in technical analysis. Fibonacci numbers are a sequence in which each successive number is the sum of the two previous numbers.
MA20: 20-day moving average
MA50: 50-day moving average
MA100: 100-day moving average
MA200: 200-day moving average
MACD: Moving average convergence divergence
Risks
Credit risk of the issuer:
Investors in the products are exposed to the risk that the Issuer or the Guarantor may not be able to meet its obligations under the products. A total loss of the invested capital is possible. The products are not subject to any deposit protection.
Currency risk:
If the product currency differs from the currency of the underlying asset, the value of a product will also depend on the exchange rate between the respective currencies. As a result, the value of a product can fluctuate significantly.
External author:
This information is in the sole responsibility of the guest author and does not necessarily represent the opinion of Bank Vontobel Europe AG or any other company of the Vontobel Group. This information is sponsored by Bank Vontobel Europe AG, which may be a counterparty to transactions involving the financial instruments discussed in this information. The further development of the index or a company as well as its share price depends on a large number of company-, group- and sector-specific as well as economic factors. When forming his investment decision, each investor must take into account the risk of price losses. Please note that investing in these products will not generate ongoing income.
The products are not capital protected, in the worst case a total loss of the invested capital is possible. In the event of insolvency of the issuer and the guarantor, the investor bears the risk of a total loss of his investment. In any case, investors should note that past performance and / or analysts' opinions are no adequate indicator of future performance. The performance of the underlyings depends on a variety of economic, entrepreneurial and political factors that should be taken into account in the formation of a market expectation.
Market risk:
The value of the products can fall significantly below the purchase price due to changes in market factors, especially if the value of the underlying asset falls. The products are not capital-protected
Product costs:
Product and possible financing costs reduce the value of the products.
Risk with leverage products:
Due to the leverage effect, there is an increased risk of loss (risk of total loss) with leverage products, e.g. Bull & Bear Certificates, Warrants and Mini Futures.
Disclaimer:
This information is neither an investment advice nor an investment or investment strategy recommendation, but advertisement. The complete information on the products (securities) mentioned herein, in particular the structure and risks associated with an investment, are described in the base prospectus, together with any supplements, as well as the final terms relating to the securities. The base prospectus and final terms constitute the solely binding sales documents for the products mentioned herein. It is recommended that potential investors read these documents before making any investment decision. The documents and the key information document are published on the website of the issuer, Vontobel Financial Products GmbH, Bockenheimer Landstrasse 24, 60323 Frankfurt am Main, Germany, on https://prospectus.vontobel.com and are available from the issuer free of charge. The approval of the prospectus should not be understood as an endorsement of the securities. The securities are products that are not simple and may be difficult to understand. This information includes or relates to figures of past performance. Past performance is not a reliable indicator of future performance. This information may only be distributed or published in countries where such distribution or publication is permitted by applicable law. As stated in the relevant base prospectus, the distribution of the securities mentioned in this information is subject to restrictions in certain jurisdictions. This advertisement may not be reproduced or redistributed without prior permission by Vontobel.
© Bank Vontobel Europe AG and / or affiliated companies. All rights reserved.