Divergence in stock markets – US falters, Europe holds its ground

During the Q3 earnings season, an interesting phenomenon has emerged in the stock markets. Major US indices have declined, driven by weakness in the technology sector, while European stock markets have performed better than their US counterparts. This divergence between markets also reflects an ongoing global sector rotation.
Expensive technology and interest rates weigh on the United States
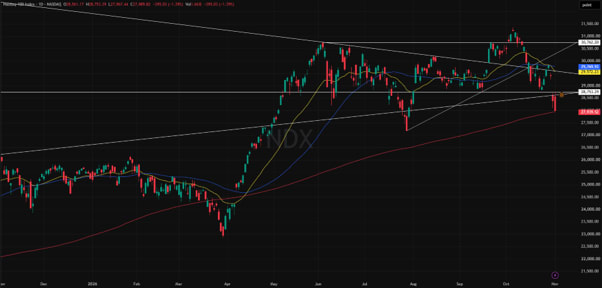
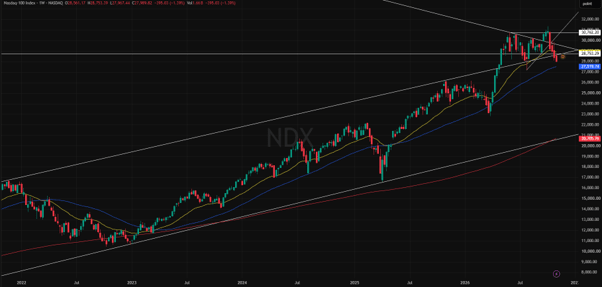
The recent weakness in the U.S. stock market appears to be partly linked to the structure of the indices and high expectations. The indices are heavily weighted toward technology stocks, and as investors reassessed the potential payback period for substantial investments in artificial intelligence, stocks that previously supported index performance came under pressure.
The results from the previous week may illustrate this trend. Alphabet shares fell by approximately 12% following its earnings release, as the company’s revenue came in below expectations and continued investment on free cash flow. Amazon also experienced an initial decline of up to 10% in after-hours trading following a weaker-than-expected Q4 revenue outlook, although the share later recovered. Microsoft rose by about 6% in after-hours trading after reporting strong growth in its Azure cloud business (+48%), but these gains proved short-lived amid broader weakness across parts of the artificial intelligence sector.
The interest rate environment may also remain a factor for equity markets. On October 28, the Fed kept its key interest rate unchanged at 3.75–4.00 percent. Market pricing continues to reflect the possibility of a rate increase in December, while the yield on the 10-year US Treasury bond remains close to 5 percent. Although oil prices have retreated from their October highs, helping to ease some inflation concerns, a renewed increase in energy prices could bring inflation risks back into focus.
Related Products
NASDAQ, 1-year chart
NASDAQ, 5-year chart
Europe benefits from its "dullness"
Europe and the UK have performed better than the United States over the past few weeks. One possible explanation lies in the composition of the indices and their comparatively lower valuation multiples. The forward P/E ratio for the Stoxx Europe 600 index is approximately 15, whereas the corresponding figure for the S&P 500 is significantly higher, around 19. According to an estimate by Goldman Sachs in August, earnings per share for companies in the Stoxx 600 index grew by approximately 14 percent during the first half of the year, and the earnings growth forecast for the full year was raised to 15 percent.
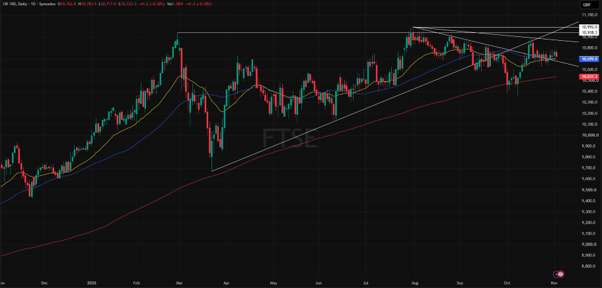
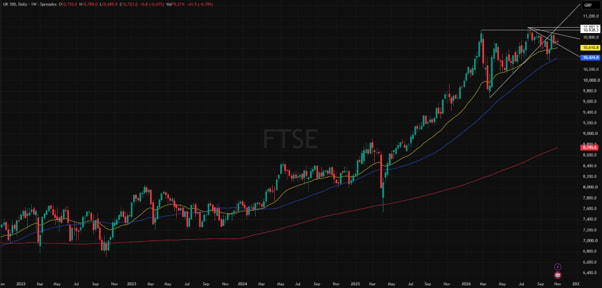
The UK’s FTSE 100 index is practically tailor-made for the current market environment. It is defensive in nature, with a heavy weighting toward energy giants, mining companies, the financial sector, and the pharmaceutical industry. The UK's FTSE 100 index is relatively defensive in its sector composition, with significant exposure to energy, mining, financials and pharmaceuticals. During periods when the technology sector comes under pressure, companies in these sectors have at times shown greater resilience than the broader market. During the recent weakness in U.S. equities, the FTSE 100 has generally remained more stable than major U.S. indices. However, given its significant exposure to the energy sector, the index may be sensitive to substantial fluctuations in oil prices.
FTSE 100, 1-year chart
FTSE 100, 5-year chart
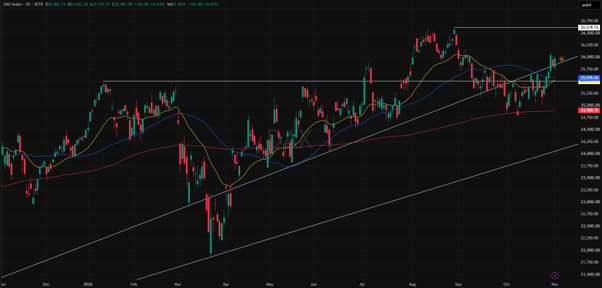
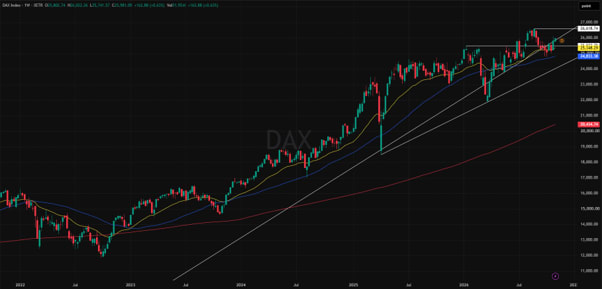
Germany’s DAX has also shown relatively stable movement. Over the past week, the index experienced a sharp rise, as the price broke above the SMA50 moving average (blue). In October, the DAX also tested the long-term SMA200 moving average (red), which has so far provided strong support against any further significant decline.
Related Products
DAX, 1-year chart
DAX, 5-year chart
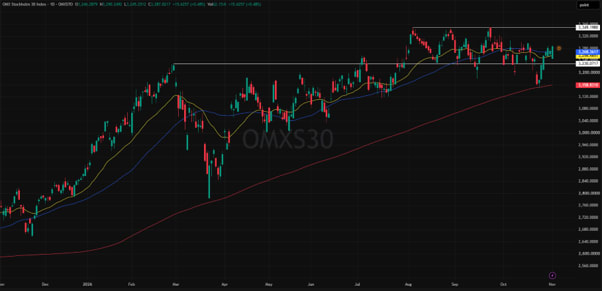
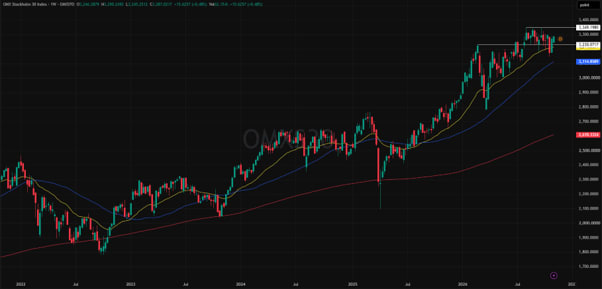
Sweden’s OMXS30 is heavily dependent on global export industries and large banks, both of which carry significant weight in the index. The current interest rate environment has bolstered the banks' net interest margins, helping to keep the index stable and even positive, despite the challenges faced by the interest-sensitive real estate sector.
OMXS30, 1-year chart
OMXS30, 5-year chart
Summary
The ongoing sector rotation has contributed to changing leadership within global equity markets, although this development cannot be viewed simply as a case of the United States versus Europe. Rather, recent market movements may reflect a reassessment by some investors of the anticipated returns on artificial intelligence-related investments, which has weighed on parts of the U.S. technology sector. At the same time, the more traditional sector composition of many European and UK equity indices appears to have provided relative support during this period.
Indicators shown on the graphs:
- SMA200: 200-Day Moving Average, red.
- SMA50: 50-Day Moving Average, blue.
- EMA25: 25-Day Exponential Moving Average, yellow.
Risks
Credit risk of the issuer:
Investors in the products are exposed to the risk that the Issuer or the Guarantor may not be able to meet its obligations under the products. A total loss of the invested capital is possible. The products are not subject to any deposit protection.
Currency risk:
If the product currency differs from the currency of the underlying asset, the value of a product will also depend on the exchange rate between the respective currencies. As a result, the value of a product can fluctuate significantly.
Market risk:
The value of the products can fall significantly below the purchase price due to changes in market factors, especially if the value of the underlying asset falls. The products are not capital-protected
Product costs:
Product and possible financing costs reduce the value of the products.
Risk with leverage products:
Due to the leverage effect, there is an increased risk of loss (risk of total loss) with leverage products, e.g. Bull & Bear Certificates, Warrants and Mini Futures.
External author:
This information is in the sole responsibility of the guest author and does not necessarily represent the opinion of Bank Vontobel Europe AG or any other company of the Vontobel Group. This information is sponsored by Bank Vontobel Europe AG, which may be a counterparty to transactions involving the financial instruments discussed in this information. The further development of the index or a company as well as its share price depends on a large number of company-, group- and sector-specific as well as economic factors. When forming his investment decision, each investor must take into account the risk of price losses. Please note that investing in these products will not generate ongoing income.
The products are not capital protected, in the worst case a total loss of the invested capital is possible. In the event of insolvency of the issuer and the guarantor, the investor bears the risk of a total loss of his investment. In any case, investors should note that past performance and / or analysts' opinions are no adequate indicator of future performance. The performance of the underlyings depends on a variety of economic, entrepreneurial and political factors that should be taken into account in the formation of a market expectation.
Disclaimer:
This information is neither an investment advice nor an investment or investment strategy recommendation, but advertisement. The complete information on the products (securities) mentioned herein, in particular the structure and risks associated with an investment, are described in the base prospectus, together with any supplements, as well as the final terms relating to the securities. The base prospectus and final terms constitute the solely binding sales documents for the products mentioned herein. It is recommended that potential investors read these documents before making any investment decision. The documents and the key information document are published on the website of the issuer, Vontobel Financial Products GmbH, Bockenheimer Landstrasse 24, 60323 Frankfurt am Main, Germany, on https://prospectus.vontobel.com and are available from the issuer free of charge. The approval of the prospectus should not be understood as an endorsement of the securities. The securities are products that are not simple and may be difficult to understand. This information includes or relates to figures of past performance. Past performance is not a reliable indicator of future performance. This information may only be distributed or published in countries where such distribution or publication is permitted by applicable law. As stated in the relevant base prospectus, the distribution of the securities mentioned in this information is subject to restrictions in certain jurisdictions. This advertisement may not be reproduced or redistributed without prior permission by Vontobel.
© Bank Vontobel Europe AG and / or affiliated companies. All rights reserved.