A dip in AI, sector rotation, and oil – will money return to technology?

The stock market is currently experiencing its busiest period of the Q3 earnings season. While the S&P 500 index has appeared relatively stable on the surface, an exceptionally strong sector rotation has been occurring place behind the scenes throughout October. On October 22, the NASDAQ fell by approximately 2.9 percent, marking its weakest performance since June. The debt-fueled "neocloud" sector, in particular, has been a cause for concern. This appears to have contributed to a shift in investor positioning toward energy and defensive sectors. Is this a healthy pause or the beginning of the end for the AI trend, and will the money flow back into technology?
Oil and rising interest rates as drivers of sector rotation
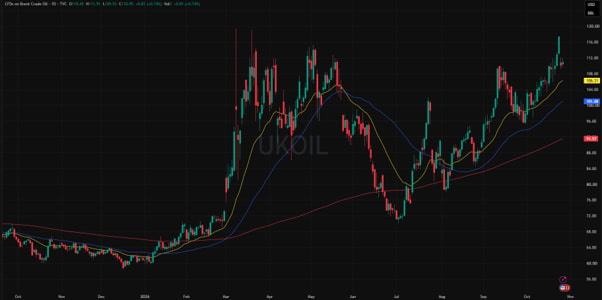
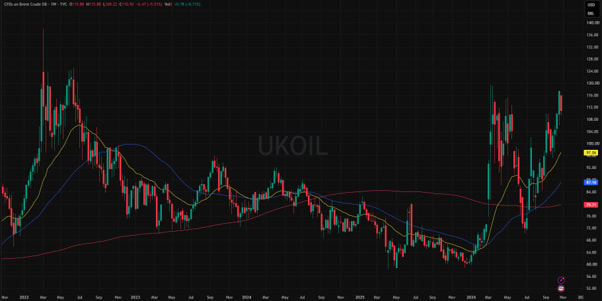
An understanding of the ongoing sector rotation requires an examination of the energy markets. Although a decline was seen early in the week, the price of Brent crude has remained around the $110 level. Last week, the price of Brent climbed close to the highs seen in the spring of 2026. October has indeed been marked by uncertainties surrounding developments in the Middle East and the security of shipping in the Strait of Hormuz.
At the same time, high energy costs are keeping inflationary pressures alive. US inflation stood at 3.7 percent in September, and the market is pricing in a 70–80 percent probability of an interest rate hike by the US Federal Reserve (Fed) in December. With the yield on the 10-year US Treasury bond currently around 5 percent, the present value of future cash flows for highly valued growth companies is declining. Many market participants have interpreted these developments as supportive energy and defensive sectors.
Related Products
BRENT, 1-year chart
BRENT, 5-year chart
The dip in AI stocks – what happened in October?
The sell-off in October hit semiconductors and AI infrastructure particularly hard, with the PHLX Semiconductor Index falling by approximately 15 percent over the course of the month. There are three clear explanations for this downturn.
Pressure from the interest rate environment: Elevated inflation and concerns over rising interest rates have increased the financing costs for heavily indebted AI infrastructure companies.
Financing concerns for "neocloud" companies: Shares in CoreWeave, a leading player in the sector, fell fallen by around 35 percent in October. The yield on the company’s bonds has risen to 15–16 percent, up from an initial issuance rate of 9.6 percent, signaling a clear risk premium. Furthermore, Elon Musk’s warning on October 25, suggesting that more than 200 companies in the sector could collapse or be forced into mergers, has done nothing to improve sentiment toward the industry.
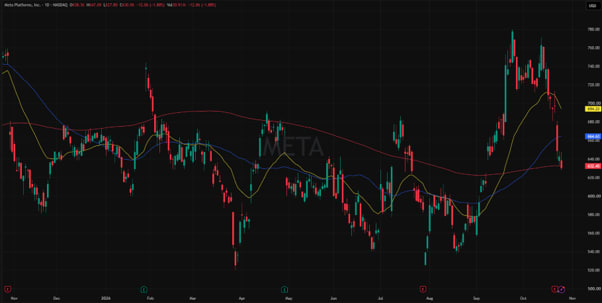
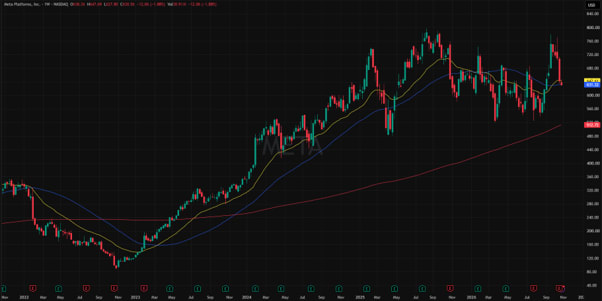
Market reactions to earnings from the giants: Meta’s stock has fallen by around 10 percent following its Q3 earnings report. Although the company’s revenue grew by 26 percent, capital expenditures (CapEx) surged to as much as $34.9 billion, pushing free cash flow into negative territory. With Meta’s full-year investment guidance set at $135–145 billion, investors are demanding clearer evidence of when these investments in artificial intelligence investments will pay off.
End-customer demand, however, has not collapsed. CoreWeave has an order backlog of $104 billion, and cloud software companies have remained stable. Therefore, the issue concerns the sustainability of financial structures above all else, rather than a waning demand for artificial intelligence.
Related Products
META, 1-year chart
META, 5-year chart
Is money flowing back into technology?
The current earnings week is crucial for setting the direction of technology stocks. Microsoft, Alphabet, and Amazon, in particular, are attracting investors' attention.
The following factors suggest a return:
- Trend sustainability: The volatility in October has not altered the broader picture for the year as a whole, the performance of the indices has clearly been positive, despite various corrective moves.
- Letting out the excess air: According to Goldman Sachs, hedge funds have been selling technology stocks at an unprecedented rate in recent weeks. This may indicate that the most speculative capital has been cleared out of these positions.
- Strong earnings growth: Fundamentals support valuations. According to FactSet, Q3 earnings growth for the S&P 500 stands at an impressive 29.0 percent. If the semiconductor index stabilises a bottom and the tech giants demonstrate that their investments are yielding returns, capital could flow back into the sector just as quickly as it left.
On the other hand, these risks argue against a return:
- Interest rate environment: A potential rate hike by the Fed in December, coupled with 5% bond yields, will inevitably impact debt-financed growth. Furthermore, the tightening of financing conditions in the "neocloud" sector keeps risk premiums elevated for those building infrastructure.
- Rising investor expectations: Meta’s share price reaction showed that the market is now focusing on free cash flow and return on investment (ROI) rather than mere revenue. If major cloud companies increase their capital expenditure without providing clear evidence of returns, there may be continued downward pressure on their share prices.
Summary
Higher oil prices may contribute to inflationary pressures and higher interest rates, potentially increasing financing costs for capital-intensive AI infrastructure projects and supporting investor interest in more defensive sectors. The October decline in AI-related stocks does not necessarily indicate a lasting change in the broader theme and may instead reflect a reassessment of valuations and funding risks. Market participants may increasingly differentiate between companies with strong balance sheets and established cash flows and those that are more dependent on external financing.
Indicators shown on the charts:
- SMA200: 200-Day Moving Average, red.
- SMA50: 50-Day Moving Average, blue.
- EMA25: 25-Day Exponential Moving Average, yellow.
Risks
Credit risk of the issuer:
Investors in the products are exposed to the risk that the Issuer or the Guarantor may not be able to meet its obligations under the products. A total loss of the invested capital is possible. The products are not subject to any deposit protection.
Currency risk:
If the product currency differs from the currency of the underlying asset, the value of a product will also depend on the exchange rate between the respective currencies. As a result, the value of a product can fluctuate significantly.
Market risk:
The value of the products can fall significantly below the purchase price due to changes in market factors, especially if the value of the underlying asset falls. The products are not capital-protected
Product costs:
Product and possible financing costs reduce the value of the products.
Risk with leverage products:
Due to the leverage effect, there is an increased risk of loss (risk of total loss) with leverage products, e.g. Bull & Bear Certificates, Warrants and Mini Futures.
External author:
This information is in the sole responsibility of the guest author and does not necessarily represent the opinion of Bank Vontobel Europe AG or any other company of the Vontobel Group. This information is sponsored by Bank Vontobel Europe AG, which may be a counterparty to transactions involving the financial instruments discussed in this information. The further development of the index or a company as well as its share price depends on a large number of company-, group- and sector-specific as well as economic factors. When forming his investment decision, each investor must take into account the risk of price losses. Please note that investing in these products will not generate ongoing income.
The products are not capital protected, in the worst case a total loss of the invested capital is possible. In the event of insolvency of the issuer and the guarantor, the investor bears the risk of a total loss of his investment. In any case, investors should note that past performance and / or analysts' opinions are no adequate indicator of future performance. The performance of the underlyings depends on a variety of economic, entrepreneurial and political factors that should be taken into account in the formation of a market expectation.
Disclaimer:
This information is neither an investment advice nor an investment or investment strategy recommendation, but advertisement. The complete information on the products (securities) mentioned herein, in particular the structure and risks associated with an investment, are described in the base prospectus, together with any supplements, as well as the final terms relating to the securities. The base prospectus and final terms constitute the solely binding sales documents for the products mentioned herein. It is recommended that potential investors read these documents before making any investment decision. The documents and the key information document are published on the website of the issuer, Vontobel Financial Products GmbH, Bockenheimer Landstrasse 24, 60323 Frankfurt am Main, Germany, on https://prospectus.vontobel.com and are available from the issuer free of charge. The approval of the prospectus should not be understood as an endorsement of the securities. The securities are products that are not simple and may be difficult to understand. This information includes or relates to figures of past performance. Past performance is not a reliable indicator of future performance. This information may only be distributed or published in countries where such distribution or publication is permitted by applicable law. As stated in the relevant base prospectus, the distribution of the securities mentioned in this information is subject to restrictions in certain jurisdictions. This advertisement may not be reproduced or redistributed without prior permission by Vontobel.
© Bank Vontobel Europe AG and / or affiliated companies. All rights reserved.