The AI theme is supporting the markets

After last week’s brief market volatility, triggered by the Federal Reserve’s 0.25 percentage point rate hike and hawkish messaging, stock markets have shown remarkable resilience. Investor attention has shifted back to the market's strongest performers, specifically the AI and semiconductor sectors, which have once again propelled US indices close to all-time highs. Meanwhile, falling oil prices and stabilizing conditions in the bond market are providing the stock market with some much-needed breathing room.
AI and semiconductors at the forefront again
Looking at the various sectors, capital has flowed back particularly into the technology sector (XLK) and semiconductors (SMH). Recent gains in the technology sector have been supported by semiconductor manufacturing companies, such as Nvidia, AMD, and many others, which have performed wellover the past week and the beginning of this week.
Compared to many other sectors, the difference is clear. Many other sectors (such as XLE, XLU, XLB, XLP) are actually in a clear downtrend. This means that the indices are currently largely driven by the technology and semiconductor sectors alone.
However, elevated interest rates could increase financing costs for companies investing heavily in data centres and artificial intelligence. Conversely, many companies in the sector have virtually full order books, and the outlook for the remainder of the year and beyond is positive. Consequently, companies that have underperformed relative to industry leaders may find themselves under particular pressure in the current higher interest rate environment.
XLK, 5-year chart

XLK, 1-year chart

SMH, 5-year chart

SMH, 1-year chart

The pullback in oil prices is boosting stocks.
Another key factor supporting the stock market is the drop in crude oil prices. Brent crude, which had previously traded at around $110 per barrel, has fallen to closer to $100. This has given the stock market with at least a temporary reprieve while also easing inflation expectations for the autumn.
Falling energy prices play a particularly significant role in industry-heavy Europe. However, a sharp rise in energy prices could quickly have a negative impact on global stock markets.
Related Products
BRENT, 5-year chart
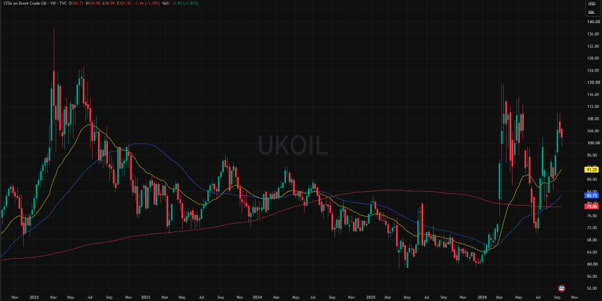
BRENT, 1-year chart

S&P 500 and NASDAQ surging
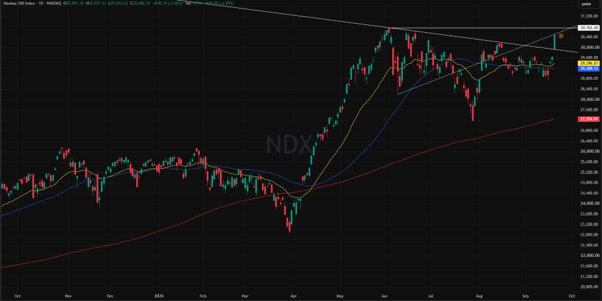
In the United States, the S&P 500 and NASDAQ indices have performed strongly following the Fed's interest rate decision and press conference last week. Both indices have risen close to their previous all-time highs.
The key driving forces behind this have been, in particular, the strong upward momentum in the technology and semiconductor sectors, the drop in oil prices, and a moderate decline and subsequent stabilization of bond yields. If the upward momentum in these sectors begins to fade, or if energy prices and interest rates turn upward again, the indices could face significant headwinds.
Related Products
S&P 500, 5-year chart

S&P 500, 1-year chart

Related Products
NASDAQ, 5-year chart

NASDAQ, 1-year chart
Summary
Following concerns over interest rates, investor confidence in the staying power of the AI theme has turned the stock market’s direction around. While the tight interest rate stance of central banks and oil prices hovering near $100 conitnue to pose macroeconomic risks present, the earnings power of tech giants and investments in AI are currently acting as the market's strongest drivers.
Indicators shown on the charts:
- SMA200: 200-Day Moving Average, red.
- SMA50: 50-Day Moving Average, blue.
- EMA25: 25-Day Exponential Moving Average, yellow.
Risks
Credit risk of the issuer:
Investors in the products are exposed to the risk that the Issuer or the Guarantor may not be able to meet its obligations under the products. A total loss of the invested capital is possible. The products are not subject to any deposit protection.
Currency risk:
If the product currency differs from the currency of the underlying asset, the value of a product will also depend on the exchange rate between the respective currencies. As a result, the value of a product can fluctuate significantly.
Market risk:
The value of the products can fall significantly below the purchase price due to changes in market factors, especially if the value of the underlying asset falls. The products are not capital-protected
Product costs:
Product and possible financing costs reduce the value of the products.
Risk with leverage products:
Due to the leverage effect, there is an increased risk of loss (risk of total loss) with leverage products, e.g. Bull & Bear Certificates, Warrants and Mini Futures.
External author:
This information is in the sole responsibility of the guest author and does not necessarily represent the opinion of Bank Vontobel Europe AG or any other company of the Vontobel Group. This information is sponsored by Bank Vontobel Europe AG, which may be a counterparty to transactions involving the financial instruments discussed in this information. The further development of the index or a company as well as its share price depends on a large number of company-, group- and sector-specific as well as economic factors. When forming his investment decision, each investor must take into account the risk of price losses. Please note that investing in these products will not generate ongoing income.
The products are not capital protected, in the worst case a total loss of the invested capital is possible. In the event of insolvency of the issuer and the guarantor, the investor bears the risk of a total loss of his investment. In any case, investors should note that past performance and / or analysts' opinions are no adequate indicator of future performance. The performance of the underlyings depends on a variety of economic, entrepreneurial and political factors that should be taken into account in the formation of a market expectation.
Disclaimer:
This information is neither an investment advice nor an investment or investment strategy recommendation, but advertisement. The complete information on the products (securities) mentioned herein, in particular the structure and risks associated with an investment, are described in the base prospectus, together with any supplements, as well as the final terms relating to the securities. The base prospectus and final terms constitute the solely binding sales documents for the products mentioned herein. It is recommended that potential investors read these documents before making any investment decision. The documents and the key information document are published on the website of the issuer, Vontobel Financial Products GmbH, Bockenheimer Landstrasse 24, 60323 Frankfurt am Main, Germany, on https://prospectus.vontobel.com and are available from the issuer free of charge. The approval of the prospectus should not be understood as an endorsement of the securities. The securities are products that are not simple and may be difficult to understand. This information includes or relates to figures of past performance. Past performance is not a reliable indicator of future performance. This information may only be distributed or published in countries where such distribution or publication is permitted by applicable law. As stated in the relevant base prospectus, the distribution of the securities mentioned in this information is subject to restrictions in certain jurisdictions. This advertisement may not be reproduced or redistributed without prior permission by Vontobel.
© Bank Vontobel Europe AG and / or affiliated companies. All rights reserved.