Fed's interest rate decision in the spotlight

US and European stock indices are showing signs of uncertainty as investors, await the US Federal Reserve's (Fed) interest rate decision, which is expected on Wednesday evening (September 16). Meanwhile, markets are navigating conflicting forces of the European Central Bank’s (ECB) recent interest rate decision and inflationary pressures stemming from energy markets.
Interest rate hike expected
Markets expect the Fed to implement a 0.25 percentage point (25 basis point) increase at Wednesday's meeting. Interest rates have remained unchanged for a long time, and this increase would bring the benchmark rate to the 4%.
Inflation has remained stubbornly high for a prolonged period, a trend also reflected in the US inflation figures for August, which were released last week. CPI data published on Friday, September 11, showed that consumer price inflation had held steady at 3.4 percent (year-on-year). Producer price index (PPI) figures released earlier that same week also showed signs of acceleration; the year-on-year PPI exceeded expectations, rising to 5.4 percent against a forecast of 5.3 percent.
One of the main causes of ongoing inflation has been the sharp rise in energy prices, influenced by the escalating situation in the Middle East and the Strait of Hormuz.
Following the interest rate decision, comments by Fed Kevin Warsh and the central bank's outlook will also emerge as key themes.
S&P 500
In the United States, the S&P 500 index has been in a moderate downtrend for around a month. The decline from the index's all-time high (ATH) is approximately 2–3 per cent, significantly less than the drop seen in Europe, for instance, with indices such as the DAX. Examining the one-year chart (daily candles), it can be seen that the index dipped briefly below the key 50-day simple moving average (SMA50, shown in blue) and previous highs at the $7,620 level last week. However, it recovered above these points by Friday. If the price falls below these levels again, this could be interpreted as a sign of weakening momentum from a technical analysis perspective.
Related Products
S&P 500, 5-year chart

S&P 500, 1-year chart

ECB raised interest rates – What is the direction of the DAX index?
In Europe, investors are still coming to terms with the ECB's decision last week (September 10) to raise its key interest rate to 2.50 per cent.
Inflation has also remained persistent in Europe. In August, the inflation rate for the euro area in August was 3.3 percent (year-on-year). The conflict in the Middle East and rising energy prices having a direct impact on Europe, with energy inflation alone also reaching 14.3 percent - the highest figure since January 2023.
Elevated inflation and energy prices are having a significant impact, particularly on German industry and price movements within the DAX index in particular. The index has fallen by around 4% from its all-time high (ATH); and a one-year chart showing daily candles reveals that the price has slipped below the shorter-term moving averages (EMA25 in yellow and SMA50 in blue). From a technical analysis perspective, this is considered a bearish signal. However, the price has found temporary support near the 25,500 level, corresponding to previous highs. A decisive break below this level would further weaken the index's technical outlook. The one-year chart (daily candles) also highlights the important SMA200 moving average, which is currently around 3 percent away.
Related Products
DAX, 5-year chart
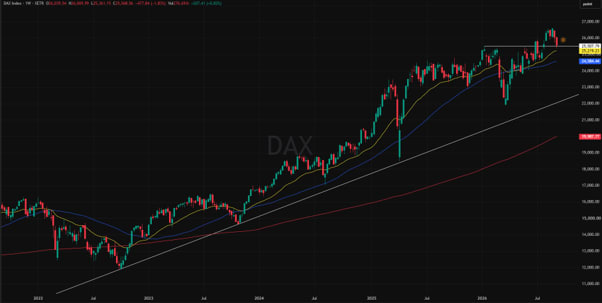
DAX, 1-year chart

Oil price hovering around $110
Regarding inflation and central bank decisions, it is also essential to highlight the trend in oil prices, which have risen significantly as the conflict in the Middle East continues.
Brent crude oil has risen by nearly 20 percent during September 2026 alone. At the beginning of September, the price was hovering around $90 per barrel, whereas now, in mid-September, it is close to the $110 level. The price of oil has returned to the levels seen in the spring of 2026.
From a technical perspective, a very strong upward trend is evident in oil prices, with no sustained downward corrections observed, aside from a few days. If the price continues to rise at the same pace, this is a factor worth noting regarding future inflation figures and central bank interest rate policies.
Related Products
BRENT, 5-year chart
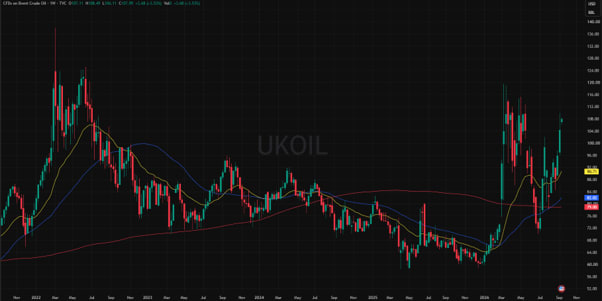
BRENT, 1-year chart

Summary
An interesting week lies ahead for the markets. The Fed’s interest rate decision and the subsequent press conference could trigger significant market volatility. Investors should be prepared for increased price fluctuations and closely monitor energy price trends throughout the week.
Indicators shown on the charts:
- SMA200: 200-Day Moving Average, red.
- SMA50: 50-Day Moving Average, blue.
- EMA25: 25-Day Exponential Moving Average, yellow.
Risks
Credit risk of the issuer:
Investors in the products are exposed to the risk that the Issuer or the Guarantor may not be able to meet its obligations under the products. A total loss of the invested capital is possible. The products are not subject to any deposit protection.
Currency risk:
If the product currency differs from the currency of the underlying asset, the value of a product will also depend on the exchange rate between the respective currencies. As a result, the value of a product can fluctuate significantly.
Market risk:
The value of the products can fall significantly below the purchase price due to changes in market factors, especially if the value of the underlying asset falls. The products are not capital-protected
Product costs:
Product and possible financing costs reduce the value of the products.
Risk with leverage products:
Due to the leverage effect, there is an increased risk of loss (risk of total loss) with leverage products, e.g. Bull & Bear Certificates, Warrants and Mini Futures.
External author:
This information is in the sole responsibility of the guest author and does not necessarily represent the opinion of Bank Vontobel Europe AG or any other company of the Vontobel Group. This information is sponsored by Bank Vontobel Europe AG, which may be a counterparty to transactions involving the financial instruments discussed in this information. The further development of the index or a company as well as its share price depends on a large number of company-, group- and sector-specific as well as economic factors. When forming his investment decision, each investor must take into account the risk of price losses. Please note that investing in these products will not generate ongoing income.
The products are not capital protected, in the worst case a total loss of the invested capital is possible. In the event of insolvency of the issuer and the guarantor, the investor bears the risk of a total loss of his investment. In any case, investors should note that past performance and / or analysts' opinions are no adequate indicator of future performance. The performance of the underlyings depends on a variety of economic, entrepreneurial and political factors that should be taken into account in the formation of a market expectation.
Disclaimer:
This information is neither an investment advice nor an investment or investment strategy recommendation, but advertisement. The complete information on the products (securities) mentioned herein, in particular the structure and risks associated with an investment, are described in the base prospectus, together with any supplements, as well as the final terms relating to the securities. The base prospectus and final terms constitute the solely binding sales documents for the products mentioned herein. It is recommended that potential investors read these documents before making any investment decision. The documents and the key information document are published on the website of the issuer, Vontobel Financial Products GmbH, Bockenheimer Landstrasse 24, 60323 Frankfurt am Main, Germany, on https://prospectus.vontobel.com and are available from the issuer free of charge. The approval of the prospectus should not be understood as an endorsement of the securities. The securities are products that are not simple and may be difficult to understand. This information includes or relates to figures of past performance. Past performance is not a reliable indicator of future performance. This information may only be distributed or published in countries where such distribution or publication is permitted by applicable law. As stated in the relevant base prospectus, the distribution of the securities mentioned in this information is subject to restrictions in certain jurisdictions. This advertisement may not be reproduced or redistributed without prior permission by Vontobel.
© Bank Vontobel Europe AG and / or affiliated companies. All rights reserved.