Focus on US CPI inflation


In the current inflationary climate, soft commodities may provide investors with a hedge against falling equities and bond values. This is because food prices tend to rise when the cost of agricultural inputs, such as diesel and fertiliser, increases. The most important macroeconomic data this week will be the US consumer price index for August, which is due to be released on Friday 11 September, after the publication of robust US nonfarm payroll figures on Friday 4 September.
Case of the week: Is Cocoa's pullback a sweet opportunity?
Inflation concerns are resurfacing. Bond yields are rising in several regions, and the conflict between the US and Iran is exacerbating energy market risks and reinforcing expectations of sustained higher inflation. Meanwhile, Ukraine’s increasingly frequent attacks on Russian energy infrastructure are putting further pressure on the global energy supply.
Over the summer, equity markets largely shrugged off higher interest rates and continued to advance. However, rising energy and transport costs remain a clear risk to inflation. In this environment, soft commodities may offer investors some protection. Food prices tend to rise when the cost of agricultural inputs, such as diesel and fertiliser, increases, while supply is relatively inelastic in the short term. Therefore, during geopolitical or weather-related supply shocks, the price of soft commodities can rise even when equities and bonds are under pressure. However, commodities are not a straightforward inflation hedge. Individual markets are highly volatile and can fluctuate significantly for reasons unrelated to the broader price level.
Cocoa catches a weather bid
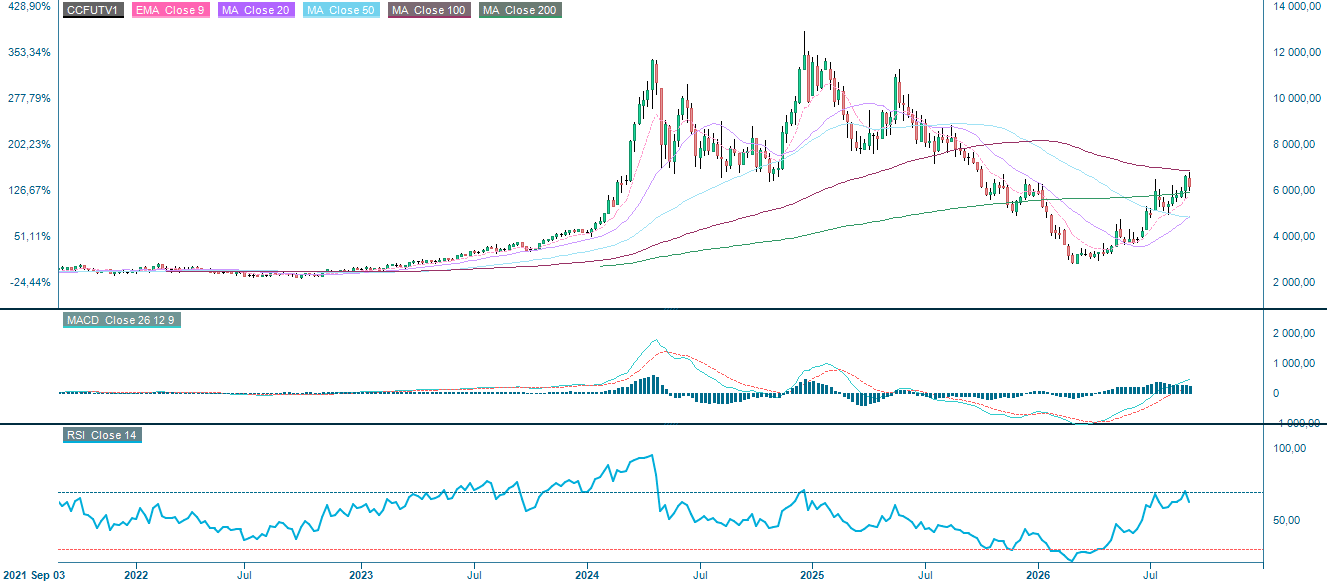
Cocoa prices have roughly doubled since the spring lows. Heavy rainfall and flooding in Côte d’Ivoire and Ghana have raised concerns about damaged trees and disrupted farms, and the spread of black pod disease. Traders are also increasingly factoring in the risk of a strong El Niño event, which could lead to drier conditions and delayed rainfall to West Africa. The region accounts for around two-thirds of global cocoa production, meaning that weather expectations there significantly influence on futures prices. Further momentum was added by extensive short covering after the sharp price drop at the beginning of 2026.
Although supply is improving, risks remain
The price of cocoa has recently fallen. According to Trading Economics, by 30 August, farmers in Côte d’Ivoire had shipped 2.14 million tonnes of cocoa to ports, which is 19% more than during the same period the previous year. Meanwhile, exchange inventories have also risen, with ICE-monitored cocoa stocks reaching approximately 3.41 million bags — the highest level in two years.
Nevertheless, the risk of adverse weather is far from over. The World Meteorological Organization recently stated that there was an 'exceptionally high likelihood of nearly 100%' that El Niño would persist until February 2027. Cocoa production is labour-intensive, but higher fuel and fertiliser costs could put further upward pressure on prices. Although the recent pullback may present an attractive entry point, cocoa remains a high volatile market, with prices driven by weather, supply data and positioning.
Related Products
Cocoa futures (in USD/MT), one-year daily chart

Cocoa futures (in USD/MT), five-year weekly chart
Macro comments
Tensions between Iran and the US escalated last week. Over the last week, the price of Brent crude oil increased by almost 4%, reaching $98 per barrel at the time of writing, and by 20% over the last month. Meanwhile, interest rates around the world continued to rise. However, since reaching its latest peak on 13 August, the S&P 500 index has only declined by just 1%.
On Friday 4 September, US non-farm payrolls came in at 162,000, compared to an expected figure of 55,000. This strong employment figure has heightened market concerns about a potential interest rate hike by the Fed. The market is now awaiting this week's crucial inflation data in the form of the US Consumer Price Index for August (see the five-year monthly graph below).
Prior to the release of US jobs data on Friday, the probability of a Federal Reserve interest rate hike by the Federal Reserve at its upcoming policy meeting on 16 September was 54%. This figure then rose momentarily to 62%. Meanwhile, the US dollar strengthened, and the stock market fell slightly. By Monday morning, 7 September, the likelihood of a US interest rate increase at the next Federal Reserve meeting had fallen to 60%.
Calendar
On Wednesday, 9 September, an interim report from the Spanish retail company Inditex. At 19:00 CET is expected, Apple will hold its annual product launch event. In terms of macroeconomic news, the day will begin with the release of China’s consumer and producer price indices for August. The US Department of Energy's weekly oil inventory data will also be received this week.
The release of macroeconomic data begins on Thursday, 10 September, with the publication of the Consumer Price Indices for August in Germany and Norway. Sweden’s GDP, industrial orders and household consumption figures for July are also expected to be released at the same time. OPEC will publish its monthly oil report, and the ECB will announce its interest rate decision. Next, turning to the US, where data on weekly jobless claims, existing home sales, the producer price index for August and wholesale inventories for July will be released.
The release of macroeconomic statistics will begin on Friday 11 September with Japan's producer price index for August. This will be followed by the UK's GDP and industrial production figures for July. The IEA will then publish its monthly oil market report, after which the most important figure of the week will be released: the US consumer price index for August. The day will end with the release of the Michigan index for September, also from the US.
US Consumer Price Index: year-on-year percentage change, monthly, five-year chart

Could the OMXS30 reach its previous high?
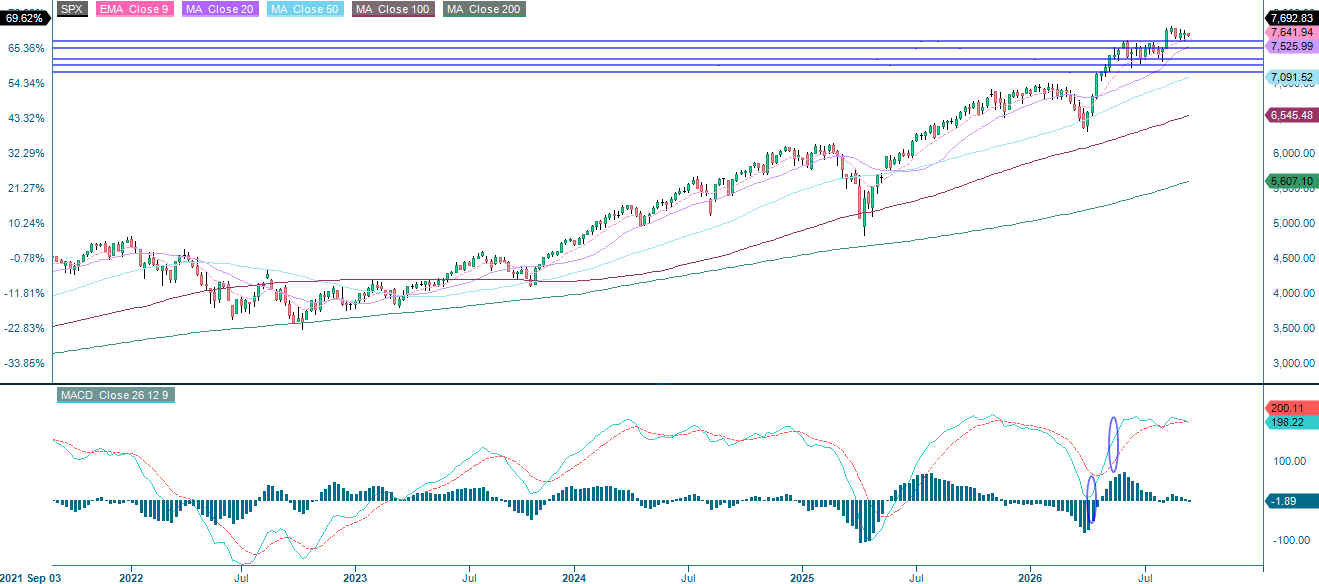
The S&P 500 is consolidating and continues to struggle to find direction. Support is found around 7,600 on the downside, while resistance lies between 7,750 and 7,800. Although the MACD remains positive, it is signalling fading momentum, suggesting that the balance of risks is tilted to the downside. Breaking below 7,600 could open the way to the next support zone, which lies between 7,480 and 7,500.
Related Products
S&P500 (in USD), one-year daily chart

S&P500 (in USD), five-year weekly chart
The Nasdaq-100 is also consolidating but is currently approaching the upper resistance level of around 29,565. Breaking above this level could pave the way to the next resistance level, which is around 30,200.
Related Products
Nasdaq 100 (in USD), one-year daily chart

Nasdaq 100 (in USD), five-year weekly chart

As the chart below shows, the OMXS30 bounced convincingly off its MA50 yesterday and closed well above its MA20. The index now appears ready to revisit its previous high of around 3,330. However, although the MACD remains positive, it is also signalling fading momentum.
OMX30 (in SEK), one-year daily chart

OMX30 (in SEK), five-year weekly chart

The German DAX, on the other hand, looks less bullish. Momentum is fading and the index is currently testing the support level between its MA50 and 25,900. Breaking below the MA50 could open the way to the next support level at 25,390.
Related Products
DAX (in EUR), one-year daily chart

DAX (in EUR), five-year weekly chart

The full name for abbreviations used in the previous text:
EMA 9: 9-day exponential moving average
Fibonacci: There are several Fibonacci lines used in technical analysis. Fibonacci numbers are a sequence in which each successive number is the sum of the two previous numbers.
MA20: 20-day moving average
MA50: 50-day moving average
MA100: 100-day moving average
MA200: 200-day moving average
MACD: Moving average convergence divergence
Risks
Credit risk of the issuer:
Investors in the products are exposed to the risk that the Issuer or the Guarantor may not be able to meet its obligations under the products. A total loss of the invested capital is possible. The products are not subject to any deposit protection.
Currency risk:
If the product currency differs from the currency of the underlying asset, the value of a product will also depend on the exchange rate between the respective currencies. As a result, the value of a product can fluctuate significantly.
Market risk:
The value of the products can fall significantly below the purchase price due to changes in market factors, especially if the value of the underlying asset falls. The products are not capital-protected
Product costs:
Product and possible financing costs reduce the value of the products.
Risk with leverage products:
Due to the leverage effect, there is an increased risk of loss (risk of total loss) with leverage products, e.g. Bull & Bear Certificates, Warrants and Mini Futures.
External author:
This information is in the sole responsibility of the guest author and does not necessarily represent the opinion of Bank Vontobel Europe AG or any other company of the Vontobel Group. This information is sponsored by Bank Vontobel Europe AG, which may be a counterparty to transactions involving the financial instruments discussed in this information. The further development of the index or a company as well as its share price depends on a large number of company-, group- and sector-specific as well as economic factors. When forming his investment decision, each investor must take into account the risk of price losses. Please note that investing in these products will not generate ongoing income.
The products are not capital protected, in the worst case a total loss of the invested capital is possible. In the event of insolvency of the issuer and the guarantor, the investor bears the risk of a total loss of his investment. In any case, investors should note that past performance and / or analysts' opinions are no adequate indicator of future performance. The performance of the underlyings depends on a variety of economic, entrepreneurial and political factors that should be taken into account in the formation of a market expectation.
Disclaimer:
This information is neither an investment advice nor an investment or investment strategy recommendation, but advertisement. The complete information on the products (securities) mentioned herein, in particular the structure and risks associated with an investment, are described in the base prospectus, together with any supplements, as well as the final terms relating to the securities. The base prospectus and final terms constitute the solely binding sales documents for the products mentioned herein. It is recommended that potential investors read these documents before making any investment decision. The documents and the key information document are published on the website of the issuer, Vontobel Financial Products GmbH, Bockenheimer Landstrasse 24, 60323 Frankfurt am Main, Germany, on https://prospectus.vontobel.com and are available from the issuer free of charge. The approval of the prospectus should not be understood as an endorsement of the securities. The securities are products that are not simple and may be difficult to understand. This information includes or relates to figures of past performance. Past performance is not a reliable indicator of future performance. This information may only be distributed or published in countries where such distribution or publication is permitted by applicable law. As stated in the relevant base prospectus, the distribution of the securities mentioned in this information is subject to restrictions in certain jurisdictions. This advertisement may not be reproduced or redistributed without prior permission by Vontobel.
© Bank Vontobel Europe AG and / or affiliated companies. All rights reserved.