Good start to Q3 earnings season may not be enough for S&P500


In an increasingly uncertain world situation, with the war between Israel and Hamas still in its infancy, the USD and gold may continue to benefit as safe havens. The Q3 2023 reporting season has got off to a good start in the US, with results from the major banks coming in well ahead of expectations.
Case of the week: Gold and USD benefit in uncertain times
So far, the war between Israel and Hamas has had less of an impact on stock markets than the war in Ukraine about a year and a half ago. While the Gaza conflict is smaller, it could escalate and draw in several oil-producing countries.
Compared with Russia's invasion of Ukraine in February 2022, the financial markets have taken a much cooler view of the Israeli-Hamas conflict that began on 7 October 2023. The Israel-Hamas war is smaller than in Ukraine. Furthermore, the two sides have very different military strengths, where Israel is much stronger than Hamas. However, the war has only begun and has the potential to escalate. The most likely scenario is that Iran, which helped plan the Hamas attack this time, will face further sanctions from the US and its western allies. This would reverse the recent trend of easing tensions between the US and Iran. Also in the background is Russia, which is benefiting from that the US has shifted its focus to the Middle East. Market participants believe that the escalation of the Israeli-Hamas conflict threatens to push up oil prices, undermine central banks' efforts to control inflation and, therefore, depress equity prices. Such a scenario could also increase investor appetite for safe-haven assets such as the US dollar and gold. In a worst-case scenario, a prolonged war could lead to a third wave of global inflation.
In terms of the impact of the conflict on global markets, the movements in oil and equity prices have attracted the most attention. The current consensus among market participants is that the impact on oil prices will depend on the scale and duration of the conflict, whether it spreads to the wider Middle East region, in particular the reaction of major oil producing countries such as Saudi Arabia and Iran. In terms of share prices, the conflict has already to a minor extent affected market sentiment on equity prices negatively.
At the same time as risk assets have suffered, increased demand for risk aversion is driving investors into gold, the US-dollar, and other safe-haven assets.
Since the start of trading on 9 October 2023, the US dollar has generally strengthened against most major currencies. The price of gold, which also has hedging properties, has jumped. This period of conflict is a good example of why investors should hold gold in their portfolios, as it is a good hedge against international turmoil. Similarly, the US-dollar tends to strengthen in such circumstances.
The US dollar index has risen 6.3% since 18 July 2023. In the past, the US-dollar's rise has prompted investors to bet on whether several Asian economies, including Japan, will intervene in the currency market. The current instability in the Middle East could lead to a further rise in the US dollar and speculation in the European market as to whether the euro could fall back to parity with the USD.
The price of gold, another safe-haven asset, is also benefiting from the escalation of the Israeli-Hamas conflict. The gold price rose by 5.35% to $1,945.9 USD per ounce, following last week's market events. Since then, the gold price has retreated somewhat to $1,924 USD per ounce. With the consumer confidence index coming in much lower than expected, coupled with the escalation of the Israeli-Hamas conflict, we believe that the gold price could continue to rise in the short term. Long-term, the future direction of the gold price will continue to be influenced by Federal Reserve policy. Federal Reserve Governor Michelle Bowman has said that US inflation is still too high and that further monetary tightening may be needed. Higher interest rates are generally negative for the gold price.
Gold (USD/Ounce), one-year daily chart

Gold (USD/Ounce), five-year weekly chart

Macro comments
US equity markets were weak on Friday 13 October, but share price movements were small after European markets closed. Geopolitical concerns dominated the markets ahead of the weekend and both the oil price (+5%) and the gold price (+3%) rose sharply on Friday evening as the market feared that the Israel-Hamas conflict could spread and affect production in the region. The Michigan index, which measures consumer sentiment in the United States, came in lower than expected, but inflation expectations rose from the previous month's survey.
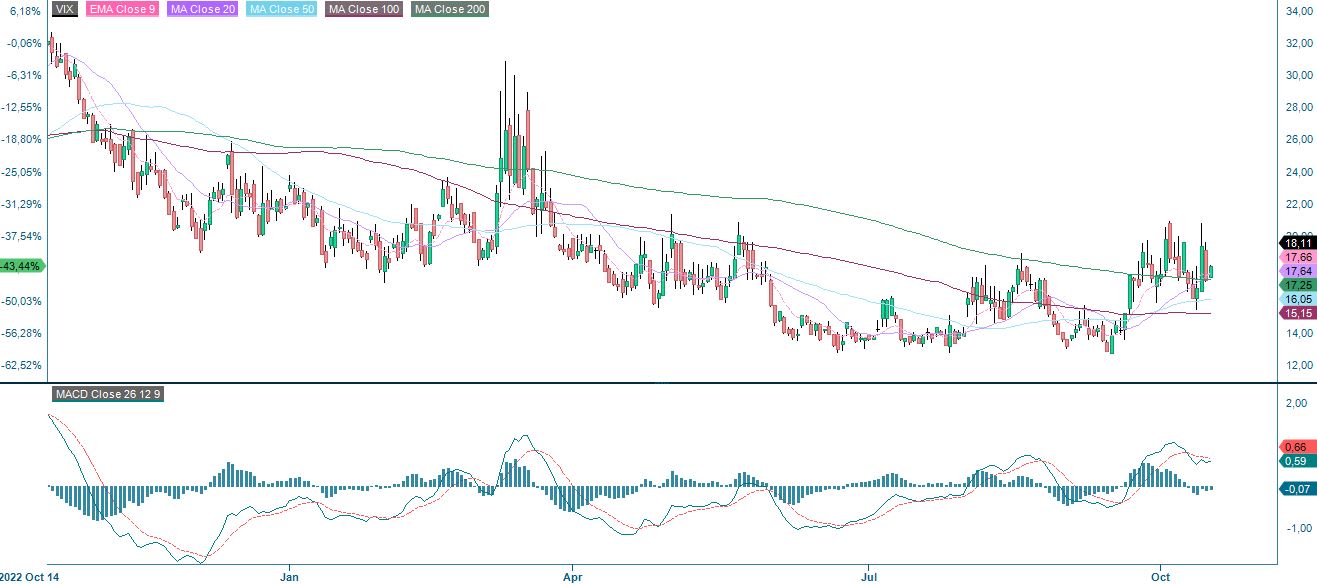
The US volatility index VIX has risen from an extremely low level in the first half of September 2023. The war in the Middle East has obviously contributed to this, but so have fears of a new wave of inflation because of higher oil prices have had limited impact.
VIX (in USD), one-year daily chart
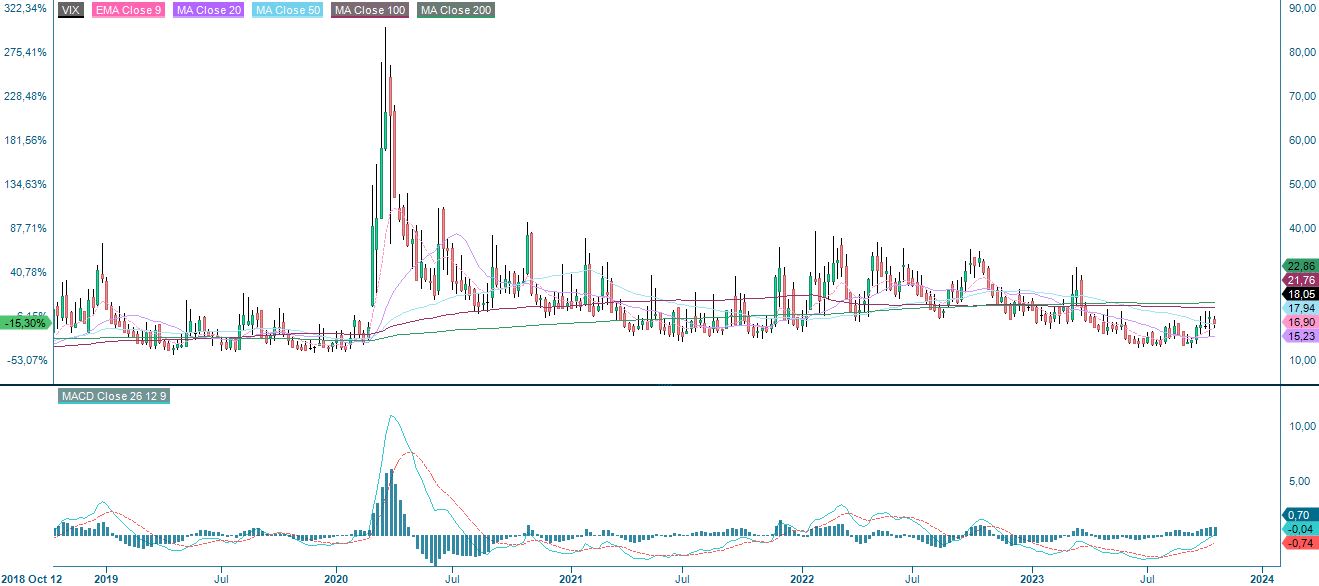
From a five-year perspective, today's rise is limited, especially compared to the peak seen during the outbreak of the Covid pandemic in March 2020.
VIX (in USD), weekly five-year chart
As of Friday 13 October, around 30 S&P500 companies, representing six out of eleven sectors, have reported their third quarter results. 84% of S&P companies have reported a positive EPS surprise, while 66% have reported a positive revenue surprise. So far, the S&P 500 universe has reported earning per share (EPS) growth of 0.4% and revenue growth of 1.9% for the third quarter 2023.
The three major banks (Citigroup, JP Morgan, and Wells Fargo) that reported on Friday 13 October all beat the market's earnings estimates by between 11% and 21% (see list of reporting companies below).
This week 55 S&P companies will report their Q3 2023 results. Morgan Stanley, Netflix, Procter & Gamble and Tesla will release their Q3 results today, Wednesday 18 October. On Thursday 19 October AT&T, Blackstone, Philip Morris, and Union Pacific’s Q3 reports are due. On Friday 20 October there will be Q3 reports from American Express and Schlumberger.
Will the earnings season provide enough energy for the S&P500?
After a nice bounce last week, S&P 500 is currently consolidating close to resistance. MACD has recently generated a soft buy signal and EMA9 has turned upwards. Thus, in case of a break to the upside, the next level is found around 4,450.
S&P 500 (in USD), one-year daily chart

S&P 500 (in USD), weekly five-year chart

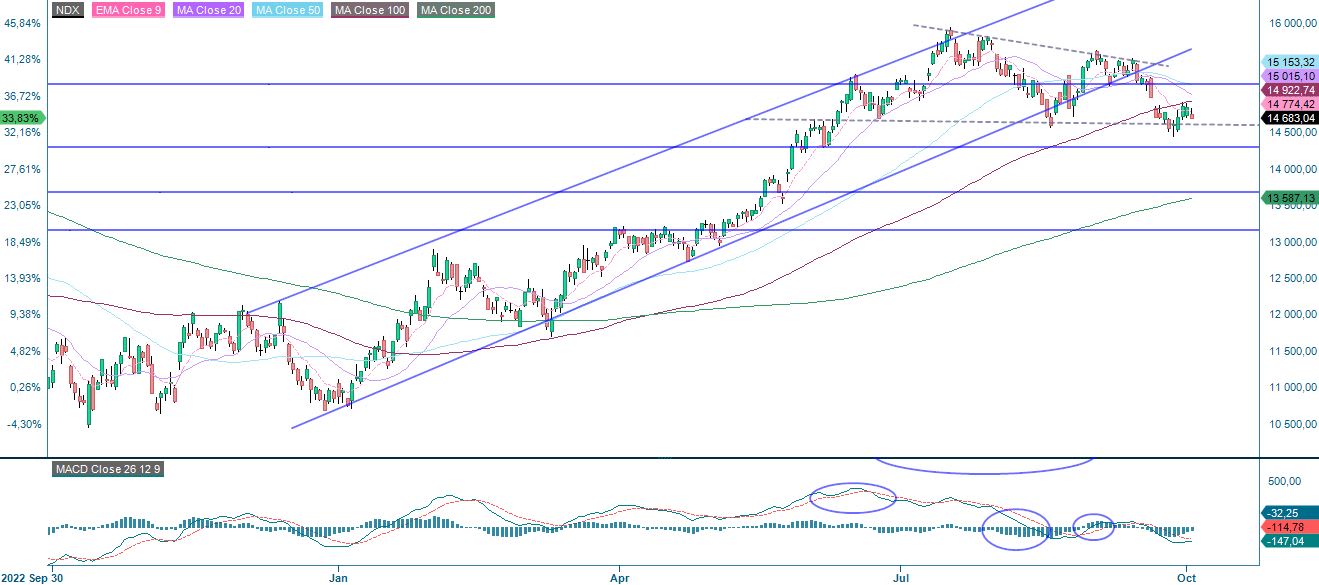
Nasdaq 100 is also stuck at resistance, as illustrated in the chart below. MACD has generated a buy-signal. A breakout from the descending wedge-formation is bullish with a target level around 16,000.
Relaterede produkter
Nasdaq 100 (in USD), one-year daily chart
Nasdaq 100 (in USD), weekly five-year chart

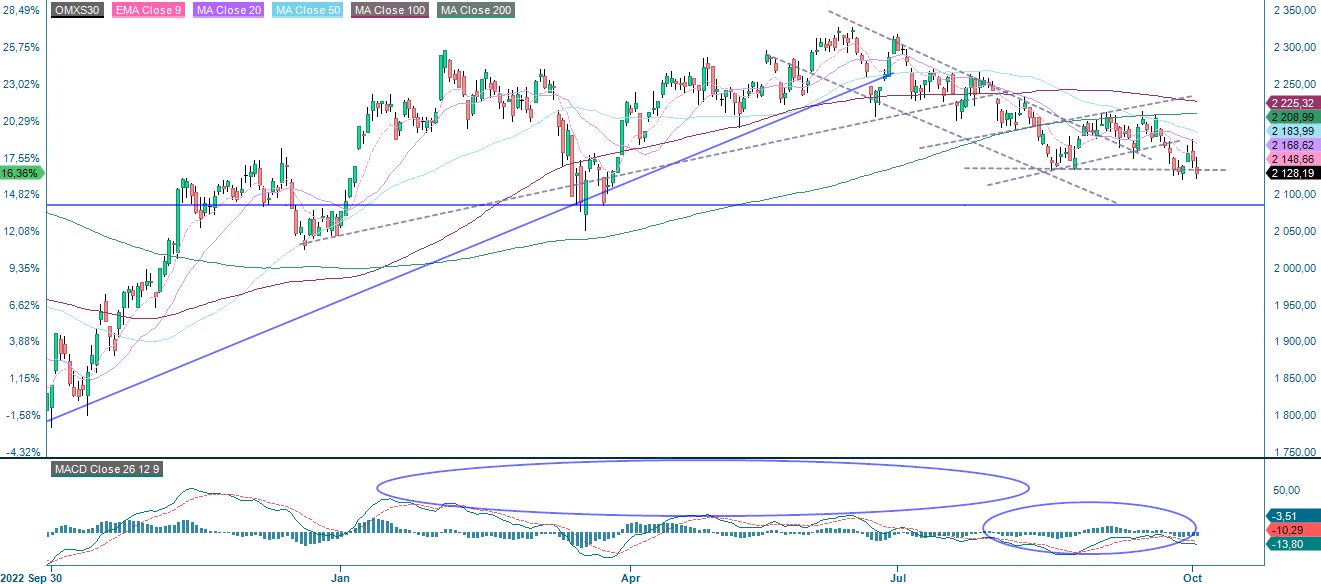
OMXS30 has turned south and is currently trading close to support made up by MA20at 2,160. In case of a break to the downside, the index may be headed down back towards 2,130.
OMXS30 (in SEK), one-year daily chart
OMXS30 (in SEK), weekly five-year chart

DAX has also turned south during the last days. The next level on the downside is found around 15,000.
DAX (in EUR), one-year daily chart

DAX (in EUR), weekly five-year chart

The full name for abbreviations used in the previous text:
EMA 9: 9-day exponential moving average
Fibonacci: There are several Fibonacci lines used in technical analysis. Fibonacci numbers are a sequence in which each successive number is the sum of the two previous numbers.
MA20: 20-day moving average
MA50: 50-day moving average
MA100: 100-day moving average
MA200: 200-day moving average
MACD: Moving average convergence divergence
Risici
External author:
This information is in the sole responsibility of the guest author and does not necessarily represent the opinion of Bank Vontobel Europe AG or any other company of the Vontobel Group. The further development of the index or a company as well as its share price depends on a large number of company-, group- and sector-specific as well as economic factors. When forming his investment decision, each investor must take into account the risk of price losses. Please note that investing in these products will not generate ongoing income.
The products are not capital protected, in the worst case a total loss of the invested capital is possible. In the event of insolvency of the issuer and the guarantor, the investor bears the risk of a total loss of his investment. In any case, investors should note that past performance and / or analysts' opinions are no adequate indicator of future performance. The performance of the underlyings depends on a variety of economic, entrepreneurial and political factors that should be taken into account in the formation of a market expectation.
Disclaimer:
This information is neither an investment advice nor an investment or investment strategy recommendation, but advertisement. The complete information on the trading products (securities) mentioned herein, in particular the structure and risks associated with an investment, are described in the base prospectus, together with any supplements, as well as the final terms. The base prospectus and final terms constitute the solely binding sales documents for the securities and are available under the product links. It is recommended that potential investors read these documents before making any investment decision. The documents and the key information document are published on the website of the issuer, Vontobel Financial Products GmbH, Bockenheimer Landstrasse 24, 60323 Frankfurt am Main, Germany, on prospectus.vontobel.com and are available from the issuer free of charge. The approval of the prospectus should not be understood as an endorsement of the securities. The securities are products that are not simple and may be difficult to understand. This information includes or relates to figures of past performance. Past performance is not a reliable indicator of future performance.
© Bank Vontobel Europe AG and/or its affiliates. All rights reserved.