Catching up for the next consumer credit cycle


This week's case is Paypal, which reported Q2 results in line with expectations, but saw its share price fall by 12% the day after the report. The fact that we are entering a recession seems well discounted in Paypal's depressed share price. Meanwhile, interest rates have risen despite falling inflation figures. Technical analysis of equity indices continues to show bearish signs.
Case of the week: Paypal stock may have taken too much of a beating
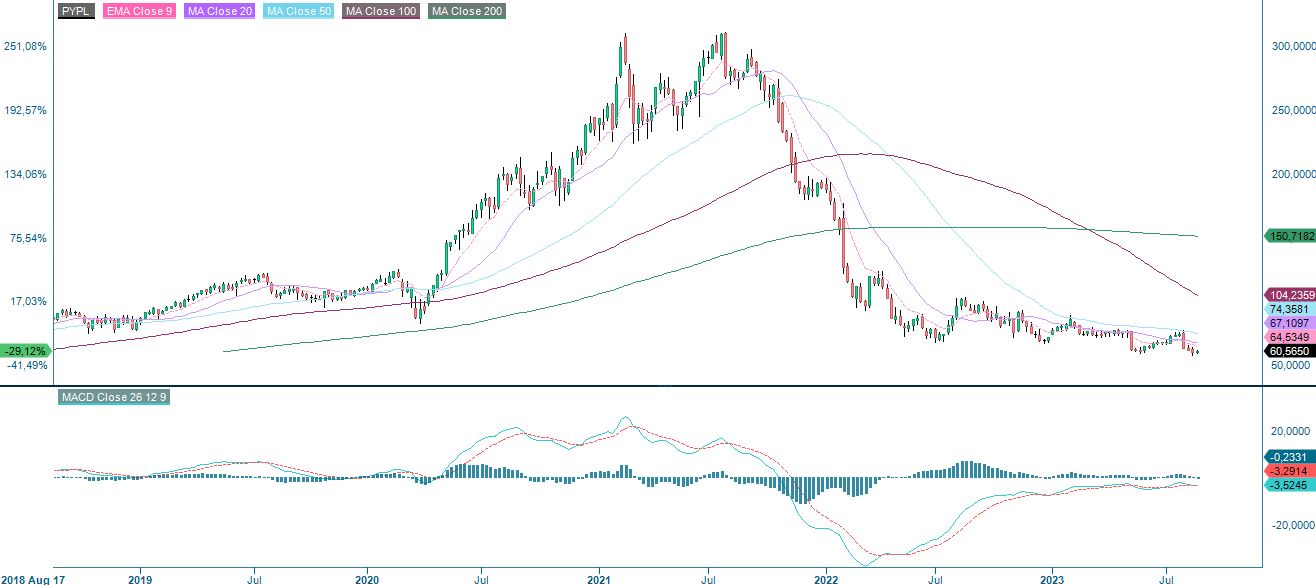
PayPal's Q2 2023 revenue was $7.29 billion, up 7.1% year-over-year and 3.5% sequentially, slightly ahead of Wall Street's estimate of $7.27 billion. EPS was $1.16, up 24% year-on-year and virtually unchanged from the previous quarter, which aligned with Wall Street expectations ($1.15). According to Zacks Research, Paypal's stock lost 12.3 per cent of its value the day after the Q2 2023 results were announced. The Paypal share price has been in a long-term downtrend, but it could be time for a bounce.
In addition, PayPal posted a strong performance in TPV or Total Payment Volume, which reached $376.5 billion, up 11% year-on-year and 6.2% sequentially, benefiting from resilient consumer spending trends. This performance reflects that consumer spending has remained strong even in the face of macroeconomic uncertainty. However, such a trend could be a temporary phenomenon. The e-commerce market will remain depressed if the US economy enters a recession or, worse, a hard landing. So, we must be optimistic.
The free cash flow for the second quarter was negative at $350 million, which includes a negative impact from European BNPL loans. It should be noted that this adjustment had only a one-time effect on the company's free cash flow. PayPal continues to project a free cash flow of $5 billion by 2023, and they will use $5 billion to buy back shares this year, equivalent to nearly 8% of the company's current market capitalisation.
PayPal’s operating margin for the second quarter came in at 21.4%, compared to 22,7% in the first quarter of 2023. This is probably the main reason for the bearish outlook from investors.
On the active account point, the company is trying to increase revenue from existing users rather than focusing its efforts and resources on acquiring users under challenging global financial conditions. Transaction per active account was 54.7 in the second quarter, up 12% year-over-year, and the growth rate seems stable.
PayPal has two priorities, Venmo and the BNPL (“Buy Now Pay Later”) business. Venmo has much potential as its users are primarily young, and is currently one of the most popular e-wallets. In addition, we saw the partnership between Venmo and Amazon at the end of last year, the associations with Apple and Microsoft in the previous quarter, and the launch of Venmo Tap to Pay and the Venmo account for teens. All of this will contribute to more ways to transact with Venmo.
PayPal was a little late to the game of BNPL. Its primary competitors include Affirm, Afterpay and Klarna. The BNPL market is expected to grow at a CAGR of 22% from 2022 to 2030. BNPL business will undoubtedly be one of the driving forces for PayPal over the long run. PayPal’s advantages include its existing network of 35 million merchants and 431 million active accounts. At the same time, PayPal is trying to develop its consumer side. Its app remains far more popular than its competitors.
PayPal may have to wait for the next economic upturn cycle. PayPal's results will take off when the broader economy and e-commerce market improve, changing the market's sentiment towards the company. But with much of this already discounted in the current share price, the potential could be on the upside. One indication is that Paypal is now valued lower than the S&P500 index (p/e 16.6x versus 18.3x).
Paypal stock price chart (in USD), one-year daily chart

Paypal stock price chart (in USD), five-year weekly chart
Macro comments
Economic data is still coming out strong in the US. Here are a few examples from last week; Retail sales and the Philadelphia Fed manufacturing index came in above expectations, while initial jobless claims declined sequentially. Also, according to the Fed’s July meeting minutes released last Wednesday, most Fed members were concerned about US inflation. This makes it less likely that Fed Chairman Jerome Powell will address the start of a softer interest rate policy at the Jackson Hole summit (Wyoming in the USA) on Thursday, 24th and Friday, 25th August, as the market has been speculating.
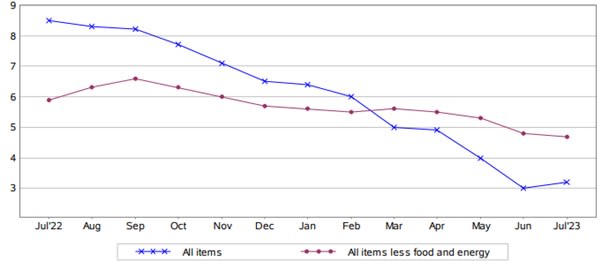
12-month % change in CPI for All Urban Consumers (CPI-U), not seasonally adjusted, July 2022-July 2023 (% change)
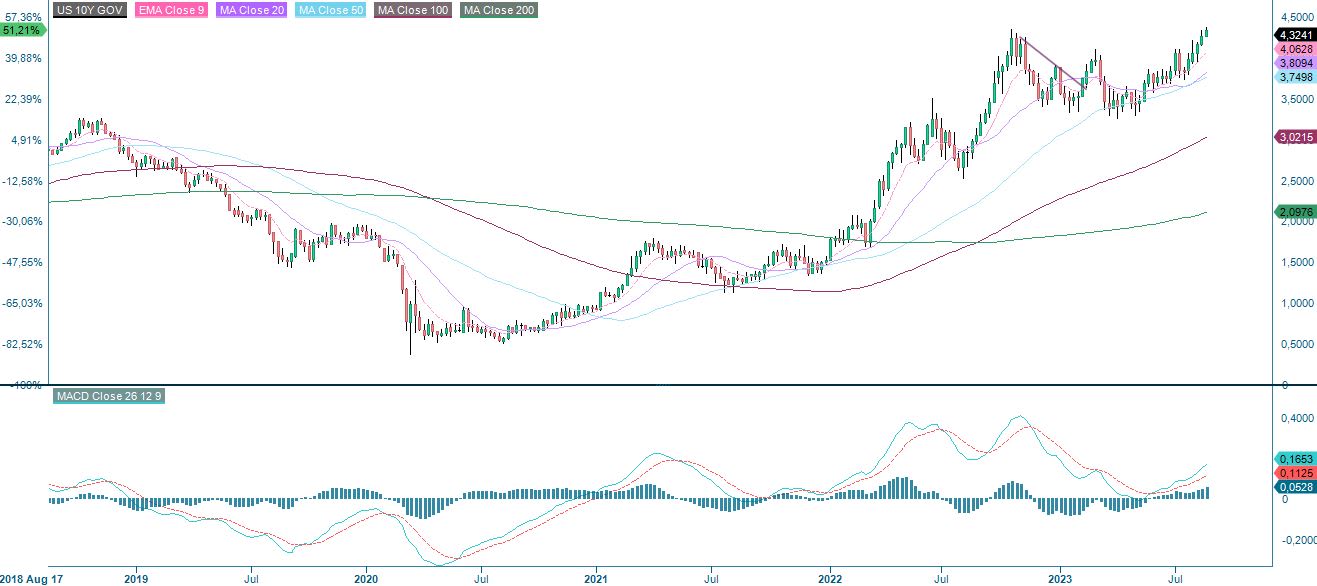
On the back of the above, the 10-year Treasury yield in the US is rising. See the charts below.
US 10-year yield (%), one-year daily chart
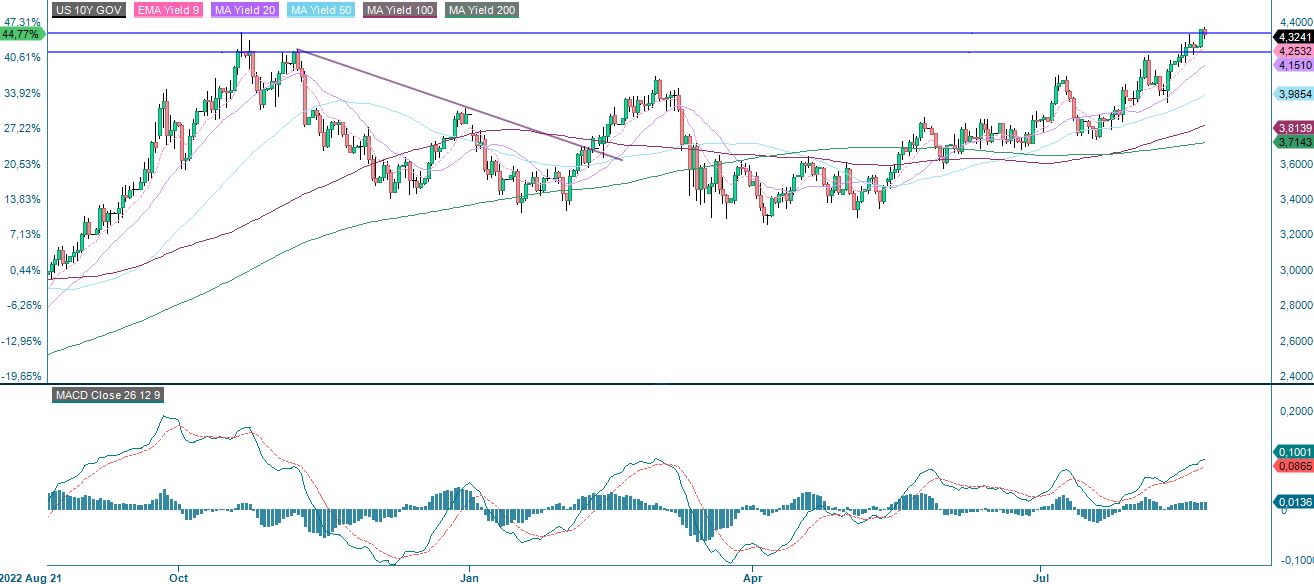
US 10-year yield (%), five-year weekly chart
Inflation in the euro area eased further at the beginning of the third quarter. That is mainly due to falling energy prices. It also looks like energy prices will be significantly lower this winter than last year, at least in Northern Europe. Nevertheless, the German 10-year yield is also rising, but not as fast as in the US.
German 10-year yield (%), one-year daily chart

German 10-year yield (%), five-year weekly chart

Meanwhile, the Euro keeps on losing against the USD. However, as illustrated in the chart below, the EUR/USD cross is approaching support made up by the rising trendline and MA200 around 1.08. It may be interesting to go long EUR/USD.
The underlying asset of the below-mentioned instruments is USD per 1 EUR.
EUR/USD, one-year daily chart

EUR/USD five-year weekly chart

Are the bears here to stay?
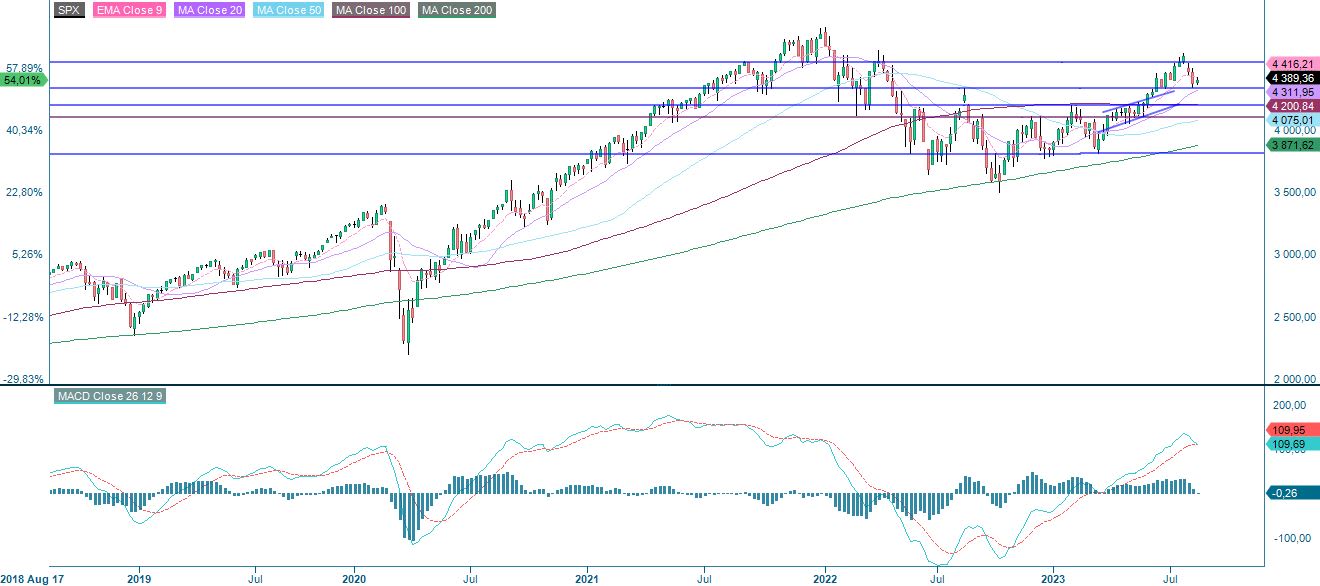
The bears have surrounded S&P 500, but note how the index bounced on the support. The question is if the bulls can take back control. For this, the first is for EMA9 and MA20 to be regained. Until that happens, taking some profits and keeping the remaining short position may be interesting.
S&P 500 (in USD), one-year daily chart

S&P 500 (in USD), weekly five-year chart
Nasdaq 100 is currently trading above EMA9 but below MA20. But momentum remains negative. Thus, until MA20 is regained, it may be interesting to take some profits and keep the remaining short position.
Nasdaq 100 (in USD), one-year daily chart

MACD has generated a soft sell signal in the weekly chart below.
Nasdaq 100 (in USD), weekly five-year chart

OMXS30 is also at a vital level made up by Fibonacci 38.2, around 2,120. Note in the weekly chart that the MACD has generated a sell signal. Again, this may be an opportunity to take some profits and keep the remaining short position.
OMXS30 (in SEK), one-year daily chart

OMXS30 (in SEK), weekly five-year chart

DAX (in EUR), one-year daily chart

DAX (in EUR), weekly five-year chart

The full name for abbreviations used in the previous text:
EMA 9: 9-day exponential moving average
Fibonacci: There are several Fibonacci lines used in technical analysis. Fibonacci numbers are a sequence in which each successive number is the sum of the two previous numbers.
MA20: 20-day moving average
MA50: 50-day moving average
MA100: 100-day moving average
MA200: 200-day moving average
MACD: Moving average convergence divergence
Risici
External author:
This information is in the sole responsibility of the guest author and does not necessarily represent the opinion of Bank Vontobel Europe AG or any other company of the Vontobel Group. The further development of the index or a company as well as its share price depends on a large number of company-, group- and sector-specific as well as economic factors. When forming his investment decision, each investor must take into account the risk of price losses. Please note that investing in these products will not generate ongoing income.
The products are not capital protected, in the worst case a total loss of the invested capital is possible. In the event of insolvency of the issuer and the guarantor, the investor bears the risk of a total loss of his investment. In any case, investors should note that past performance and / or analysts' opinions are no adequate indicator of future performance. The performance of the underlyings depends on a variety of economic, entrepreneurial and political factors that should be taken into account in the formation of a market expectation.
Disclaimer:
This information is neither an investment advice nor an investment or investment strategy recommendation, but advertisement. The complete information on the trading products (securities) mentioned herein, in particular the structure and risks associated with an investment, are described in the base prospectus, together with any supplements, as well as the final terms. The base prospectus and final terms constitute the solely binding sales documents for the securities and are available under the product links. It is recommended that potential investors read these documents before making any investment decision. The documents and the key information document are published on the website of the issuer, Vontobel Financial Products GmbH, Bockenheimer Landstrasse 24, 60323 Frankfurt am Main, Germany, on prospectus.vontobel.com and are available from the issuer free of charge. The approval of the prospectus should not be understood as an endorsement of the securities. The securities are products that are not simple and may be difficult to understand. This information includes or relates to figures of past performance. Past performance is not a reliable indicator of future performance.
© Bank Vontobel Europe AG and/or its affiliates. All rights reserved.