Use of stop-loss in trading


Risk management is required for success in trading. Proper use of stop-loss is important but has its challenges.
Trading at a professional level is often compared to playing poker. In poker, cards are dealt randomly, but the player chooses when and how much he or she wants to bet. The probability of winning changes as more cards are dealt, so an assessment of probabilities must be made several times in each round. Good poker players often fold and vary the size of how much they bet according to the perceived chance of holding a wining hand.
This is also the case in professional trading. You look for situations where it seems attractive to take a position. The purpose is to get into, and get the most out of, a price movement in the share, commodity or index you are observing. At the same time, this must be balanced against the risk of losing if the development does not turn out as expected. In the assessment of risk/reward, stop-loss is absolutely central. In this context, stop-loss is the predefined point where you exit the position because the price is going the wrong way. It is largely the distance to the stop-loss together with the liquidity of the underlying instrument that determines how large a position one can take within proper risk management. I have described this in more detail in a previous post about position sizes in trading.
A technically and quantitatively oriented trader will often look for setups such as these:
- The price has consolidated for a while between defined tops and bottoms and is now showing a tendency to break out on the upside. If it does, you will often get a move equal to the width of the previous consolidation, and the trader wants to capture this.
- The price moves in a trend with rising tops and bottoms, often in a wave where it stays above a given moving average. The trader wants to enter this rhythm at a proper point and sit as long as the move continues.
- The price has had a sharp drop but turned up and established a bottom. The trader assumes that the price will correct up towards the previous higher bottom, or overhead level where there has been traded a large volume.
All of these are situations where, based on the historical price movements, you can assume what the next move will be. Before taking a position, however, you must consider where to set the stop-loss. Although this is theoretically simple, in practice it can involve a number of challenges. Some are linked to the price movement itself, some to which tools you have to execute a stop-loss, and some to the interaction between these. Let's dive deeper.
Testing of levels
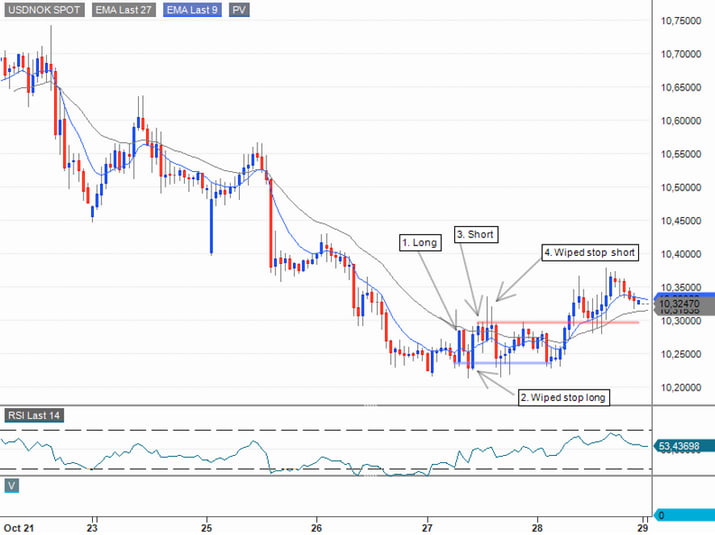
In all the examples of supposedly attractive situations above, there will be points that stand out as natural stop-loss levels. Let's take an example. The chart below shows 1-hour candlesticks for the USDNOK currency cross. The chart shows a downtrend that may appear to be reversing. Within this, certain points are marked where a trader would typically be interested in taking on a position. Point 1 is the first break above the 9-hour moving average, and a strong blue candlestick reaction from a higher bottom than a few hours earlier. Going long with a stop on breaking the higher bottom would not be a stupid trade. However, we see in point 2 that the prices correct back to just wipe out everyone who had this as a stop before they reverse again.
Likewise, point 3 is a strong red candle after testing the 27-hour moving average, and reversal after the price barely crossed the previous peak. A short here with a stop above the last peak would not be a stupid trade. However, we see that this was also immediately wiped out the hour after in point 4, of course followed by another fall to the bottom of the trading range and another sweep below the bottom of this. A trader will often experience this.
USD/NOK
Possible solutions
Is there any ideal way to handle such situations? Probably not. I would say that both the long and short position in the example above are positions I could have taken, and which would appear to have given reasonable risk/reward. However, in this case they are deliberately chosen to show that the market often has movements where these stop levels are swept. One reason for this may be that market makers and other professional traders tend to see and test the most obvious levels. I sometimes do too. However, the main reason is probably rather that a trend reversal is a longer process, which involves "tasting" prices both on the upside and the downside to see if the market wants to take this direction or not.
In practice, there are two possible ways for a trader to handle this. One is to have a very short memory, and a low threshold to start again with a new position if the first goes into stop-loss. It has the disadvantage that it can reduce your success rate, and it's mentally challenging to turn so quickly.
The second method is to wait for precisely this behavior we observe here. Testing a level through a quick sweep and then reversing can provide a better entry. Often a very quick move will come directly after the sweep. The advantage here can be a higher hit rate, but the disadvantage is that you have to watch prices extremely closely and that there will be many times where you miss the move as the trend reversal takes less time than you think. Waiting will always yield new information, but the trick is not to wait too long before taking a position. Trading is making decisions under uncertainty. You can never be sure. The important thing is to have a set of rules and to act.
While the example above was from a trading range in USDNOK, the chart below shows a downtrend that switches to an uptrend for the NASDAQ 100 index in a much shorter process. Let's say a trader wants to use trend-following techniques here and set a stop-loss accordingly. A possible choice could be to look at 10-minute candlesticks and sit short in the index as long as the candlesticks are below the 9 ten-minute moving average. Point 2 shows a place where the trend is tested but holds. Point 3 shows the first closing above the signal level, and the trader will cover the position. Further possible action point are indicated in the chart.
NASDAQ-100

However, this is also not as easy to implement in practice as it appears in the example above. If you look more closely at point 3, there is e.g. a covering of shorts after a more than 1% move up from the nearest bottom 30 minutes earlier. That's a lot for an index, and hard to sit through for a trader. The time period above also shows no big leaps in overnight prices. If I had gone a day further back in time, we would have seen a price drop of 2.2% overnight, which came directly after a strong close the day before. Not the best climate for trend-following models.
Conclusion
The conclusion is that there is no clear pattern of behavior that works in all situations. A trader must be flexible and adaptable to changing conditions. But you cannot avoid having a set of rules for when you enter positions and when you exit. In the operation of the hedge fund I manage, we have spent a lot of time on the type of thinking I have outlined here. The goal of working systematically with this is both to become a better discretionary trader, but also to look for strategies that have the potential to be automated. One thing that becomes obvious is that there are no approaches to the market that have only advantages and no disadvantages. But that's probably how it is with most things in life.
Disclaimer: After many years in the brokerage industry I started my own business in 2021. I published the book "Paleo Trading: How to trade like a Hunter-Gatherer” and launched a hedge fund that trades according to the principles described in the book. I emphasize that nothing written on this blog is to be regarded as personal advice or a concrete call to take positions. Everyone must be responsible for their own decisions and familiarize themselves with the products they use.
Risici
External author:
This information is in the sole responsibility of the guest author and does not necessarily represent the opinion of Bank Vontobel Europe AG or any other company of the Vontobel Group. The further development of the index or a company as well as its share price depends on a large number of company-, group- and sector-specific as well as economic factors. When forming his investment decision, each investor must take into account the risk of price losses. Please note that investing in these products will not generate ongoing income.
The products are not capital protected, in the worst case a total loss of the invested capital is possible. In the event of insolvency of the issuer and the guarantor, the investor bears the risk of a total loss of his investment. In any case, investors should note that past performance and / or analysts' opinions are no adequate indicator of future performance. The performance of the underlyings depends on a variety of economic, entrepreneurial and political factors that should be taken into account in the formation of a market expectation.
Disclaimer:
This information is neither an investment advice nor an investment or investment strategy recommendation, but advertisement. The complete information on the trading products (securities) mentioned herein, in particular the structure and risks associated with an investment, are described in the base prospectus, together with any supplements, as well as the final terms. The base prospectus and final terms constitute the solely binding sales documents for the securities and are available under the product links. It is recommended that potential investors read these documents before making any investment decision. The documents and the key information document are published on the website of the issuer, Vontobel Financial Products GmbH, Bockenheimer Landstrasse 24, 60323 Frankfurt am Main, Germany, on prospectus.vontobel.com and are available from the issuer free of charge. The approval of the prospectus should not be understood as an endorsement of the securities. The securities are products that are not simple and may be difficult to understand. This information includes or relates to figures of past performance. Past performance is not a reliable indicator of future performance.
© Bank Vontobel Europe AG and/or its affiliates. All rights reserved.