New uncertainty in the market


It seems that the ongoing World Cup in North America could boost the share price of Carlsberg, which, like other consumer staples, has underperformed in recent months. Meanwhile, negotiations have begun on a peace deal between the US and Iran, amid renewed threats to close the Strait of Hormuz should Israel not cease its military activities against Hezbollah in Lebanon. This creates uncertainty regarding inflation and interest rates. We argue that there is still a risk of an increase in the coming year.
Case of the week: Will the World Cup boost the Carlsberg share?
A warm summer and the ongoing World Cup could boost beer consumption and investor sentiment toward breweries and beverage companies. Following the U.S.-Israeli attacks on Iran at the end of February, the Carlsberg B share dropped by about 25 percent, likely due to concerns about the crisis's adverse effects on consumer sentiment, freight, and raw material costs. The stock has since recovered somewhat, bolstered by the Q1 2026 trading update, which showed organic growth slightly above expectations. However, as with other consumer staples shares, Carlsberg has underperformed the broader market, with investors flocking back to technology shares. If the AI hype stalls, shares in defensive sectors, including breweries, could narrow the performance gap.
As shown by the Dow Jones US Beverages Index (^DJUSBV), Carlsberg’s share price has recently lagged behind that of other beverage companies.
Carlsberg B relative to Dow Jones US Beverages Index (^DJUSBV) (in DKK), five-year daily chart
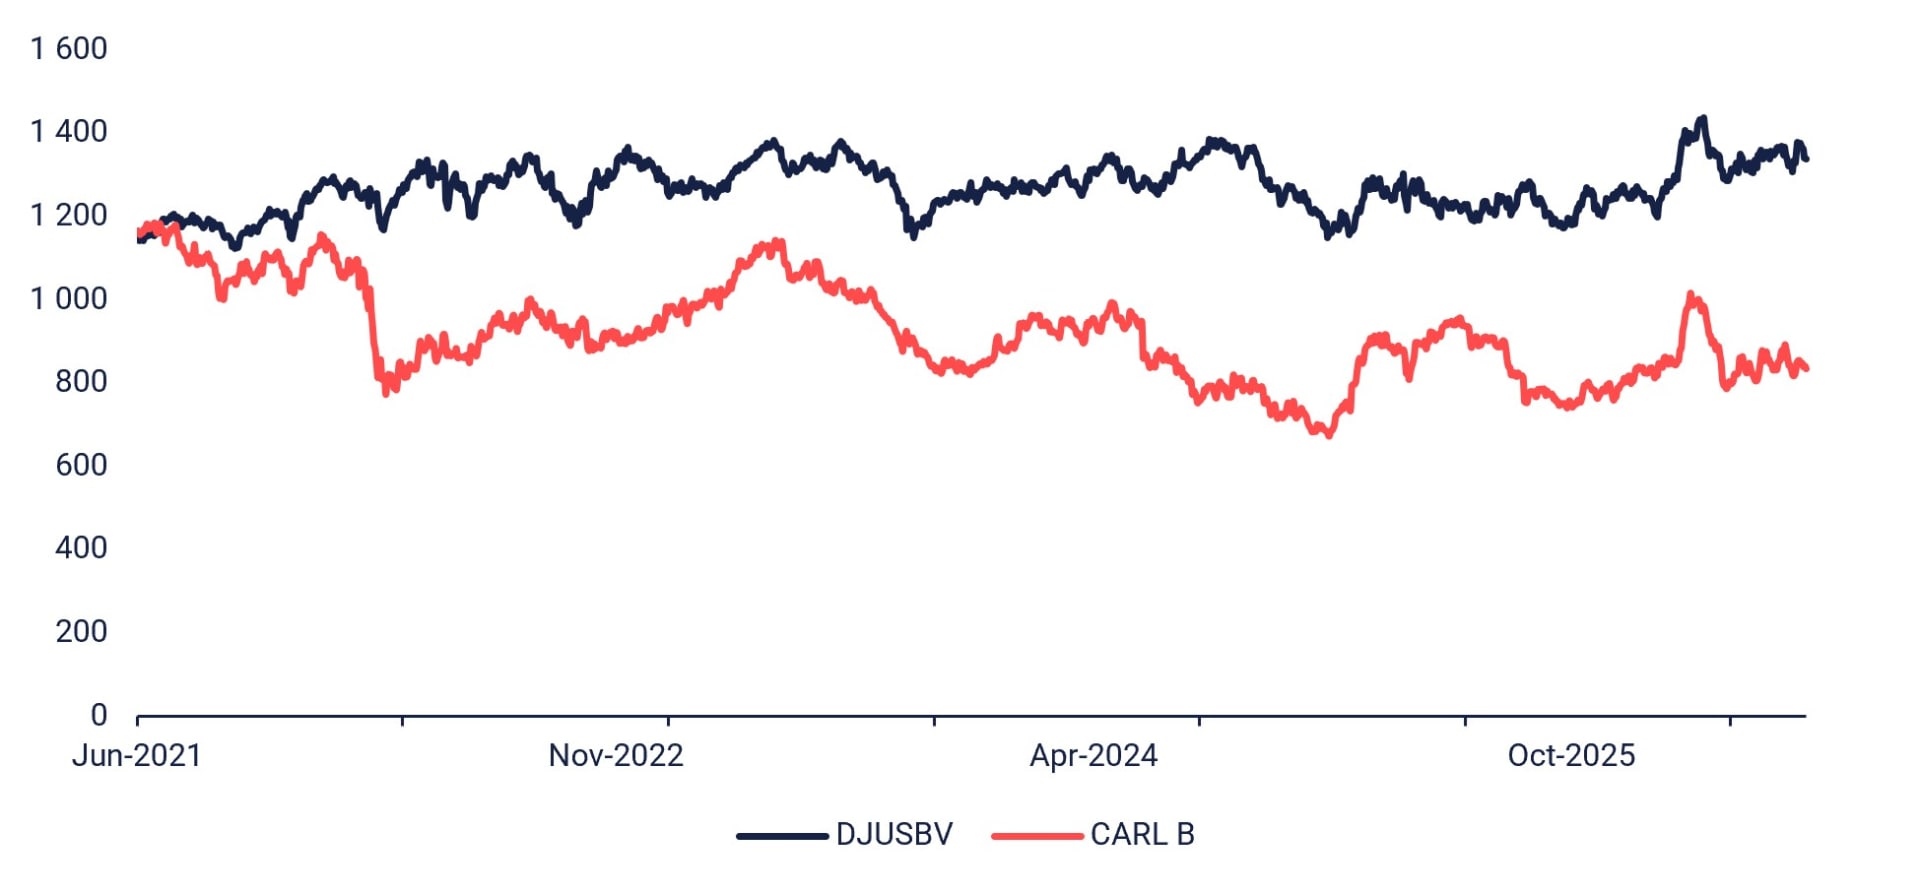
Headwinds include cost inflation and sluggish consumer spending in Asia. However, the situation should be manageable, as recent history in 2022 and 2023 suggests. Despite margin pressure following the Russian invasion of Ukraine and other supply chain bottlenecks, gross profit per hectolitre increased during that period, with price increases helping offset the impact. Recently, there has been increased hope that the Strait of Hormuz will reopen. As markets are generally forward-looking, this could boost investor confidence in Carlsberg. Additionally, an initial public offering (IPO) of Carlsberg’s Indian business could accelerate the timeline for shareholder returns, potentially achieving high single-digit cash yields by 2027.
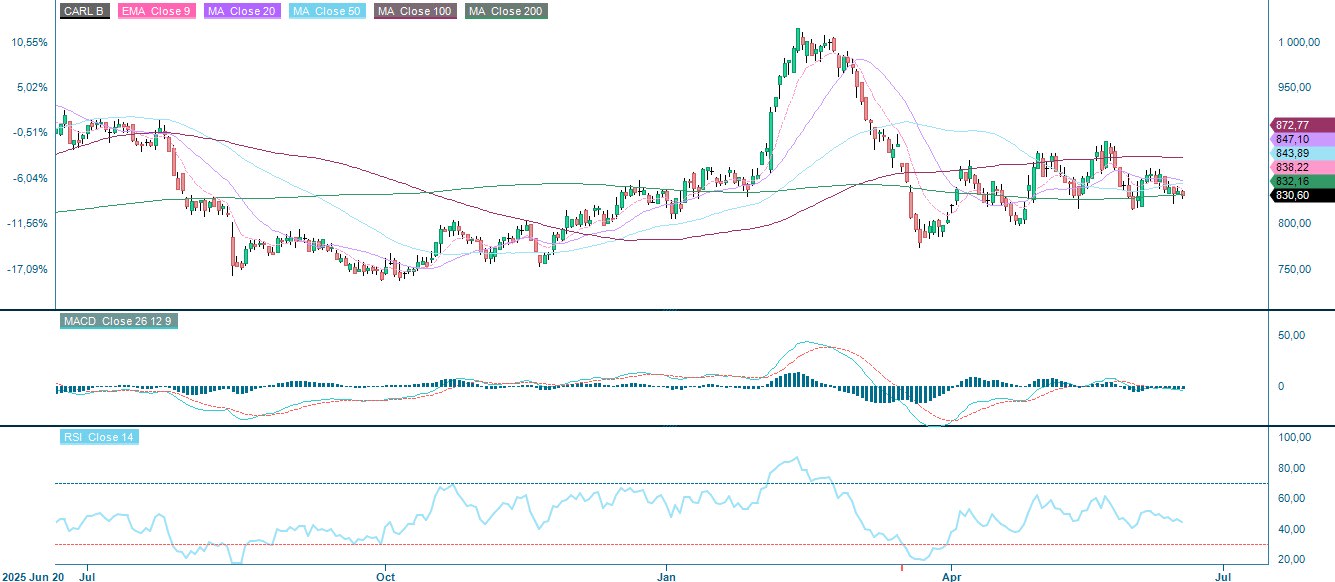
The share is currently trading at the lower end of the DKK 800–890 trading range observed over the past few months. If the MA200 support level of around DKK 830 holds, this could present an attractive entry point.
Related Products
Carlsberg B (in DKK), one-year daily chart
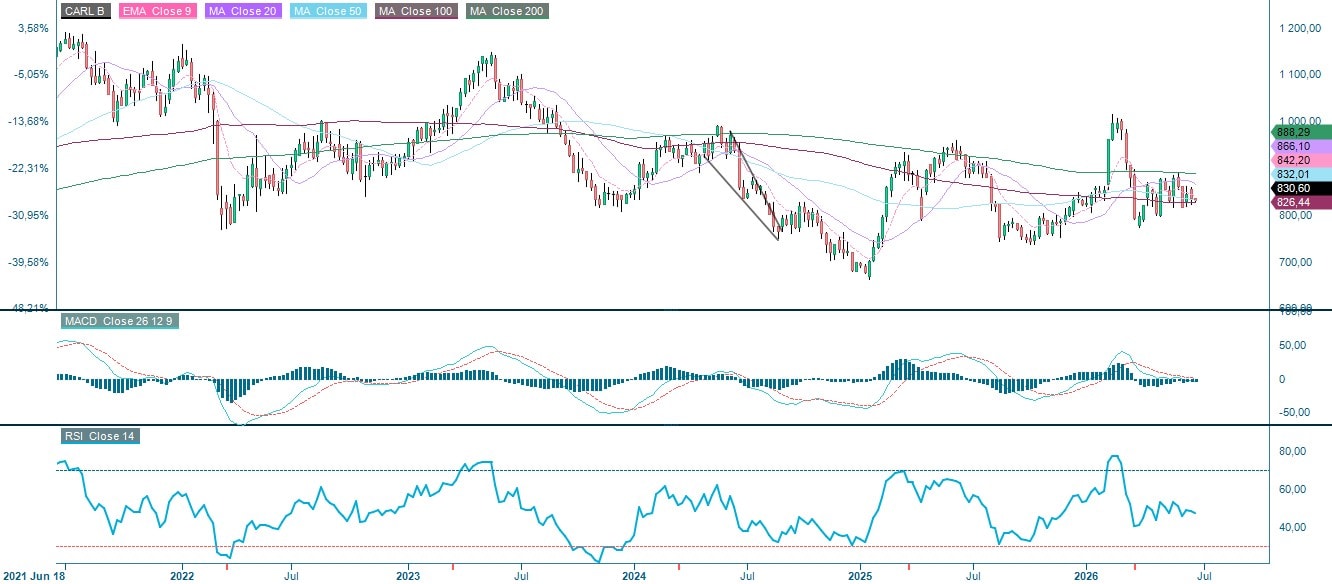
Carlsberg B (in DKK, five-year weekly chart
Macro comments
Peace talks between the United States (U.S.) and Iran have gotten off to a rocky start. Iran has realised that threatening to close the Strait of Hormuz is an effective way ofinfluencing Trump. Should Israel then stop its military operations against Hezbollah in southern Lebanon? After all, this issue is covered in the letter of intent regarding the peace deal between the United States (U.S.) and Iran. However, Brent oil fell by a further 3 percent (3%) on Monday 22 June, suggesting that stock markets are not overly concerned about this. Nevertheless, investors should pay attention to the possibility of higher interest rates within a year. Last week, the new head of the Federal Reserve (Fed), Kevin Warsh, delivered a rather hawkish speech last week, reminding us that inflation in the United States (US) has exceeded the Federal Reserve’s (Fed’s) goal of 2 percent (2%) for several years.
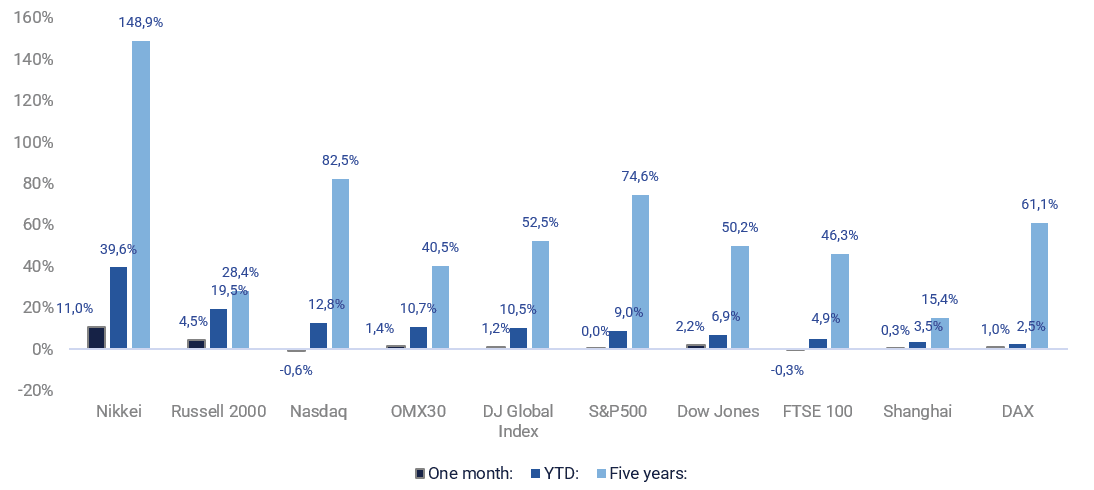
The following monthly summary shows that Japan's Nikkei index has performed best so far this year when calculated in local currencies. Second place went to the United States (US) Small Cap (Capitalisation) Index Russell 2000, and third palce to the NASDAQ.
The one-month, year-to-date (YTD) and five-year performances of equity indices ranked by YTD performance
The US company Micron Technology is scheduled to publish an interim report on Wednesday, 24 June. The first significant macroeconomic release will be the IFO (Institute for Economic Research) index for Germany in June. Following this, the US will report on the current account balance for the first quarter (Q1), new home sales for May, and weekly oil inventories from the Department of Energy. The Federal Reserve (Fed) will also publish the results of its stress test of US banks.
On Thursday 25 June, we will receive a quarterly report from the Swedish company H&M. The first macroeconomic news release will be the GfK (Growth from Knowledge) consumer confidence index for Germany in July, followed by household expectations in June. Next, Spain's first quarter (Q1) Gross Domestic Product (GDP) and May's producer price index will be published. At lunchtime, we will receive the United Kingdom's (UK's) Confederation of British Industry (CBI) industrial trends for June. In the afternoon, we will receive a block of news from the US in the form of Personal Consumption Expenditures (PCE) inflation and durable goods orders for May, as well as weekly jobless claims, definitive Gross Domestic Product (GDP) for Q1, the Chicago Fed's national activity index for May, and the Kansas Manufacturing Index for June.
On Friday 26 June, the Swedish National Institute of Economic Research (NIESR) is expected to publish its business survey for June, while the Swedish Statistics Office will publish the producer price index for May. This will be followed by the publication of Italy's June Business Confidence Indicator. The US will contribute the goods trade balance and wholesale inventories, both for May, as well as the Michigan consumer sentiment index for June.
Oil is trading below the MA200. Are the bets on the DAX?
As expected, it turned out to be a "sell the news" scenario. The risk has tilted back towards the downside due to fresh setbacks in the discussions about the Iran conflict, the AI sell-off, and a more hawkish Fed than expected. As the S&P 500 chart below shows, positive momentum is fading, and the MACD is close to generating a sell signal. Currently, the index is trading near thet 7,340 support level. If this level is broken, the next support levels are seen around 7,250 and 7,150, respectively. However, as the chart shows, trading has been volatile since mid-May, and sentiment could change quickly. On the upside, resistance is seen around 7,500, followed by the previous high around 7,610.
Related Products
S&P 500 (in USD), one-year daily chart

S&P 500 (in USD), five-year weekly chart

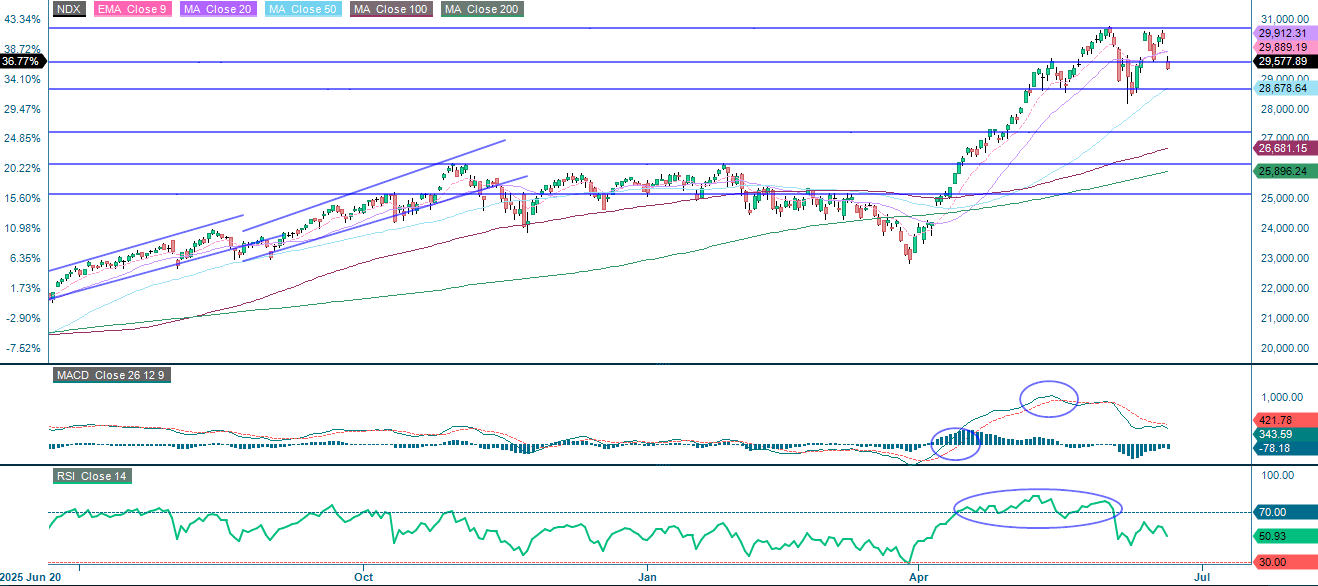
Looking at the NASDAQ-100, it is clear that the index is trading below support. Momentum continues to weaken as AI-related stocks come under pressure. The next downside level is around 28,675. On the upside, the first resistance level is MA20, currently at 29,912, followed by the previous highs.
Related Products
NASDAQ-100 (in USD), one-year daily chart
NASDAQ-100 (in USD), five-year weekly chart

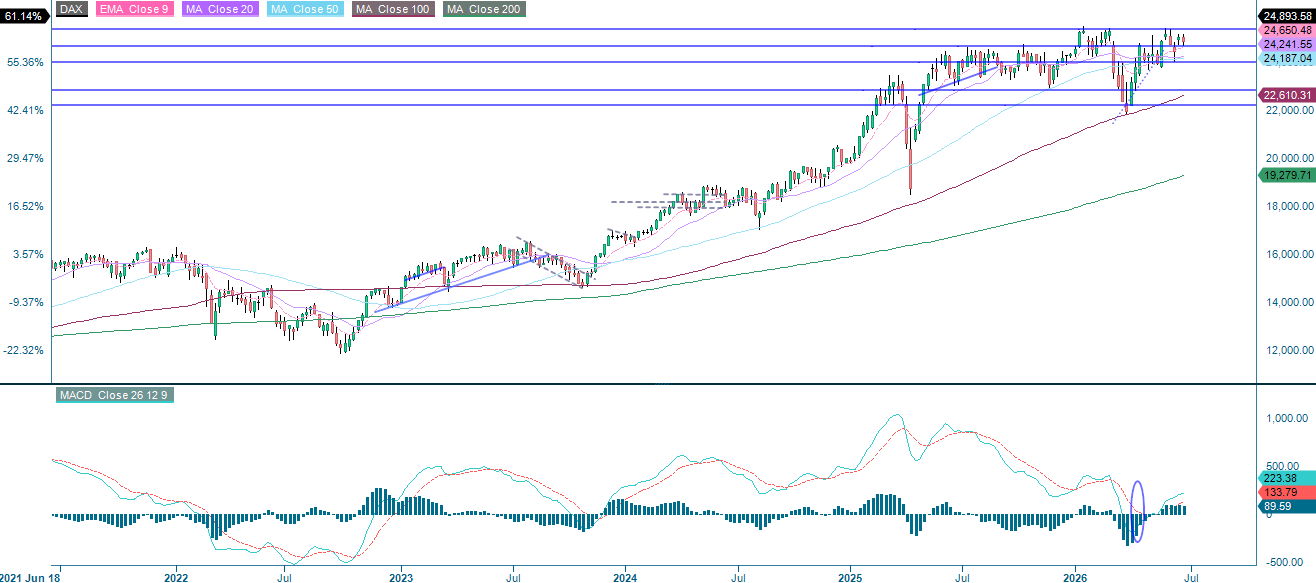
The German DAX has held up relatively well with less direct exposure to Fed hawkishness and no obvious AI angle, trading around its MA20. However, the index is struggling to find direction as momentum continues to fade. At the same time, downside risk appears limited, as initial support has emerged in the 24,560–24,655 range. On the upside, previous highs around 25,400 are likely to act as resistance, and a clear catalyst will probably be required for the index to surpass this level.
Meanwhile, Brent crude is trading below its 200-day moving average, leaving scope for further downside. Against this backdrop, the long DAX, short S&P 500 spread strategy could become popular again, particularly given the clear differences in the composition of the two indices..
Related Products
DAX (in EUR), one-year daily chart

DAX (in EUR), five-year weekly chart
In Sweden, the OMXS30 remains above its MA20. However, negative divergence is beginning to emerge between the index and MACD. Therefore, the risk appears to be tilted to the downside. However, a break below the MA20 would be met with a cluster of support from other moving averages, including the MA100, which is currently at 3,085. Conversely, moving above 3,180 could pave the way for a retest of the previous high of around 3,220.
Related Products
OMX30 (in SEK), one-year daily chart

OMX30 (in SEK), five-year weekly chart

The full name for abbreviations used in the previous text:
EMA 9: 9-day exponential moving average
Fibonacci: There are several Fibonacci lines used in technical analysis. Fibonacci numbers are a sequence in which each successive number is the sum of the two previous numbers.
MA20: 20-day moving average
MA50: 50-day moving average
MA100: 100-day moving average
MA200: 200-day moving average
MACD: Moving average convergence divergence
Risks
Credit risk of the issuer:
Currency risk:
If the product currency differs from the currency of the underlying asset, the value of a product will also depend on the exchange rate between the respective currencies. As a result, the value of a product can fluctuate significantly.
External author:
Market risk:
The value of the products can fall significantly below the purchase price due to changes in market factors, especially if the value of the underlying asset falls. The products are not capital-protected
Product costs:
Product and p
Product and pg costs reduce the value of the products.
he products.Risk with leverage products:
Due to the leverage effect, there is an increased risk of loss (risk of total loss) with leverage products, e.g. Bull & Bear Certificates, Warrants and Mini Futures.
ini Futures.������������������������������������������������������������������������������������������������������������������������������������������������Disclaimer:
This information is neither an investment advice nor an investment or investment strategy recommendation, but advertisement. The complete information on the products (securities) mentioned herein, in particular the structure and risks associated with an investment, are described in the base prospectus, together with any supplements, as well as the final terms relating to the securities. The base prospectus and final terms constitute the solely binding sales documents for the products mentioned herein. It is recommended that potential investors read these documents before making any investment decision. The documents and the key information document are published on the website of the issuer, Vontobel Financial Products GmbH, Bockenheimer Landstrasse 24, 60323 Frankfurt am Main, Germany, on https://prospectus.vontobel.com and are available from the issuer free of charge. The approval of the prospectus should not be understood as an endorsement of the securities. The securities are products that are not simple and may be difficult to understand. This information includes or relates to figures of past performance. Past performance is not a reliable indicator of future performance. This information may only be distributed or published in countries where such distribution or publication is permitted by applicable law. As stated in the relevant base prospectus, the distribution of the securities mentioned in this information is subject to restrictions in certain jurisdictions. This advertisement may not be reproduced or redistributed without prior permission by Vontobel.
© Bank Vontobel Europe AG and / or affiliated companies. All rights reserved.