A peace deal with pending negotiations


This week's case study focuses on Hennes & Mauritz (H&M), which is set to release its mid-year report next week. The company recently surprised the market with better-than-expected operating results. The challenge for H&M is to improve its operating margin despite low revenue growth. The letter of intent for peace between the US and Iran, which is subject to 60 days of further negotiations, has driven up the world's stock markets again, particularly tech stocks.
Case of the week: Will the H&M stock be back in fashion soon?
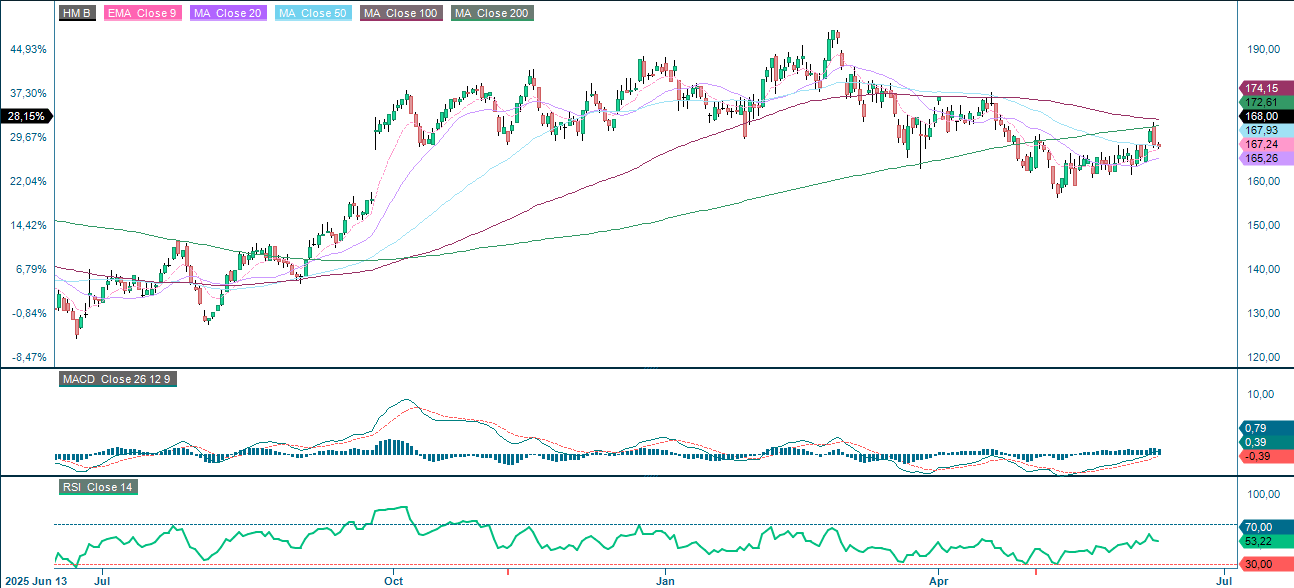
Swedish retail giant H&M is set to release its mid-year report for 2025/26 on 25 June 2026. This comes at a time when the share price has fallen back from a peak at SEK 193 as of 27 February 2026.
Following the publication of H&M's full-year report for 2024/25 on 29 January 2026, which revealed operating results that were 14% better than expected, the share price reached the previously mentioned peak on 27 February 2026. In the Q1 2025/26 report, released on 25 March 2026, H&M posted EBIT that was 6% above market consensus.
In recent years, H&M's biggest challenge has been its lack of sales growth. Meanwhile, competitor Inditex has sailed ahead with a significantly better sales growth rate. This has created a valuation gap between the companies that is unlikely to close anytime soon. Nevertheless, H&M has slowly improved its operating margins to reach its goal of 10 per cent by streamlining operations and maintaining cost control to improve profitability.
In Q4 of the 2024/25 financial year, H&M achieved an operating margin of 10.7% for the quarter and 8.1% for the full year. Despite achieving a mere 3.0% operating margin in the first quarter, H&M managed to lift the margin to 8.4% over the past twelve months in Q1 2025/26 (February to May 2025/26).
Based on today's share price of SEK 168, H&M is expected to achieve earnings per share of around SEK 8.00. This gives it a price-to-earnings ratio of 21 times its 12-month trailing earnings. For comparison, Inditex's shares are valued at a forward P/E ratio of between 25.0 and 26.5 times.
The H&M share has clearly defensive and less cyclical characteristics. The H&M stock provides an approximate yield of 4.2% through its SEK 3.55 dividend every six months.
The Stefan Persson family has increased its ownership in H&M to 67% of the share capital and 84% of the votes through a combination of the company's share buybacks and net purchases of H&M shares for its own account. However, an offer for all outstanding H&M shares is still pending and will likely remain so for several years.
Related Products
H&M (in SEK), one-year daily chart
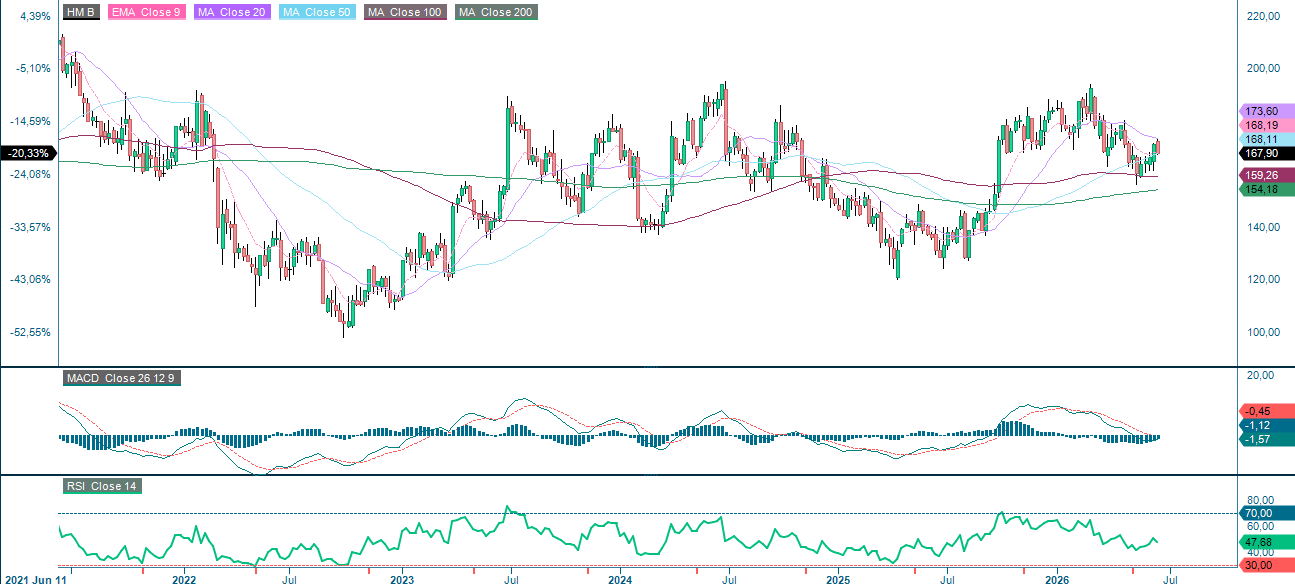
H&M (in SEK), five-year weekly chart
Macro comments
Last week, the United States (U.S.) launched new military attacks on Iran, prompting counterattacks from Iran. Risk appetite on world stock markets fell with the Standard & Poor's 500 (S&P 500) trading 4.5% below its annual high, which was reached on June 2. Trump had threatened to take harsh military action against Iran between Wednesday, June 10, and Thursday, June 11, but changed his mind within 24 hours, announcing that the war with Iran was over. Despite Trump having reportedly said on at least 37 previous occasions that a peace treaty was imminent, this time the claim was partly true. On Sunday, June 14, the highest-ranking officials from the United States and Iran signed a 60-day ceasefire agreement. According to Trump, the Strait of Hormuz will open to shipping on Friday, June 19. This will be followed by 60 days of negotiations between the parties on issues on which they have not yet agreed, primarily Iran's nuclear energy program. Rumors of a potential peace agreement have driven up prices on the world's stock exchanges, particularly tech stocks. We believe this is linked to hopes of lower oil prices, which would result in lower inflationary pressure on market interest rates.
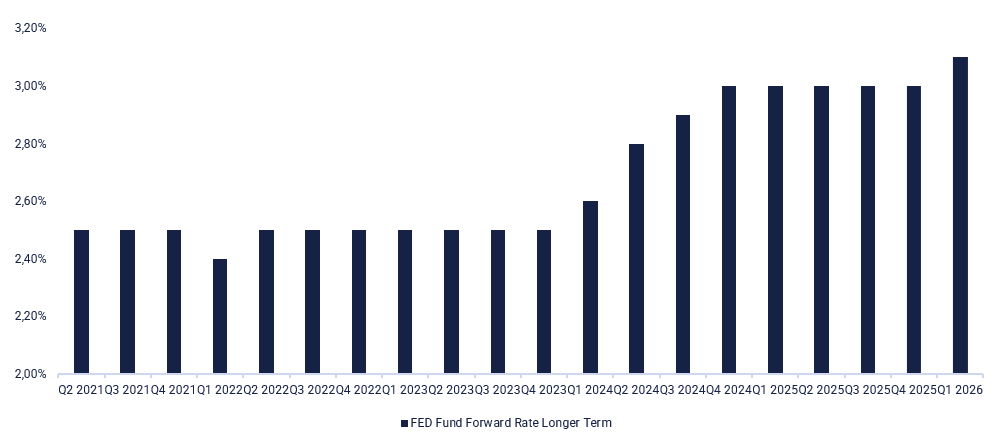
On Wednesday, June 17, the Swedish company Elekta will host a capital markets day. The day will begin with a review of the Japanese trade balance and machinery orders for May and April, respectively. Next, we will look at the consumer price index (CPI) and producer price index (PPI) in the United Kingdom (UK) for May. The Swedish Riksbank will announce its interest rate. Next, comes the consumer price index (CPI) for the Eurozone in May. The International Energy Agency (IEA) will release a monthly oil report. The United States (U.S.) will release data on retail sales and business inventories for April and May, respectively, as well as pending home sales for May. The Department of Energy (DOE) will release data on weekly oil inventories. Finally, the Federal Reserve (Fed) will announce its interest rate. To illustrate the latter, we have added a five-year graph of the Federal Funds Rate Projection below.
On Thursday, June 18, an interim report from Accenture in the United States (U.S.) is expected. The macroeconomic data starts with the Eurozone's current account balance for April, followed by an interest rate announcement from Norges Bank. A few hours later, the Bank of England (BoE) will announce its interest rate decision, and the United States (U.S.) will release the Philadelphia Fed index and weekly jobless claims for June.
Several stock exchanges, including those in China, Denmark, Finland, Hong Kong, Sweden, and the United States (U.S.), will be closed on Friday, June 19. In the Nordic countries, this is due to the celebration of Midsummer´s Eve. This Friday's macroeconomic news feed starts with Japan's consumer price index (CPI) for May and the minutes from the Bank of Japan (BoJ) interest rate meeting on April 28. The United Kingdom (UK) will release its retail sales figures for May, and Germany will release its producer price index (PPI) figures for May.
Federal Funds Rate Projection (in percent)—Longer Term, Five-Year Chart
A runaway gap or a classic buy the rumour, sell the news?
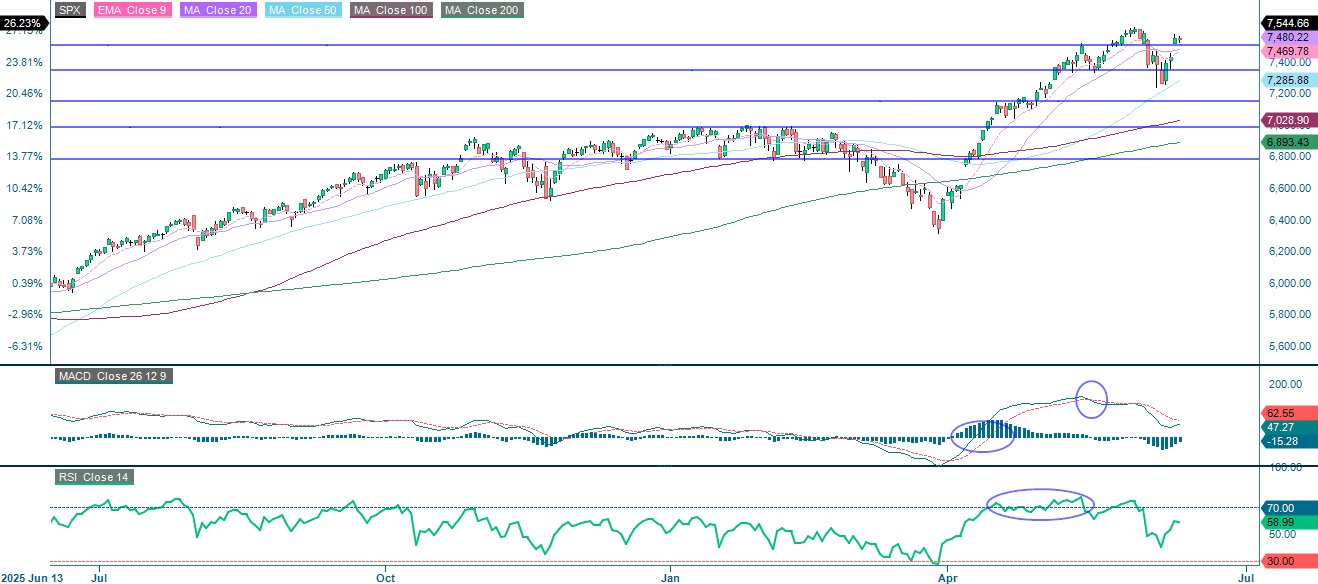
On Monday, the S&P 500 rallied sharply, with a preliminary US-Iran peace accord helping to ease concerns over a broader regional conflict and fears of a potential closure of the Strait of Hormuz. Falling oil prices, which reached their lowest level since March, also supported this rally. Sentiment across the broader equity market also appeared to be boosted by SpaceX's public listing on 12 June, which drew speculative capital back into high-growth equities.
As the chart below shows, the S&P 500 is currently trading above both the EMA9 and the MA20. The next few sessions should provide a clearer indication of whether this is a so-called 'runway gap' (a continuation move) or if it will be filled in a 'buy the rumour, sell the news' reaction.
Related Products
S&P 500 (in USD), one-year daily chart
S&P 500 (in USD), five-year weekly chart

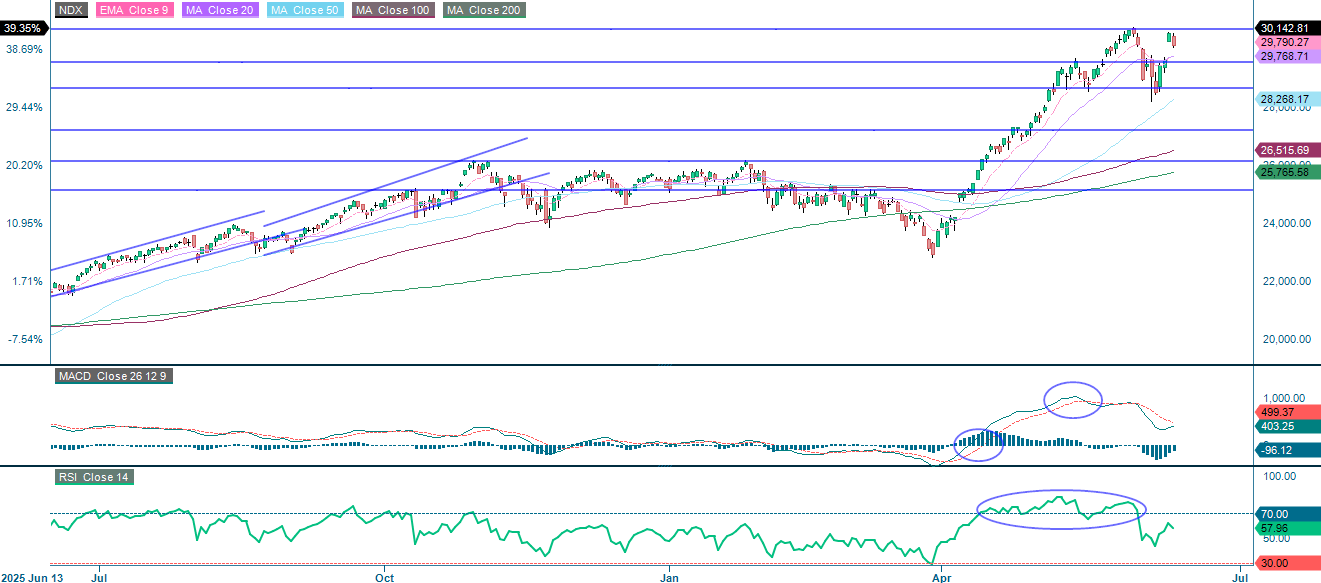
On Monday, technology and semiconductor stocks sensitive to interest rates led the rebound in the NASDAQ-100, driving the index up by more than 3% in a single session. This was further supported by robust ongoing demand for AI data centre infrastructure and firmer memory chip pricing. As for the S&P 500, the next few trading days are likely to provide a clearer indication of the near-term direction of the NASDAQ-100. However, the current trading picture is not particularly encouraging in terms of continuation, though this could quickly change.
Related Products
NASDAQ-100 (in USD), one-year daily chart
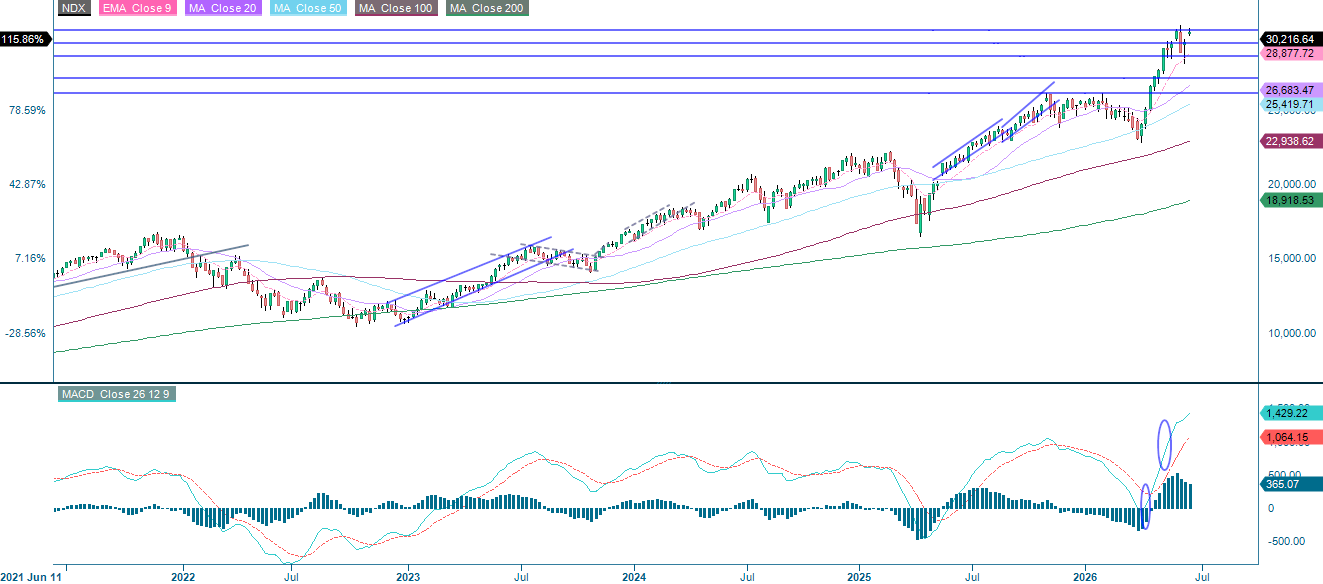
NASDAQ-100 (in USD), five-year weekly chart
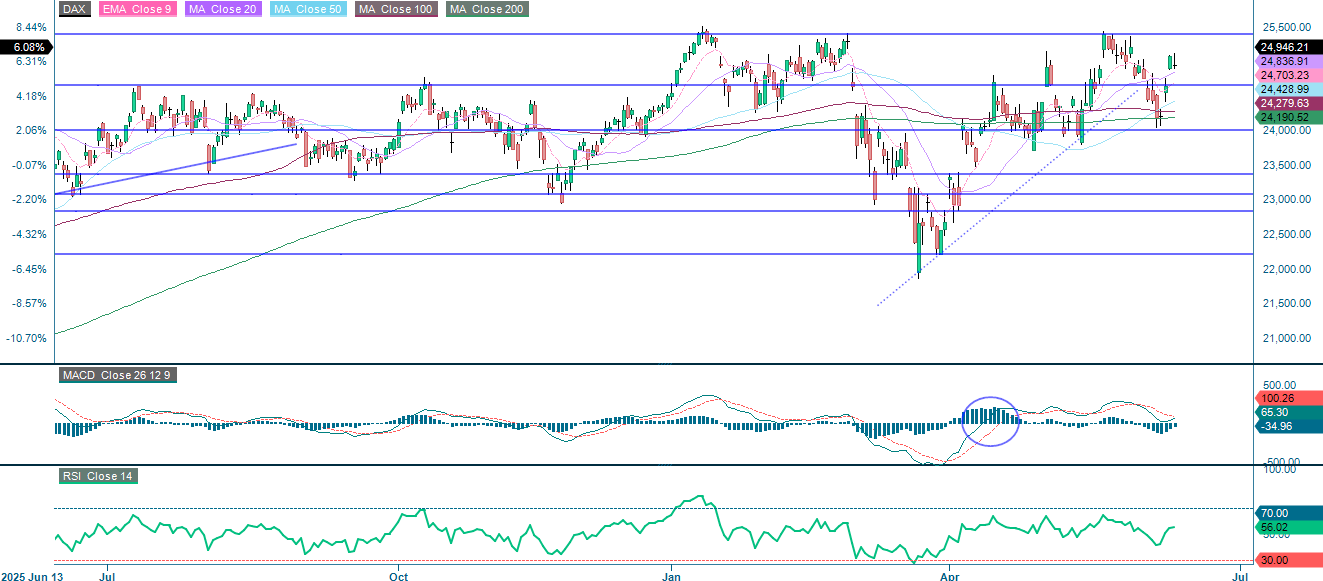
At the time of writing, US markets were trading more cautiously. The DAX closed lower yesterday and still has some way to go before it can retest its previous highs, which now serve as the first level of resistance. On the downside, the rising MA20 acts as the initial support level. This is followed by levels around 24,655.
Related Products
DAX (in EUR), one-year daily chart
DAX (in EUR), five-year weekly chart

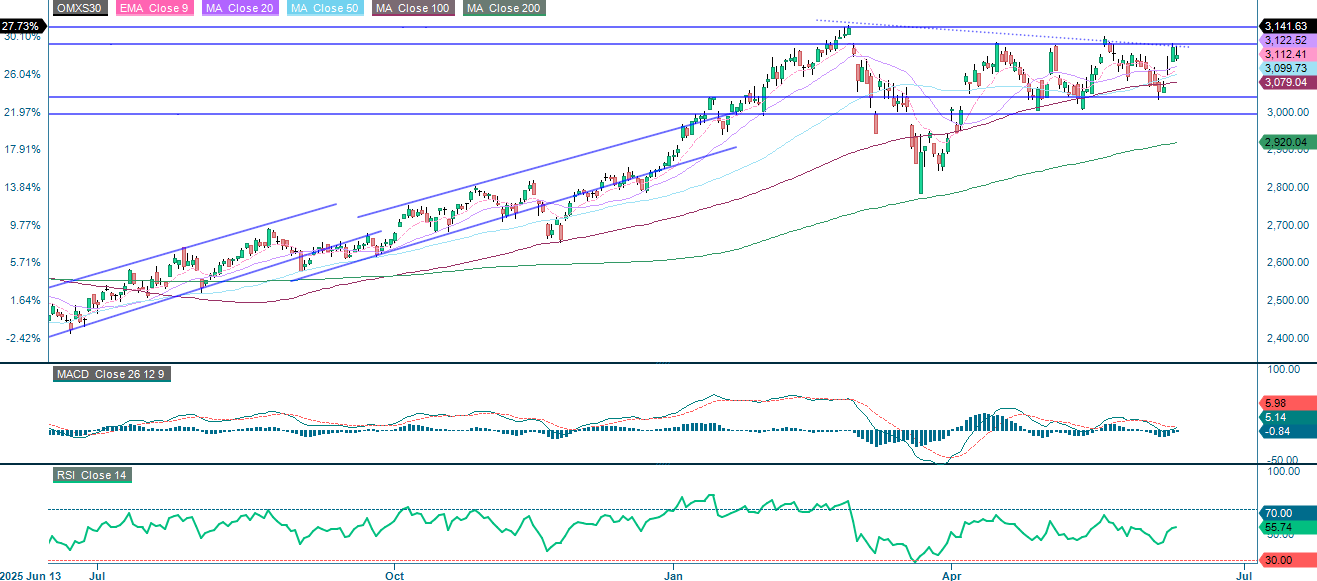
In Sweden, the OMXS30 stalled at the 3,180-resistance level. Breaking above this level would pave the way for a retest of the previous highs of around 3,225. On the downside, the first support level is MA20 at 3,122, followed by 3,079 where MA100 comes into play.
Related Products
OMX30 (in SEK), one-year daily chart
OMX30 (in SEK), five-year weekly chart

The full name for abbreviations used in the previous text:
EMA 9: 9-day exponential moving average
Fibonacci: There are several Fibonacci lines used in technical analysis. Fibonacci numbers are a sequence in which each successive number is the sum of the two previous numbers.
MA20: 20-day moving average
MA50: 50-day moving average
MA100: 100-day moving average
MA200: 200-day moving average
MACD: Moving average convergence divergence
Risks
Credit risk of the issuer:
Investors in the products are exposed to the risk that the Issuer or the Guarantor may not be able to meet its obligations under the products. A total loss of the invested capital is possible. The products are not subject to any deposit protection.
Currency risk:
If the product currency differs from the currency of the underlying asset, the value of a product will also depend on the exchange rate between the respective currencies. As a result, the value of a product can fluctuate significantly.
External author:
This information is in the sole responsibility of the guest author and does not necessarily represent the opinion of Bank Vontobel Europe AG or any other company of the Vontobel Group. This information is sponsored by Bank Vontobel Europe AG, which may be a counterparty to transactions involving the financial instruments discussed in this information. The further development of the index or a company as well as its share price depends on a large number of company-, group- and sector-specific as well as economic factors. When forming his investment decision, each investor must take into account the risk of price losses. Please note that investing in these products will not generate ongoing income.
The products are not capital protected, in the worst case a total loss of the invested capital is possible. In the event of insolvency of the issuer and the guarantor, the investor bears the risk of a total loss of his investment. In any case, investors should note that past performance and / or analysts' opinions are no adequate indicator of future performance. The performance of the underlyings depends on a variety of economic, entrepreneurial and political factors that should be taken into account in the formation of a market expectation.
Market risk:
The value of the products can fall significantly below the purchase price due to changes in market factors, especially if the value of the underlying asset falls. The products are not capital-protected
Product costs:
Product and possible financing costs reduce the value of the products.
Risk with leverage products:
Due to the leverage effect, there is an increased risk of loss (risk of total loss) with leverage products, e.g. Bull & Bear Certificates, Warrants and Mini Futures.
Disclaimer:
This information is neither an investment advice nor an investment or investment strategy recommendation, but advertisement. The complete information on the products (securities) mentioned herein, in particular the structure and risks associated with an investment, are described in the base prospectus, together with any supplements, as well as the final terms relating to the securities. The base prospectus and final terms constitute the solely binding sales documents for the products mentioned herein. It is recommended that potential investors read these documents before making any investment decision. The documents and the key information document are published on the website of the issuer, Vontobel Financial Products GmbH, Bockenheimer Landstrasse 24, 60323 Frankfurt am Main, Germany, on https://prospectus.vontobel.com and are available from the issuer free of charge. The approval of the prospectus should not be understood as an endorsement of the securities. The securities are products that are not simple and may be difficult to understand. This information includes or relates to figures of past performance. Past performance is not a reliable indicator of future performance. This information may only be distributed or published in countries where such distribution or publication is permitted by applicable law. As stated in the relevant base prospectus, the distribution of the securities mentioned in this information is subject to restrictions in certain jurisdictions. This advertisement may not be reproduced or redistributed without prior permission by Vontobel.
© Bank Vontobel Europe AG and / or affiliated companies. All rights reserved.