Some interesting charts


Technical situation as of July 2022.
In the article "A short macro review". I described my perception of the macro picture, and some assumptions for the further course of events. In many ways, this lays the "foundation wall" for the current investment climate. In this article, some selected charts are commented on that further illuminate this.
S&P 500
The chart below shows the US S&P 500 index since 1993, where each bar (candlestick) indicates 1 month's price development. Blue curve is 40-month moving average. As we can see, there are only 3 cases in the time series where prices have remained below such a level for some time. The first was after the IT bubble from 2000 to 2003. The second was the financial crisis in 2007-2009, and the third was during the sharp fall in connection with Covid-19 in 2020. The latter, however, reversed so quickly that it is almost not visible in the chart. During a series of other corrections or short bear markets, this level has only been barely touched, and each time it marked the bottom. We also see that it was only in the first two and more prolonged bear markets that the momentum indicator RSI (at the bottom of the chart) fell all the way to so-called "oversold" territory on the monthly chart. Covid-19, current situation, and the last time the Federal Reserve was supposed to shrink the balance sheet (2018) only sent the long-term momentum indicator to neutral near 50.

S&P 500 index (in USD), monthly candlesticks. Source Infront. Past performance is no reliable indicator of future results.
This year, the 40-month average was almost touched at the S&P 500's preliminary low of 3,637 in June. If this turns out to be the bottom, the current bear market will be among the mildest in recent history. Is it credible that this time we will go deeper? Based on what I described in the macro article, I would say "probably". On the one hand, we have already come down a bit, and it is always easier to bet that something normal will happen than something extreme. On the other hand, we are now in the correction after a very long rise and are in a situation where interest rates are in the process of normalizing after being historically extremely low. This does not happen without discomfort. One can rather expect that such a process will affect the market for a longer time.
Looking for historical parallels, the present is somewhat reminiscent of the aftermath of the IT bubble. When many financial assets have been extremely expensive, it simply takes a while to work your way out of it. The aftermath of other periods of high inflation earlier in the last century also shows the same. I would say that it is far from certain that we have seen the bottom, and one should be prepared for a further decline. Possibly, we may get a longer period of sideways price movement in the trading range. As is well known, corrections can take place both with the help of time and price.
Oil, Aluminum and Copper
The next chart shows the prices of North Sea oil, Aluminum and Copper since the start of 2018. Of these, it is actually only oil that is now traded significantly above where the price was 4 years ago. It can be added that the picture for a number of other raw materials is relatively similar to aluminum and copper. Oil's elevated position reflects the ongoing scarcity in the energy market, while other raw materials can be said to have normalized. This can be expected to have consequences for inflation figures in the future, as the rise in prices of raw materials will not be as great year-on-year.
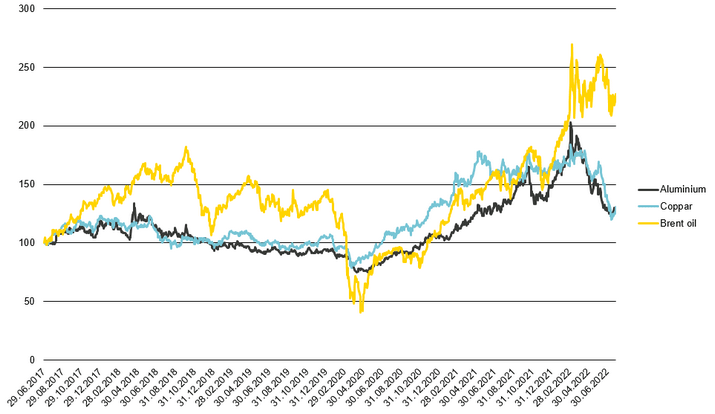
Performance of Brent oil, Copper and Aluminum in precent. Base value equal to 100. Source for calculations: Bloomberg. Past performance is no reliable indicator of future results.
We also see that copper has fallen back relatively modestly from the previous peak and has flattened out in recent months. The red metal is often called "Dr. Copper" because it is a good indicator of the state of the economy. The lack of a clear downward trend in copper may thus be an indication that the state of the world economy may not be as bad as feared.
Hot or not?
Finally, I include a more short-term chart on the ARKK Innovation ETF. This is a well-known listed fund in the USA that had an extreme rise from 2017 to 2021. The fund's investment strategy is to own shares in companies that are innovative and have the potential to transform their industries over a 5-year period. Tesla, for example, is one of the largest holdings in the fund. Such shares rose very strongly in the mentioned period and achieved pricing multiples that in many cases exceeded those we saw on the internet companies during the IT boom in 2000. The fund fell 78% from its peak in February 2021 to its provisional bottom in May 2022. This is a lot, but actually still less than the NASDAQ index itself fell from its peak in 2000 to its bottom in 2003.

ARKK Innovation ETF in USD, daily. Source Bloomberg. Past performance is no reliable indicator of future results.
Since the bottom in May, we have seen a sideways movement in this group of stocks. ARKK has once again established itself above its 50-day moving average (green curve) and tried last week to break through the top of the last months' trading range. On Friday, however, it fell back hard. The fund is a good indicator of the risk appetite in the tech segment of the market, and it will be interesting to follow this further. If ARKK manages to stay above approx. 46 it will be a good sign and give a renewed desire to take on more tech exposure. Similarly, a failed break on the upside will be a clear sign that the challenging period is not over.
Disclaimer:After many years in the brokerage industry, in 2021 I published "Paleo Trading: How to trade like a Hunter-Gatherer” and launched a hedge fund that trades according to the principles described in the book. Vontobel asked if I would write posts for their blog, similar to what traders and managers do in other countries. It is emphasized that nothing written on this blog is to be regarded as personal advice or a concrete call to take positions. Everyone must be responsible for their own decisions and familiarize themselves with the products they use.
Risks
External author:
This information is in the sole responsibility of the guest author and does not necessarily represent the opinion of Bank Vontobel Europe AG or any other company of the Vontobel Group. The further development of the index or a company as well as its share price depends on a large number of company-, group- and sector-specific as well as economic factors. When forming his investment decision, each investor must take into account the risk of price losses. Please note that investing in these products will not generate ongoing income.
The products are not capital protected, in the worst case a total loss of the invested capital is possible. In the event of insolvency of the issuer and the guarantor, the investor bears the risk of a total loss of his investment. In any case, investors should note that past performance and / or analysts' opinions are no adequate indicator of future performance. The performance of the underlyings depends on a variety of economic, entrepreneurial and political factors that should be taken into account in the formation of a market expectation.
Disclaimer:
This information is neither an investment advice nor an investment or investment strategy recommendation, but advertisement. The complete information on the trading products (securities) mentioned herein, in particular the structure and risks associated with an investment, are described in the base prospectus, together with any supplements, as well as the final terms. The base prospectus and final terms constitute the solely binding sales documents for the securities and are available under the product links. It is recommended that potential investors read these documents before making any investment decision. The documents and the key information document are published on the website of the issuer, Vontobel Financial Products GmbH, Bockenheimer Landstrasse 24, 60323 Frankfurt am Main, Germany, on prospectus.vontobel.com and are available from the issuer free of charge. The approval of the prospectus should not be understood as an endorsement of the securities. The securities are products that are not simple and may be difficult to understand. This information includes or relates to figures of past performance. Past performance is not a reliable indicator of future performance.