S&P 500 gets a technical sell signal after the November rally

Despite an interim report two weeks ago that beat market estimates by 19%, Nvidia shares have been flat for six months. The explanation is increasing competition in AI from Alphabet and Microsoft, among others. US interest rates have fallen sharply since mid-October, triggering a stock market rally in November. But technically, the S&P500 has now received a sell signal.
Case of the week: A possible glitch in Nvidia’s bull trend
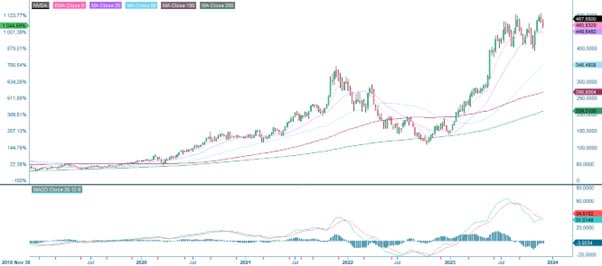
Nvidia's stock has experienced an extraordinary bullish trend YTD in 2023, with a staggering gain of approximately 218%, whereas larger parts of the increase took place during the first half of the year. Currently, Nvidia is trading at a Price-to-Sales (P/S) of 27x, significantly higher than prominent peers Microsoft (P/S of 13x) and Alphabet (P/S of 6x). This notable difference in valuation metrics suggests a market perception that places a higher premium on Nvidia's revenue relative to its peers in the same industry.
In the beginning of 2023, Nvidia dominated the AI chip scene, allowing the company to command a significant premium on its chips and reap substantial profits. However, this scenario is undergoing a shift as rival companies test new chips. AMD is gearing up to launch its MI300 chips in early December 2023. Amazon, on the other hand, has unveiled the Trainium2 chips, boasting a claimed performance that is four times faster and twice as energy efficient as its predecessor. Microsoft has also entered the arena with its own AI chip named Maia, aimed at delivering customized AI services.
Competition wise, we are likely to see significant headwinds for Nvidia in 2024 as all the major tech companies possess substantial resources, enabling swift scaling of development initiatives regarding products comparable to Nvidia’s. Their integrated cloud services further expedite chip utilization, eliminating the need to await external clients. This shift fundamentally alters the competitive landscape, potentially prompting Nvidia to consider lower prices in a strategic move to safeguard and retain market share for its proprietary AI chips.
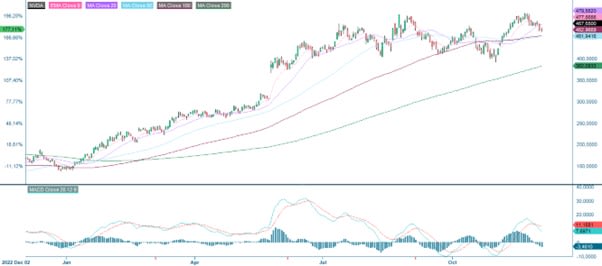
On November 21, Nvidia released its Q3 report, which outperformed consensus estimates by around 19%. Despite the strong Q3 report, which demonstrated triple-digit growth, the news failed to generate significant movement on Wall Street, leaving the stock trading in a sideways pattern. Despite reporting growth figures rarely seen for a company with a comparable revenue base, Nvidia's stock performance remained stagnant. The stock has consistently fluctuated within the $400-$500 range over the past six months and breaking out of this range in the near term seems challenging given the company's elevated valuation multiple.
As mentioned, the Nvidia share is trading at a notable premium compared to other prominent tech stocks, posing a potential hindrance to any substantial further bullish momentum combined with increasing competition from major tech players. Given this, the market may find alternative opportunities in other major tech companies boasting robust competitive advantages, particularly those introducing their own AI chips and services. Now might be a good time to bet against Nvidia, at least in the short term.
Nvidia (USD), one-year daily chart
Nvidia (USD), five-year weekly chart
Macro comments
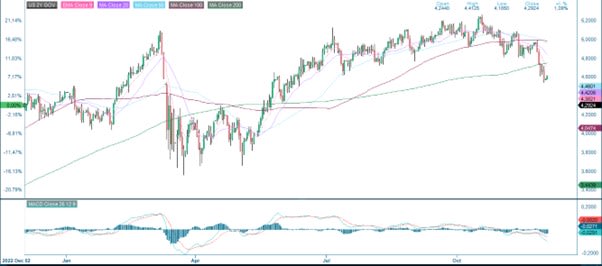
US equity markets rose on Friday, supported by a speech from Powell which was interpreted as dovish. The S&P 500 is trading at July's high. Markets seized on the language that The Fed has raised interest rates well into restrictive territory. However, Powell also said that the latest inflation figures were welcome but that more was needed to reach 2% and that it was too early to speculate on rate cuts. After Powels speech, the market is pricing in a 64% probability of a cut at the March meeting, up from 43% before Powell. Since 18th October, the yield on the US two-year Treasury has fallen from 5.21% to 4.55%.
On Friday the 8th of December, the US employment report for November will be released, with 180K new jobs expected. The annual rolling trend for US payrolls has fallen from around 500K in January 2022 to around 250K in October 2023.
US 2-year Treasury yield (in %), one-year daily chart
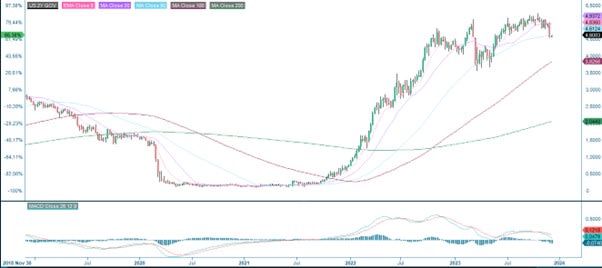
US 2-year Treasury yield (in %), five-year weekly chart
Short term risk has shifted to the downside in the US. Is Europe next?
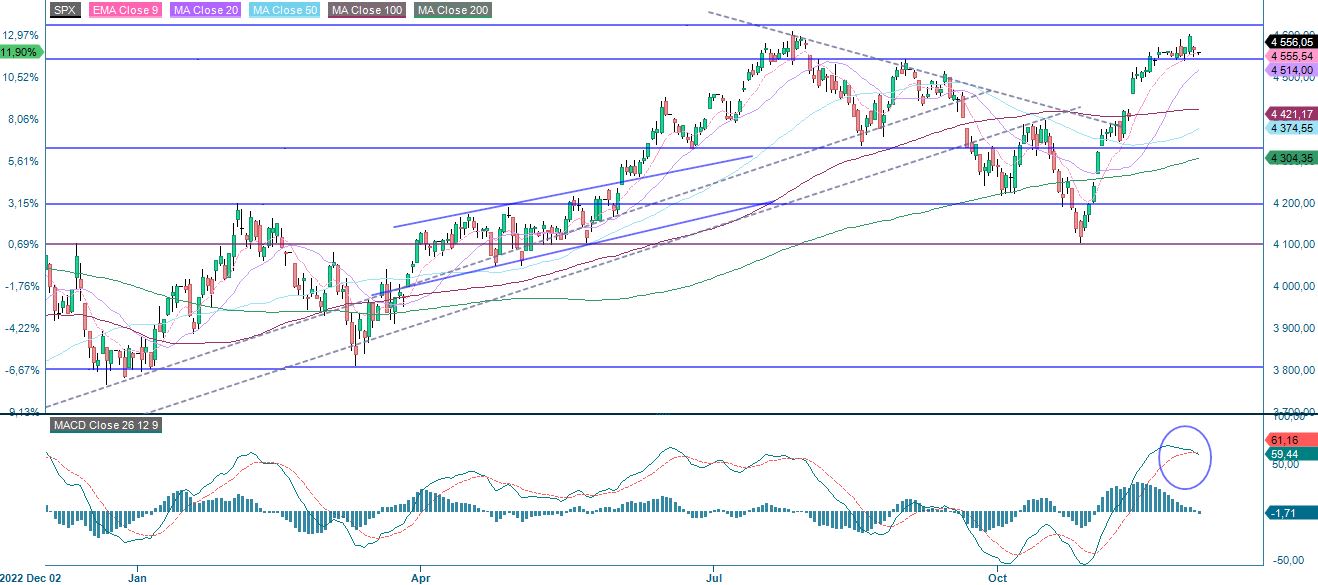
After a strong November rally, risk has shifted to the downside, at least from a technical perspective. This as MACD has generated a soft sell signal for S&P 500 after the index being overbought in terms of indications based on the Relative Strength Index RSI. A break below 4,500 and 4,420 may be next.
S&P 500 (in USD), one-year daily chart
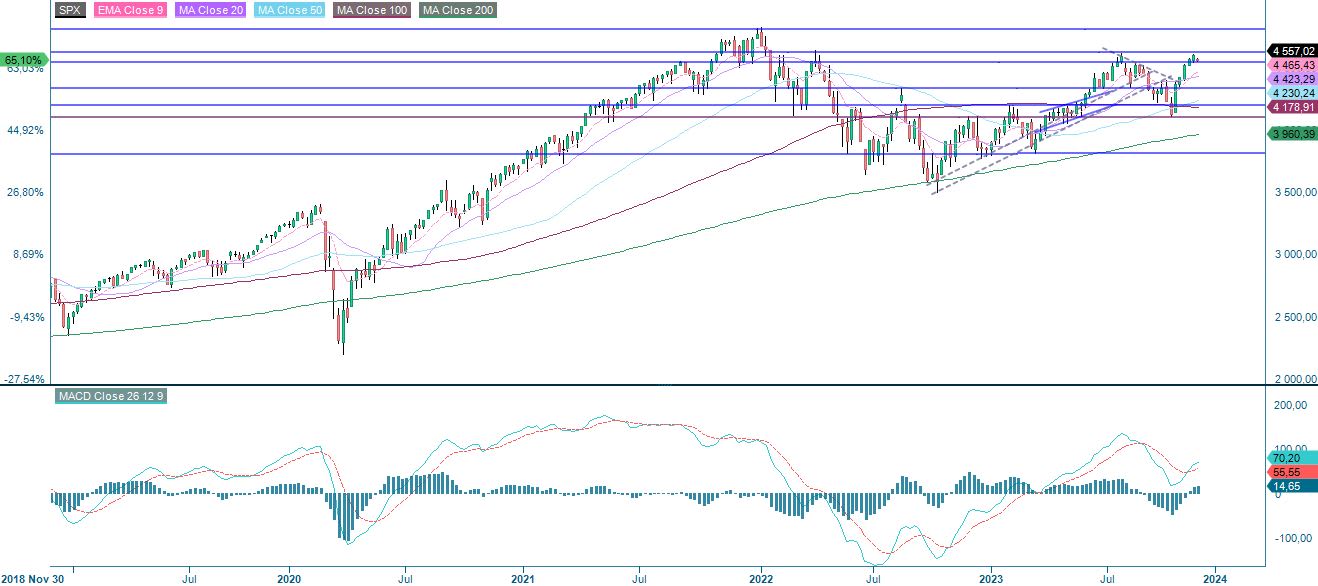
S&P 500 (in USD), weekly five-year chart
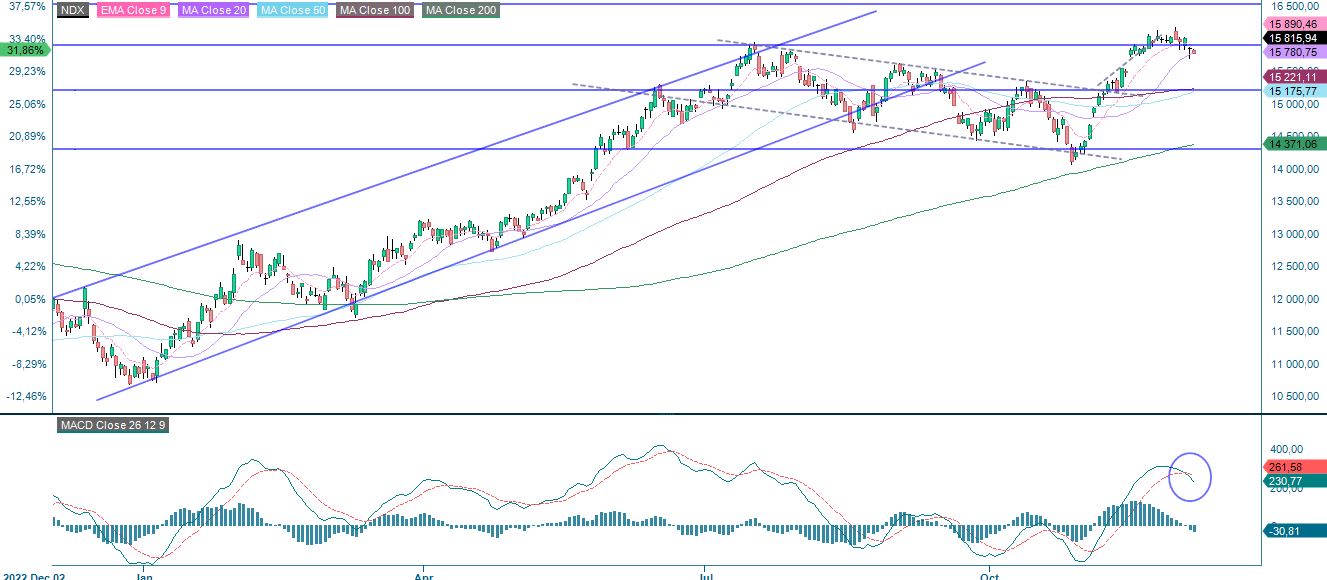
Nasdaq 100 is currently trading just at resistance med up by MA20, currently at 15,780. A break on the downside and 15,530 may be next. This would represent a closing of the gap since 14 November.
Nasdaq 100 (in USD), one-year daily chart
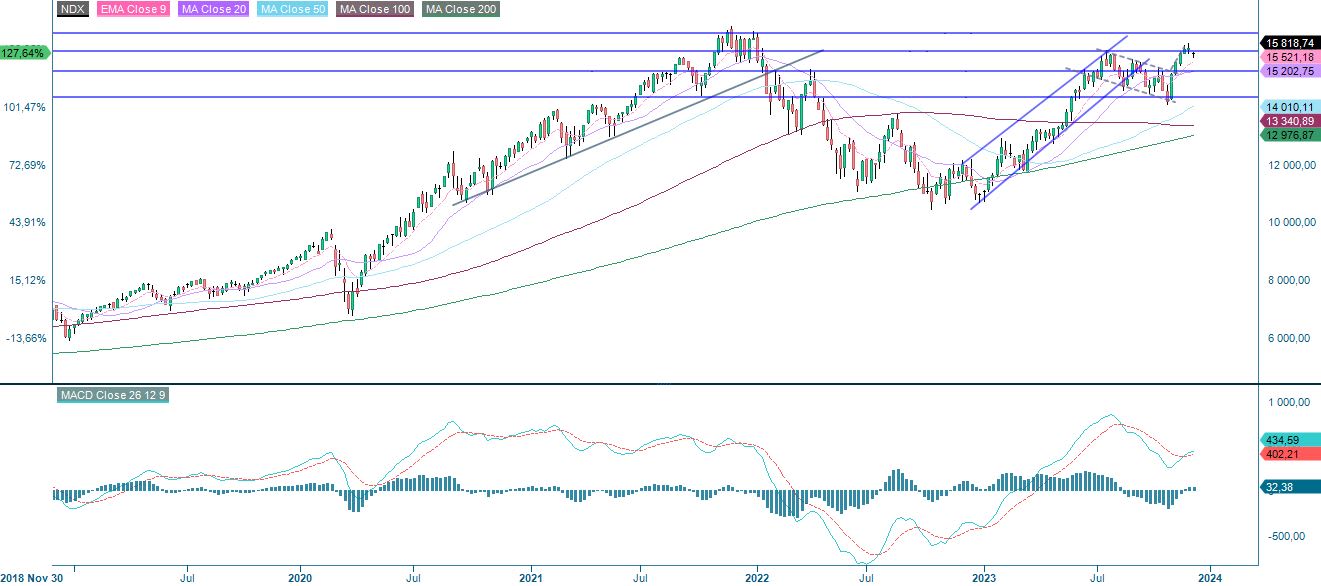
Nasdaq 100 (in USD), weekly five-year chart
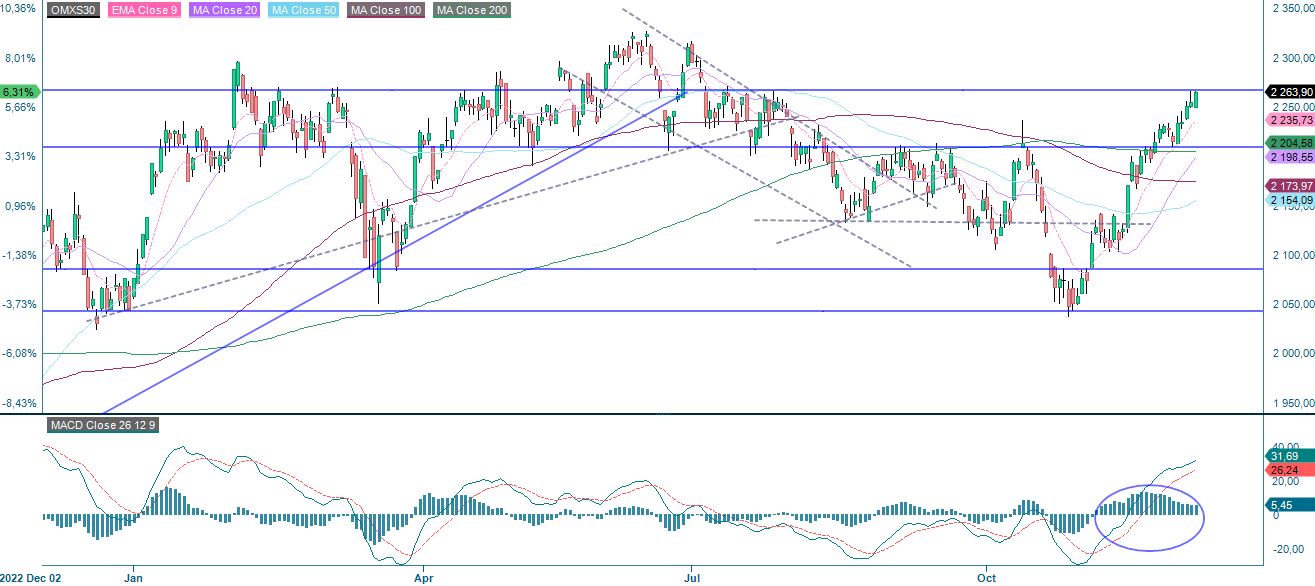
OMXS30 has been rallying the last few days and is currently at resistance while RSI is at overbought levels. Momentum is declining as illustrated by falling MACD histogram. Will risk shift to the downside even for OMXS30?
OMXS30 (in SEK), one-year daily chart
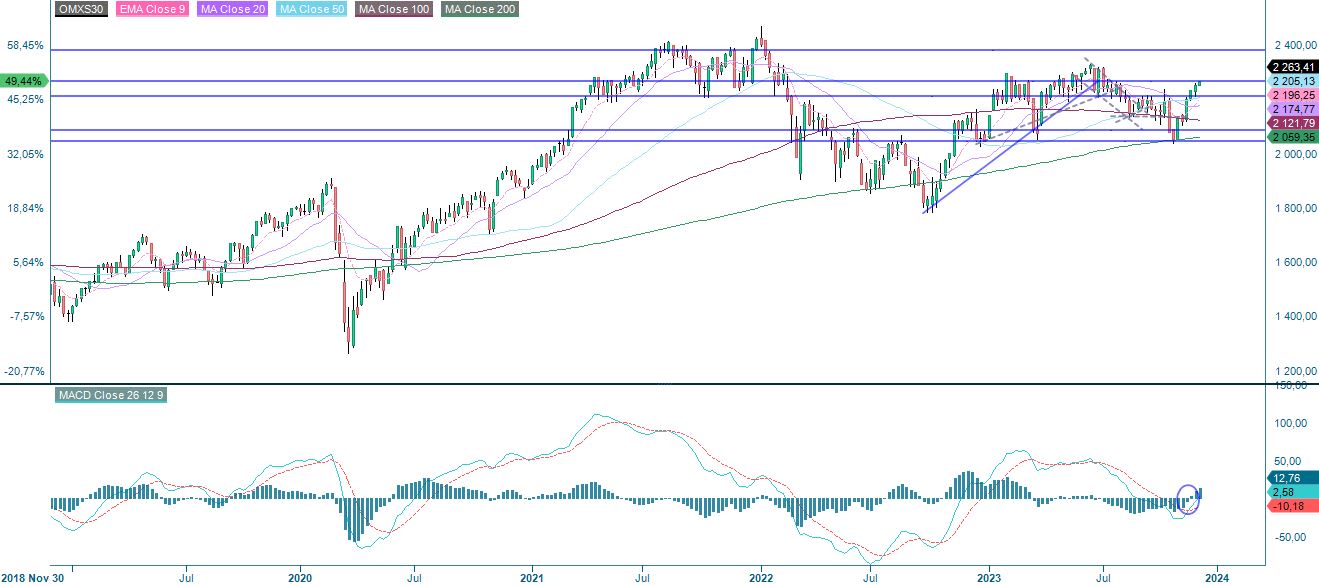
OMXS30 (in SEK), weekly five-year chart
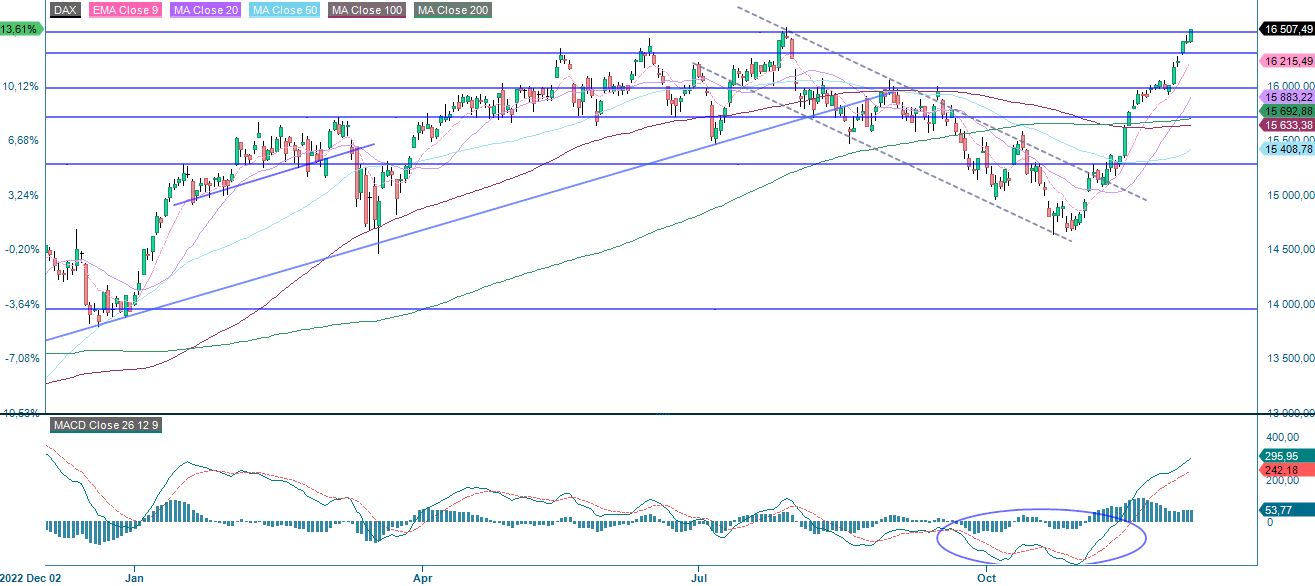
DAX has almost gone bananas strong and is currently trading close to an all-time high. Again, RSI is at overbought level and risk at these levels should be on the downside.
DAX (in EUR), one-year daily chart
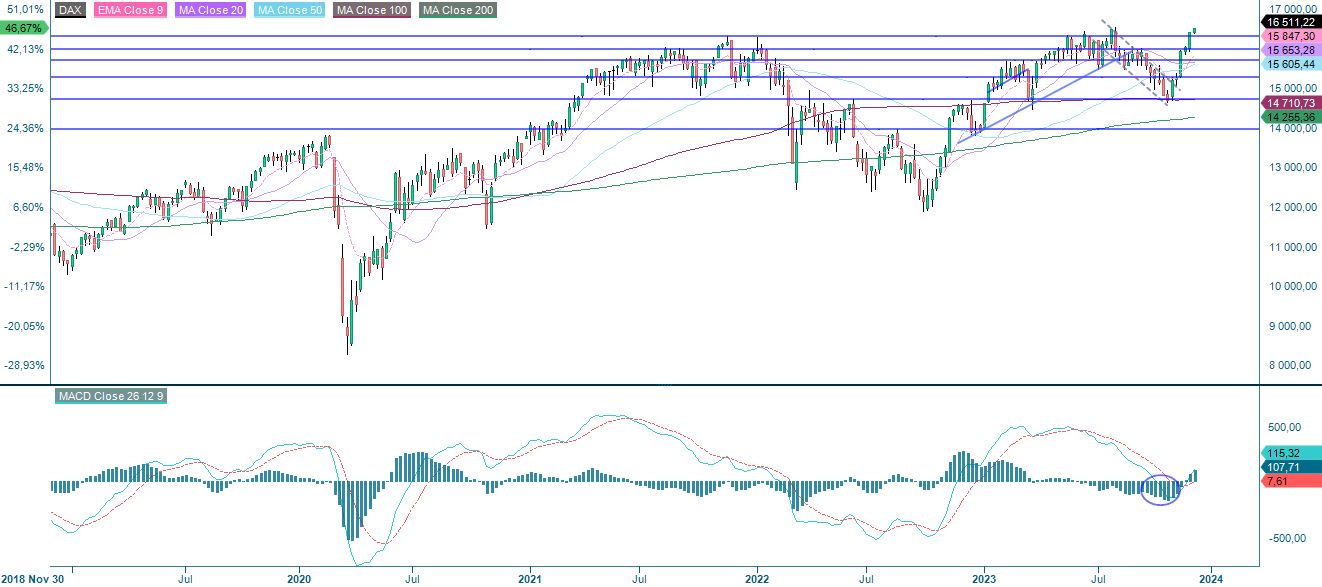
DAX (in EUR), weekly five-year chart
The full name for abbreviations used in the previous text:
EMA 9: 9-day exponential moving average
Fibonacci: There are several Fibonacci lines used in technical analysis. Fibonacci numbers are a sequence in which each successive number is the sum of the two previous numbers.
MA20: 20-day moving average
MA50: 50-day moving average
MA100: 100-day moving average
MA200: 200-day moving average
MACD: Moving average convergence divergence
Risks
Disclaimer:
This information is neither an investment advice nor an investment or investment strategy recommendation, but advertisement. The complete information on the trading products (securities) mentioned herein, in particular the structure and risks associated with an investment, are described in the base prospectus, together with any supplements, as well as the final terms. The base prospectus and final terms constitute the solely binding sales documents for the securities and are available under the product links. It is recommended that potential investors read these documents before making any investment decision. The documents and the key information document are published on the website of the issuer, Vontobel Financial Products GmbH, Bockenheimer Landstrasse 24, 60323 Frankfurt am Main, Germany, on prospectus.vontobel.com and are available from the issuer free of charge. The approval of the prospectus should not be understood as an endorsement of the securities. The securities are products that are not simple and may be difficult to understand. This information includes or relates to figures of past performance. Past performance is not a reliable indicator of future performance.
External author:
This information is in the sole responsibility of the guest author and does not necessarily represent the opinion of Bank Vontobel Europe AG or any other company of the Vontobel Group. The further development of the index or a company as well as its share price depends on a large number of company-, group- and sector-specific as well as economic factors. When forming his investment decision, each investor must take into account the risk of price losses. Please note that investing in these products will not generate ongoing income.
The products are not capital protected, in the worst case a total loss of the invested capital is possible. In the event of insolvency of the issuer and the guarantor, the investor bears the risk of a total loss of his investment. In any case, investors should note that past performance and / or analysts' opinions are no adequate indicator of future performance. The performance of the underlyings depends on a variety of economic, entrepreneurial and political factors that should be taken into account in the formation of a market expectation.
Credit risk of the issuer:
Investors in the products are exposed to the risk that the Issuer or the Guarantor may not be able to meet its obligations under the products. A total loss of the invested capital is possible. The products are not subject to any deposit protection.
Market risk:
The value of the products can fall significantly below the purchase price due to changes in market factors, especially if the value of the underlying asset falls. The products are not capital-protected
Risk with leverage products:
Due to the leverage effect, there is an increased risk of loss (risk of total loss) with leverage products, e.g. Bull & Bear Certificates, Warrants and Mini Futures.
Currency risk:
If the product currency differs from the currency of the underlying asset, the value of a product will also depend on the exchange rate between the respective currencies. As a result, the value of a product can fluctuate significantly.