More energy needed for continued stock market recovery

This week's case in point is Bayer, which could surprise on the upside after a series of disappointments. The rally in US equities has broadened, with new triggers in addition to lower interest rates needed for the rally to continue.
Case of the week: Should BAYERs beware?
Bayer AG has had a tumultuous year with the share dropping over 30% YTD. The company recently got hit with a two-punch knockout that came in the form of a cancelled phase III study and USD 1.56 billion in settlement fees from a legal battle in Missouri, USA. The company is under a lot of pressure, but, with a relatively new CEO, a reversal might be incoming.
Bayer AG is a global life science company that operates through three business segments: Crop Science, Pharmaceuticals and Consumer Health. The first offers chemical and biological crop protection products like pesticides. The second category focuses on prescription products, mainly for cardiology and women’s health, but also within specialty therapeutics in oncology, hematology and more. The third business area focuses on nonprescription and over-the-counter drugs in areas like skincare and nutritional supplements.
Bayer AG shares have been choppy following a couple of distressing headlines. First off, Bayer retracted their oncology drug Aliqopa from the US market. After being approved under the accelerated approval scheme in 2017 as third line treatment for adults with refractory follicular lymphoma, the drug failed a study, causing the removal.
Six days after the removal, it was announced that Bayer terminated their phase III-study Ocean-Stroke, investigating the efficacy of asundexians in patients with atrial fibrillation at risk of stroke. The recommendation came from an independent data-oversight committee, which noted that efficacy was below the control arm. On the same day, Bayer lost a legal battle in Missouri, USA. The main ingredient of Roundups, glyphosate, has long been in the crosshairs of farmers claiming it causes cancers. After nine straight legal wins, Bayer have, as of recently, started losing, with the latest being the fourth in a row. The loss means Bayer will need to pay USD 1.56 billion in damages. The pile-up of bad news has caused the share to slide, dropping to over 30% in three months. Further woes came from Moody’s, with the credit rating prospects changed from stable to negative, reiterating their Baa2 rating.
There are several reasons why the Bayer share has dropped. However, it is possible that markets have overreacted. The hot-hand fallacy might originally have led investors to believe Bayer would continue to win court cases. Now, four losses in a row, the pendulum might have swung the other way, with investors expecting continued legal troubles. The European Union just extended the approval of the usage of glyphosate by another ten years, highlighting the continued demand. Thus, a legal win could have a bigger than expected positive effect on the share price. Furthermore, there is always the possibility of spinning off businesses, e.g., the Crop Science segment. This would allow Bayer to remove a lot of legal risk as well as deleveraging the business. With a relatively new CEO, Bayer is more likely to be able to enact drastic change, like spinning off a part of the business. Thus, the Bayer share might be oversold, with potential for a bounce upward in the coming months should the CEO be able to get through a major strategic shift or if legal fortunes turn.
Bayer (EUR), one-year daily chart

Bayer (EUR), five-year weekly chart

Macro comments
The stock market rally has recently broadened, which is encouraging. A few tech giants drove the US stock market boom, now more stocks are showing strength. Currently, around 54% of the companies in the S&P 500 index are trading above their 200-day moving average. This compares with only 10% a month ago. For the stock market to continue rising, it is positive that more stocks are now contributing to the to the rise. In our view, the rise in the S&P500 is mainly linked to lower interest rates in the United States.
Investors' risk appetite has increased somewhat as of lately, but not by much. The HYG ETF (graph below), which mirrors US junk bonds, has recovered somewhat but is still at historic lows.
HYG ETF in the US (USD), five-year weekly chart

The Euro-zone Consumer Price Index (CPI) for November and the US Personal Consumer Expenditures (PCE) for October will be published on Thursday 30th November. These figures will be important for interest rates and therefore for the stock market.
Salesforce and Dell will report their quarterly results today, Wednesday 29 November and Thursday 30 November respectively.
Stuck at resistance as new triggers are needed
US 10-year Treasury yields are consolidating, while the 2-year Treasury yield is coming down in small steps. This have not been enough for the rally to continue while the Relative Price Index (RSI) still indicates that the index is around overbought levels. New triggers are needed for the index to move.
S&P 500 (in USD), one-year daily chart

S&P 500 (in USD), weekly five-year chart

The same applies to Nasdaq 100.
Nasdaq 100 (in USD), one-year daily chart
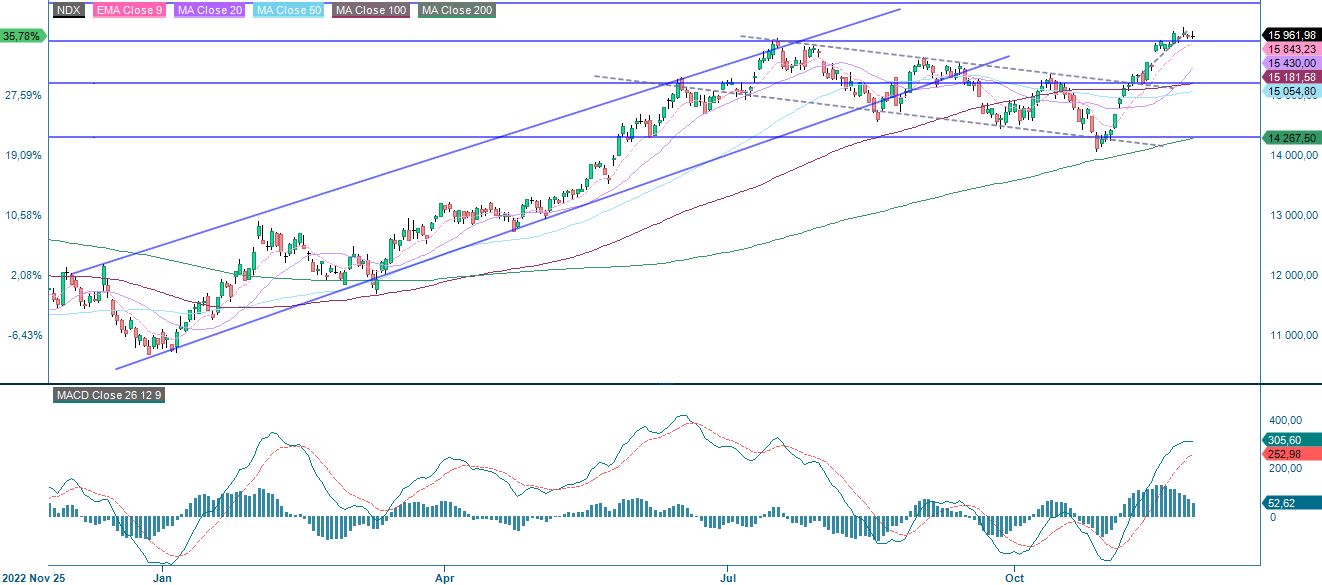
Nasdaq 100 (in USD), weekly five-year chart

OMXS30 has broken up above MA200 but is currently losing steam. As for the US equity indices, a trigger is needed for the strong rally to continue.
OMXS30 (in SEK), one-year daily chart

OMXS30 (in SEK), weekly five-year chart

DAX got stuck resistance and is losing steam. EMA9, currently at 15,878 serves as first support on the downside.
DAX (in EUR), one-year daily chart

DAX (in EUR), weekly five-year chart

The full name for abbreviations used in the previous text:
EMA 9: 9-day exponential moving average
Fibonacci: There are several Fibonacci lines used in technical analysis. Fibonacci numbers are a sequence in which each successive number is the sum of the two previous numbers.
MA20: 20-day moving average
MA50: 50-day moving average
MA100: 100-day moving average
MA200: 200-day moving average
MACD: Moving average convergence divergence
Risks
External author:
This information is in the sole responsibility of the guest author and does not necessarily represent the opinion of Bank Vontobel Europe AG or any other company of the Vontobel Group. The further development of the index or a company as well as its share price depends on a large number of company-, group- and sector-specific as well as economic factors. When forming his investment decision, each investor must take into account the risk of price losses. Please note that investing in these products will not generate ongoing income.
The products are not capital protected, in the worst case a total loss of the invested capital is possible. In the event of insolvency of the issuer and the guarantor, the investor bears the risk of a total loss of his investment. In any case, investors should note that past performance and / or analysts' opinions are no adequate indicator of future performance. The performance of the underlyings depends on a variety of economic, entrepreneurial and political factors that should be taken into account in the formation of a market expectation.
Disclaimer:
This information is neither an investment advice nor an investment or investment strategy recommendation, but advertisement. The complete information on the trading products (securities) mentioned herein, in particular the structure and risks associated with an investment, are described in the base prospectus, together with any supplements, as well as the final terms. The base prospectus and final terms constitute the solely binding sales documents for the securities and are available under the product links. It is recommended that potential investors read these documents before making any investment decision. The documents and the key information document are published on the website of the issuer, Vontobel Financial Products GmbH, Bockenheimer Landstrasse 24, 60323 Frankfurt am Main, Germany, on prospectus.vontobel.com and are available from the issuer free of charge. The approval of the prospectus should not be understood as an endorsement of the securities. The securities are products that are not simple and may be difficult to understand. This information includes or relates to figures of past performance. Past performance is not a reliable indicator of future performance.
Market risk:
The value of the products can fall significantly below the purchase price due to changes in market factors, especially if the value of the underlying asset falls. The products are not capital-protected
Credit risk of the issuer:
Investors in the products are exposed to the risk that the Issuer or the Guarantor may not be able to meet its obligations under the products. A total loss of the invested capital is possible. The products are not subject to any deposit protection.
Currency risk:
If the product currency differs from the currency of the underlying asset, the value of a product will also depend on the exchange rate between the respective currencies. As a result, the value of a product can fluctuate significantly.
Risk with leverage products:
Due to the leverage effect, there is an increased risk of loss (risk of total loss) with leverage products, e.g. Bull & Bear Certificates, Warrants and Mini Futures.