Opec and Saudi Arabia could halt oil price slide

Despite the war between Israel and Hamas, the price of oil has fallen by around 15%. One reason may be that oil sanctioned by the West is still finding its way onto the market. At today's level, oil may be close to bottoming out. Equity markets have received a strong boost from falling interest rates, with the yield on 10-year US Treasuries down 46 basis points since 31 October.
Case of the week: Volatile oil price ahead of OPEC+ meeting
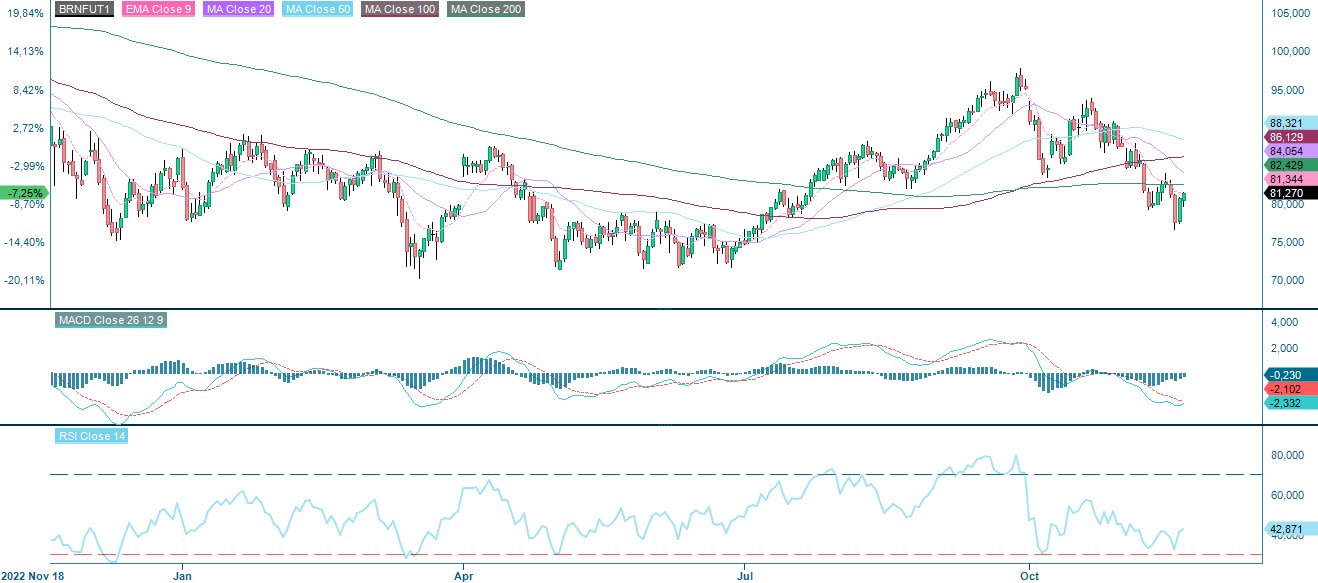
The oil price has fallen rapidly from its Q3 highs of around USD 95 per barrel. Despite the war between Israel and Hamas, lower interest rates and a weaker USD, the price has fallen by 20% (down 15% after a recent bounce back). One possible explanation is that the conflict in the Middle East so far has not escalated beyond Israel and Gaza. The actual war zone does not represent any major oil production. The fact that Hamas is supported by Iran, which is an enemy of Saudi Arabia, may have meant that the latter did not want to support Hamas beyond words and sympathy for the civilian population in Gaza. Speculative buying of oil following the initial days of the crisis might subsequently have been liquidated.
Also, supply in 2023 has been less constrained than feared. It appears that a lot of sanctioned oil from, e.g., Iran, has nevertheless found its way to the market to compensate for OPEC production cuts. At the same time, the US has not enforced existing sanctions, possibly because of inflation concerns. In recent weeks, US inventories have also increased more rapidly than expected, albeit from historically low levels.
For the last few years, the oil price has been in backwardation, i.e., spot prices are higher than futures prices. This is the opposite of the normal so-called contango pattern. Backwardation normally reflects expectations of a short-term supply shortfall, as in the spring of 2022. According to Marketwatch, Backwardation has often been considered a bullish sign historically, although the track record is not perfect.
Oil price (Brent), forward curve (USD per barrel): slightly lower prices expected

While the outlook for 2024 is still cloudy, one can nonetheless suspect that, for now, oil prices are approaching a bottom. In the current geopolitical environment, sanctions, “weaponizing” of energy supply and terrorist attacks on energy infrastructure are clear risks which might impact prices in the short term. The OPEC+ meeting on 26 November is a possible near-term inflection point. As the oil price has dropped, there might be initiatives to defend prices and, e.g., signal further production cuts on this occasion. The level of USD 80 per barrel has often been cited as crucial for Saudi Arabia. As oil remains below MA200, high volatility may be likely in the short term.
Related Products
Brent oil (USD per barrel), one-year daily chart
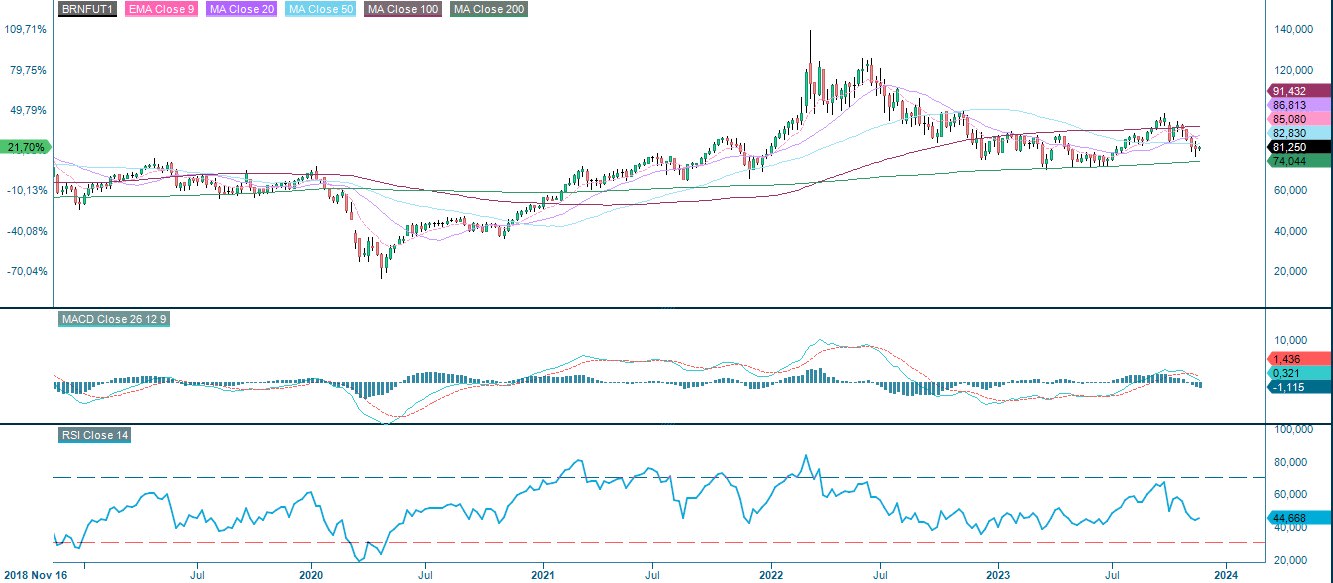
Brent oil (USD per barrel), five-year weekly chart
Macro comments
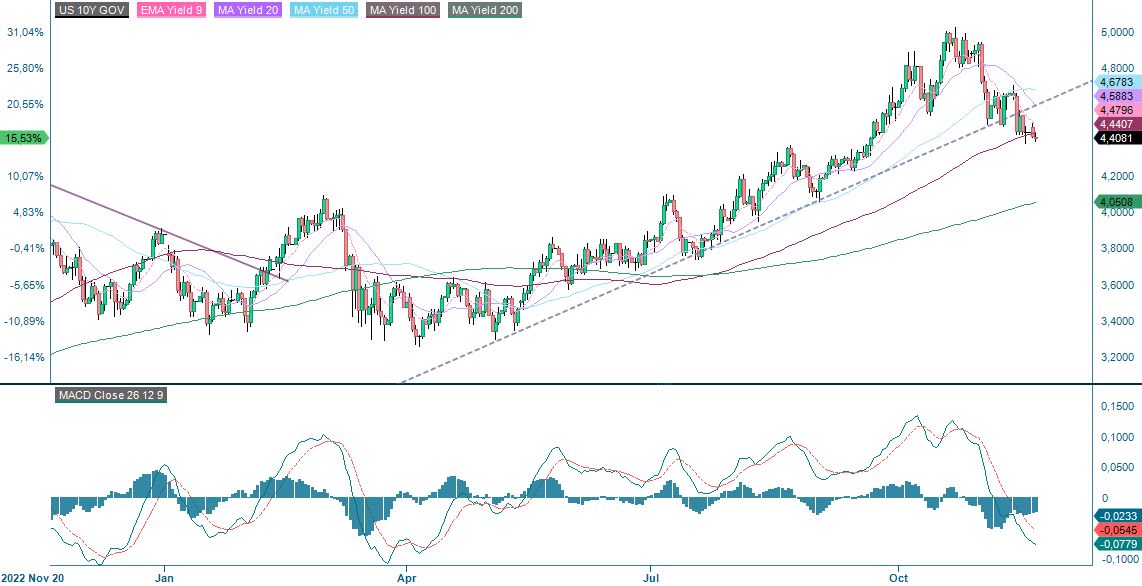
Markets continue to be driven by expectations of future Fed tapering, which is putting pressure on the US dollar and supporting equity markets, including in Asia, as well as the rise in certain commodity prices. According to the futures market, there is a 30% probability that the Fed will cut rates in March 2024. Since 31 October 2023, the yield on ten-year US Treasuries has fallen 46 basis points. The ten-year US Treasury yield is testing support:
US 10-year Treasury yield, one-year daily chart
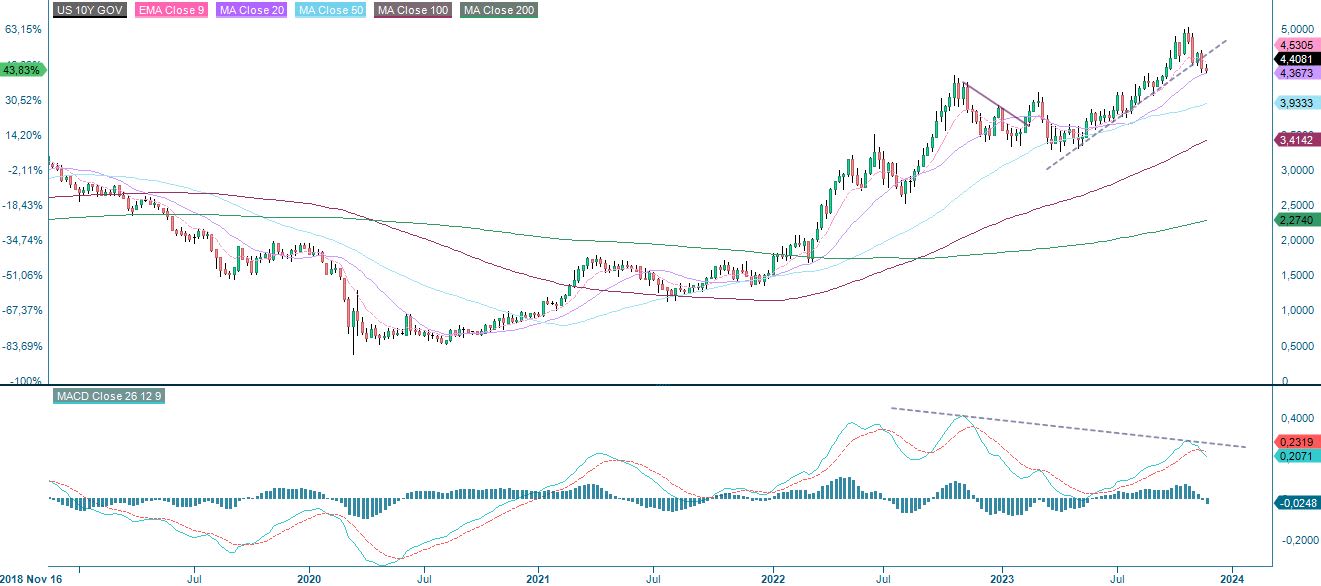
US 10-year Treasury yield, five-year weekly chart
Not surprisingly, there has been positive momentum in most stock indices over the past month and especially in the last week as market interest rates have fallen in the US and Europe.
Significant stock indices performance in one month, this year and five months

As of Friday 17 November, 94% of S&P 500 companies have reported their third quarter results. 82% of S&P companies have reported a positive Earnings-per-Share (EPS) surprise, while 62% have reported a positive revenue surprise. The best performing S&P 500 sectors are Commercial Services and Information Technology with 91% of Q3 earnings beating estimates, followed by Consumer Staples with 87% of Q3 earnings beating estimates. The worst performing sectors are Real Estate, Energy and Materials with 68%, 74% and 76% of their Q3 earnings beating expectations respectively.
For Q4 2023, 64 S&P 500 companies have issued negative EPS guidance and 32 companies have issued positive EPS guidance.
Deere Company reports fourth quarter earnings today, Wednesday 22 November.
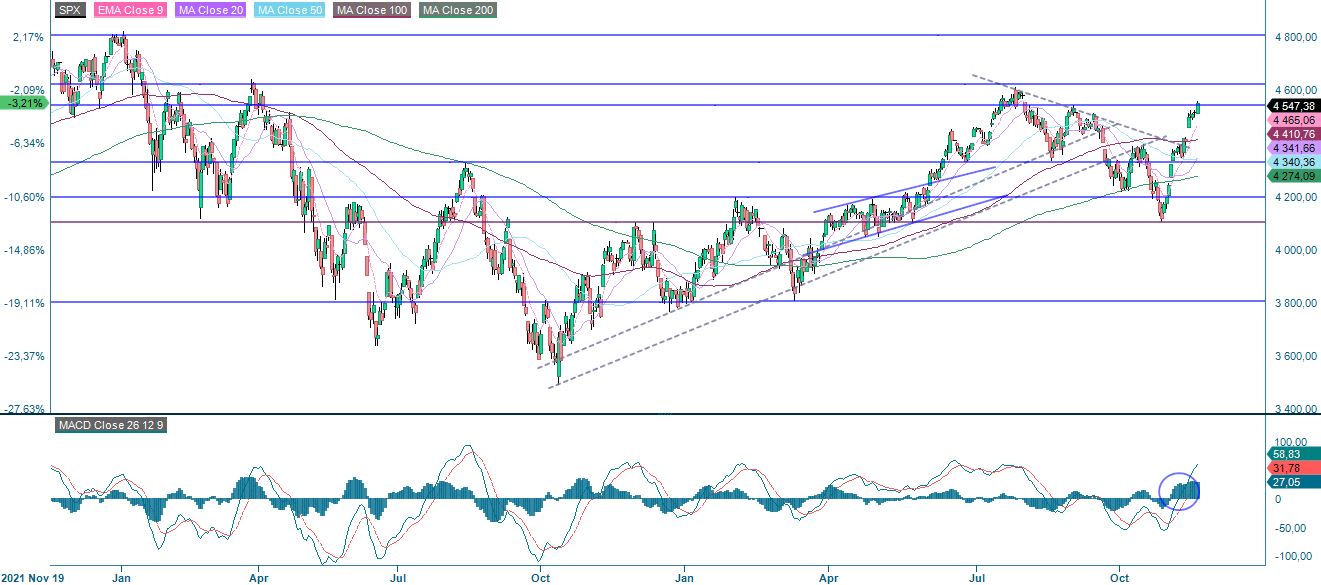
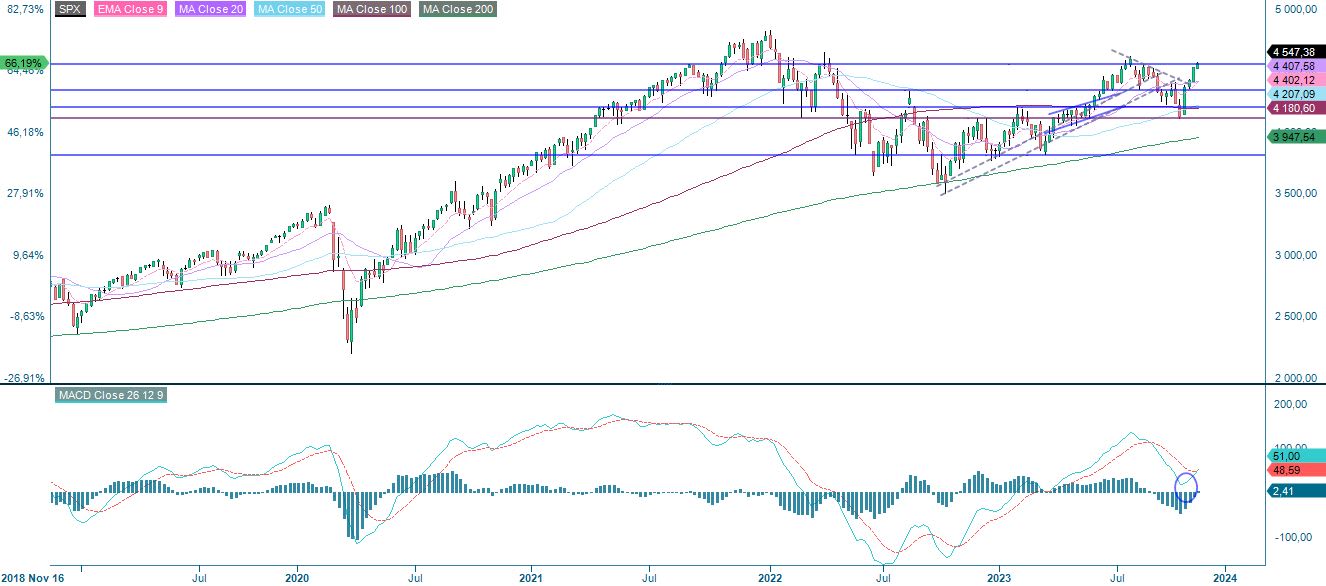
Highs from 2021/22 in sight
S&P 500 is testing resistance between 4,550 and 4,625. However, the Relative Strength Index RSI indicates that the index is overbought. Some consolidation may be in the cards. But if rates continue to fall, a break above could occur and the highs from 2021/2022 around 4,000 may be tested.
S&P 500 (in USD), two-year daily chart
S&P 500 (in USD), weekly five-year chart
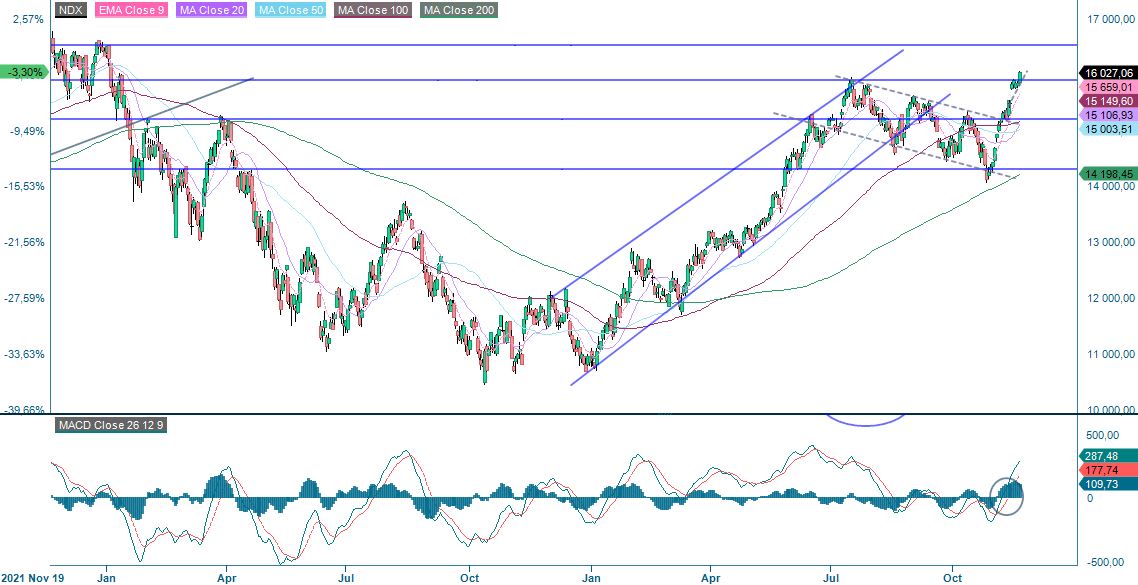
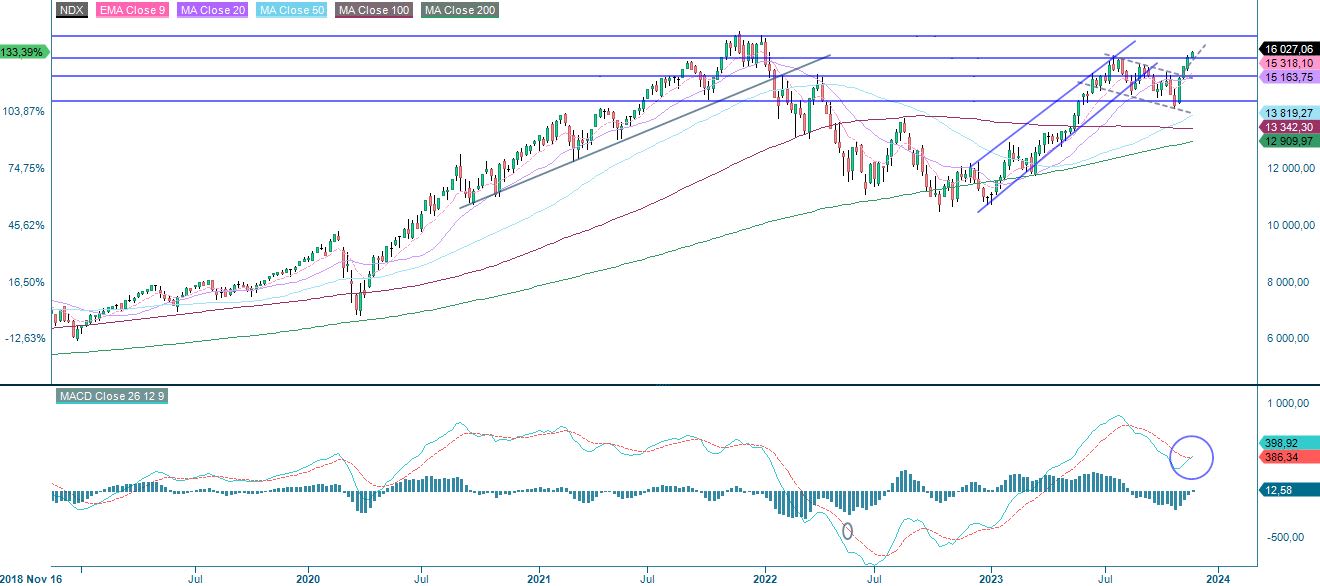
Nasdaq 100 is currently trading above resistance around 15,800. The next level on the upside is found 16,500. Again, RSI is indicating overbought conditions.
Related Products
Nasdaq 100 (in USD), two-year daily chart
Nasdaq 100 (in USD), weekly five-year chart
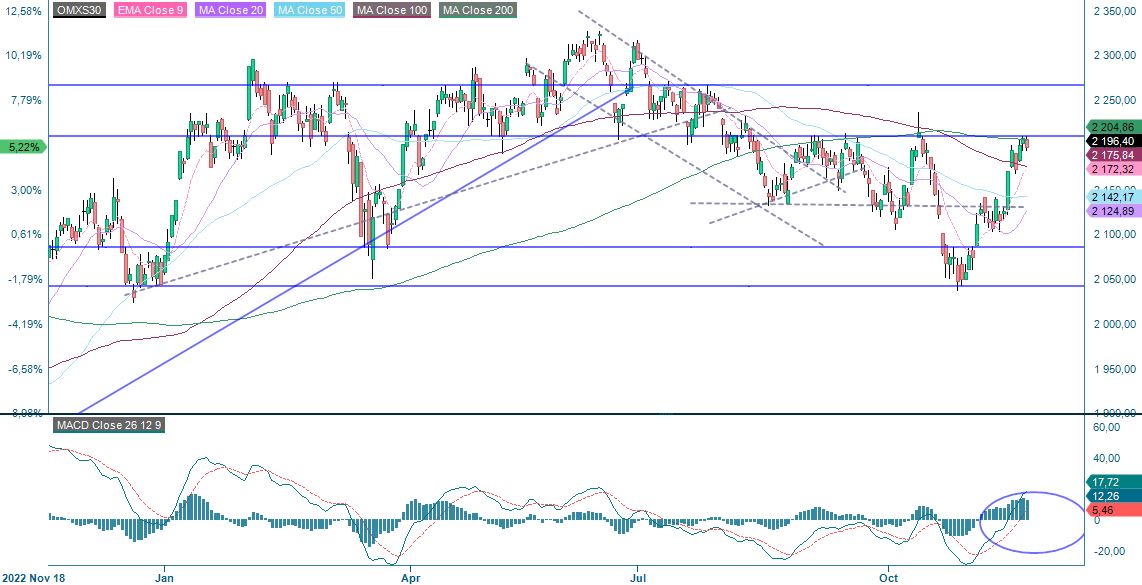
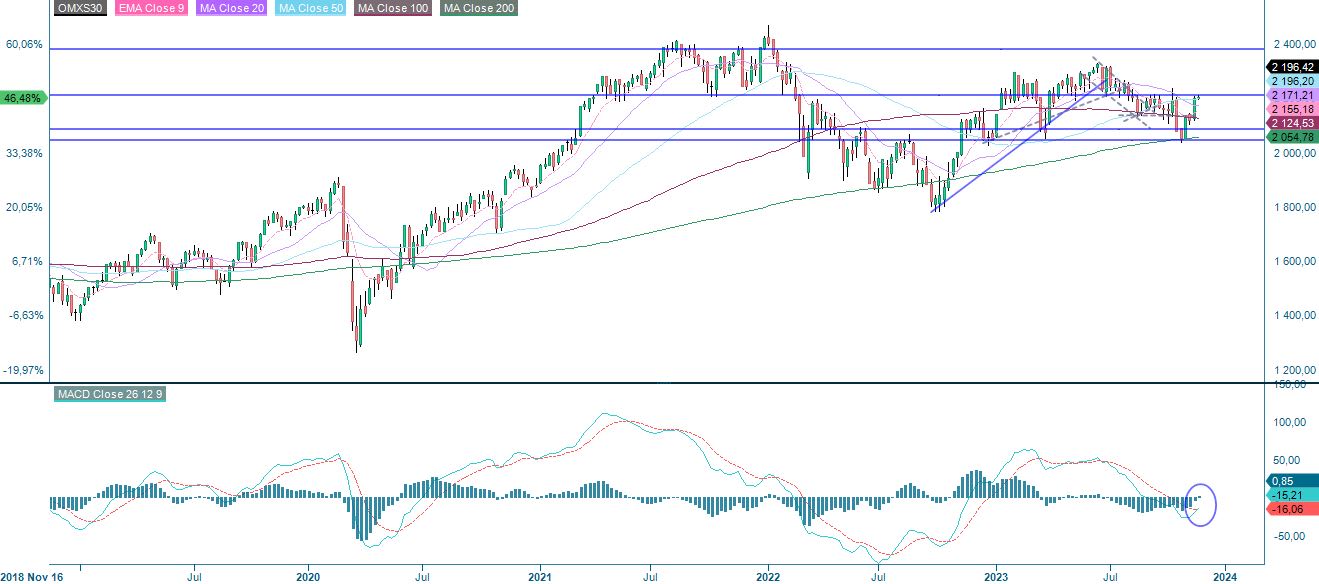
OMXS30 is testing resistance made up of MA200 currently at levels just above 2,200. A break above and 2,265 may be next. Note that MACD in the weekly chart has generated a soft buy signal.
OMXS30 (in SEK), one-year daily chart
OMXS30 (in SEK), weekly five-year chart
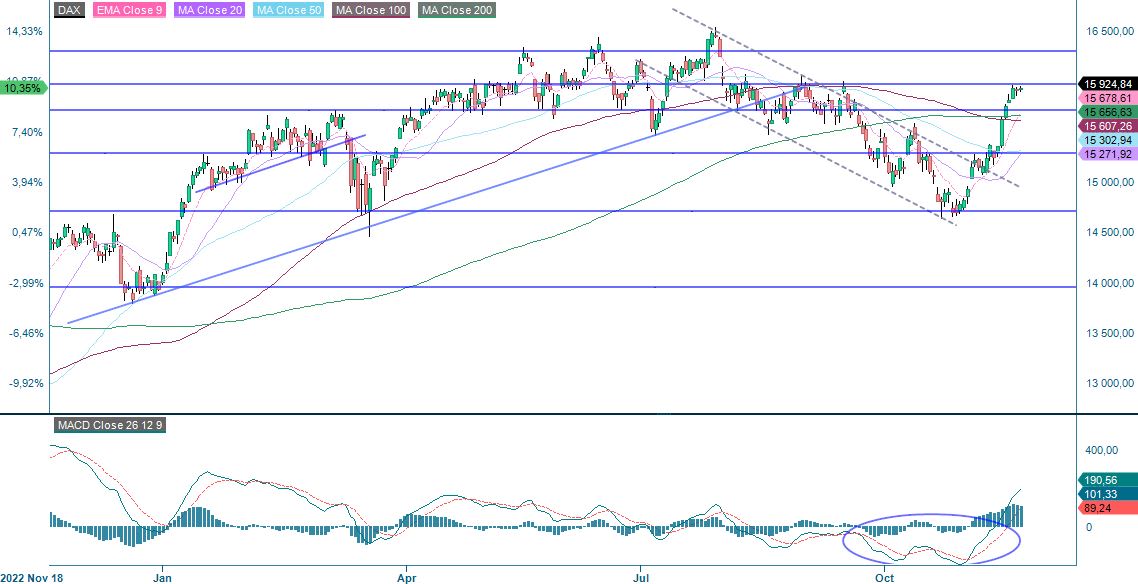
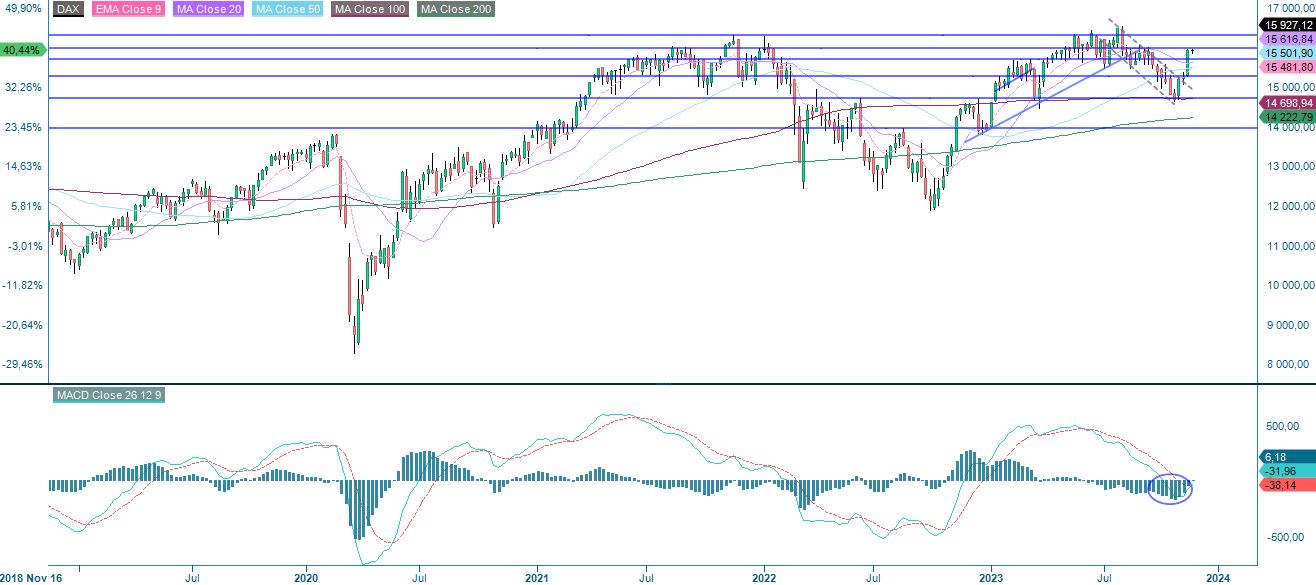
DAX is also at resistance. A break on the upside and levels around 16,400 may be next.
DAX (in EUR), one-year daily chart
DAX (in EUR), weekly five-year chart
The full name for abbreviations used in the previous text:
EMA 9: 9-day exponential moving average
Fibonacci: There are several Fibonacci lines used in technical analysis. Fibonacci numbers are a sequence in which each successive number is the sum of the two previous numbers.
MA20: 20-day moving average
MA50: 50-day moving average
MA100: 100-day moving average
MA200: 200-day moving average
MACD: Moving average convergence divergence
Risks
External author:
This information is in the sole responsibility of the guest author and does not necessarily represent the opinion of Bank Vontobel Europe AG or any other company of the Vontobel Group. The further development of the index or a company as well as its share price depends on a large number of company-, group- and sector-specific as well as economic factors. When forming his investment decision, each investor must take into account the risk of price losses. Please note that investing in these products will not generate ongoing income.
The products are not capital protected, in the worst case a total loss of the invested capital is possible. In the event of insolvency of the issuer and the guarantor, the investor bears the risk of a total loss of his investment. In any case, investors should note that past performance and / or analysts' opinions are no adequate indicator of future performance. The performance of the underlyings depends on a variety of economic, entrepreneurial and political factors that should be taken into account in the formation of a market expectation.
Disclaimer:
This information is neither an investment advice nor an investment or investment strategy recommendation, but advertisement. The complete information on the trading products (securities) mentioned herein, in particular the structure and risks associated with an investment, are described in the base prospectus, together with any supplements, as well as the final terms. The base prospectus and final terms constitute the solely binding sales documents for the securities and are available under the product links. It is recommended that potential investors read these documents before making any investment decision. The documents and the key information document are published on the website of the issuer, Vontobel Financial Products GmbH, Bockenheimer Landstrasse 24, 60323 Frankfurt am Main, Germany, on prospectus.vontobel.com and are available from the issuer free of charge. The approval of the prospectus should not be understood as an endorsement of the securities. The securities are products that are not simple and may be difficult to understand. This information includes or relates to figures of past performance. Past performance is not a reliable indicator of future performance.
Credit risk of the issuer:
Investors in the products are exposed to the risk that the Issuer or the Guarantor may not be able to meet its obligations under the products. A total loss of the invested capital is possible. The products are not subject to any deposit protection.
Market risk:
The value of the products can fall significantly below the purchase price due to changes in market factors, especially if the value of the underlying asset falls. The products are not capital-protected
Risk with leverage products:
Due to the leverage effect, there is an increased risk of loss (risk of total loss) with leverage products, e.g. Bull & Bear Certificates, Warrants and Mini Futures.