Relative strength and weakness


Identifying stocks displaying relative strength or weakness can bring interesting opportunities for traders.
There are countless setups traders can look for in the market to find situations with good risk/reward. Most of these involve looking at a share, index or commodity in isolation. Price behavior is then studied according to technical and quantitative criteria, with the aim of finding good entry points for new long or short positions.
But you can also find interesting setups by studying the behavior of stocks in relation to each other or compared to an index. Then it is often relative strength or relative weakness that you look for. Relative simply means "seen in relation to". Relative strength then refers to stocks which for a period have a stronger price behavior than the index, while relative weakness means the opposite. These stocks then become good candidates for long or short positions, respectively. This way of thinking can work well both for finding short-term trades and for longer-term swing trading, depending on which timeframe the individual trader is most comfortable with.
What is behind a security showing relative strength or weakness in relation to the overall market? It can be many things. Sometimes there are clearly identifiable news stories that affect the individual company or sector, while at other times it can be difficult to find any cause. For a trader, it doesn't necessarily mean that much to be able to know the reason, as the most important thing is to observe that this behavior is actually present. Knowledge of a cause can, however, be an advantage, as this can give clues about how long the stronger or weaker development can be expected to last.
For my part, I have realized that I prefer to handle short-term positions and will therefore bring out an example of how these can be found. It starts with the actual selection of stocks you follow. For trading, it is an advantage that the shares are both liquid (have a high turnover) and have significant daily fluctuations. On my computer screens, I have an overview of the indices, as well as a selection of relevant shares. At the time of writing, e.g. the NASDAQ 100 index have had daily fluctuations of 2.2% over the past 30 trading days. Of the larger shares included in the index, Apple, Microsoft, and Google have fluctuated daily by approx. 2.8%, Amazon 3.5%, Nvidia 4% and Tesla a whopping 6%. All of these are interesting trading stocks, but with trader-eyes we see that Nvidia and Tesla are the ones that can be expected to make the biggest moves.
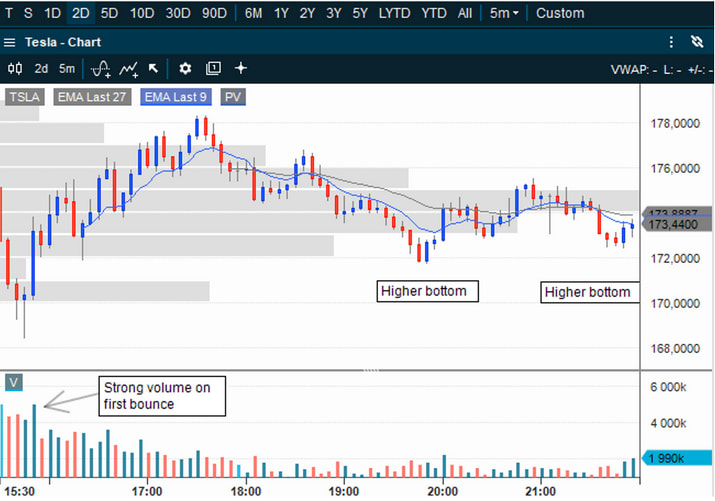
As mentioned, relative strength and weakness can be observed over both shorter and longer time periods. The example below is from Friday 10 March 2023. Tesla had then performed significantly weaker than the NASDAQ 100 index over the past couple of weeks. The stock is down approx. 15% since 28 February, while the index is down to just under 2%. On Thursday, Tesla had a particularly large drop, and closed at today's low. All in all, there was nothing to indicate any greater strength in the share on Friday, with the exception that the share could perhaps be ripe for a rebound after such a significant downmove. The overall market was weak on Friday at the start of trading in the US, but interestingly we saw different behavior in Tesla. The chart below shows an ETF that follows the NASDAQ 100 index, and TSLA shown on the same time axis. Both with 5 minute candlesticks.
Examples:
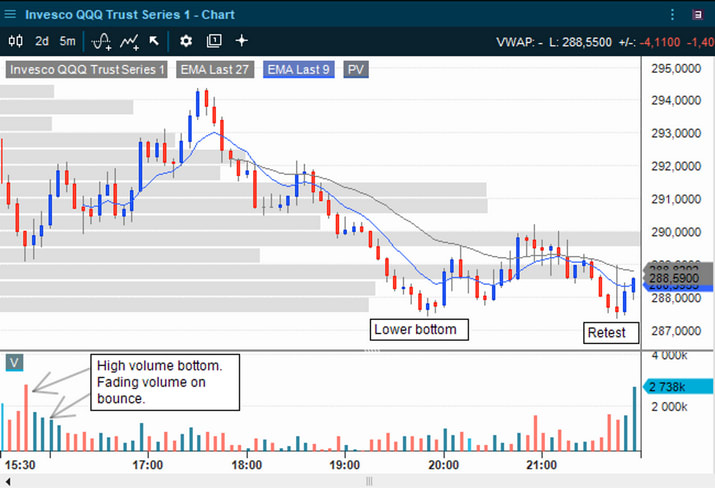
We see here that both the NASDAQ 100 index and TSLA set a new low at 15:45. After that, however, their behavior began to deviate. The index had increasing volume down towards the first bottom and large volume on this one. The index then corrected upwards on falling volume and took a long time to catch up to its opening price for the day. This was not particularly strong price behavior.
Tesla showed mixed volume on the initial drop, but from the first bottom the stock had a strong reaction with higher volume. This was the first sign of strength in the stock. We then see that the index moved sideways for a while before recovering until just after 17:00. TSLA had a clearer uptrend during this period with clear higher peaks and troughs. Both reached intraday peaks approx. 17:30. Then we also see different price behavior in the two. The index fell back to a new lower daily low approx. 20:00 and re-tested this towards the end of the day. At the same time, TSLA set a higher bottom than earlier in the day, and a marginally higher bottom than this again towards the end of the day. In the charts, we also see overall volume-at-price level shown as horizontal bars. On these, we see that Tesla ended approximately at the price where the largest turnover occurred, while the index ended below the most significant volume columns.
In sum, it must be said that it was a weak day in the market in general, and neither the index nor Tesla were impressively strong. However, after several days of decline, Tesla outperformed the index on a weak day, and this is what should attract at traders interest. Intraday traders can notice such tendencies already on the same day and take positions. Such behavior also makes the stock a prime candidate for a trade the following day. It has shown that it has a "willingness to bounce" at this level, and if the conditions are right for an upward movement when the next trading day starts, there is a good chance of getting larger percentages in TSLA than in the index.
It must of course be added that there is no guarantee that the same trend will occur the next day, or that you will get a good risk/reward entry. Anything can happen in the market. But for those of us looking for patterns to act on, relative strength or weakness is always interesting. Shares that do not set new lows when the market does or new highs together with the index, can be put under closer scrutiny for a few days. This might be profitable.
Disclaimer: After many years in the brokerage industry I started my own business in 2021. I published the book "Paleo Trading: How to trade like a Hunter-Gatherer” and launched Paleo Capital that manages a hedge fund according to the principles described in the book. I emphasize that nothing written on this blog is to be regarded as personal advice or a concrete call to take positions. Everyone must be responsible for their own decisions and familiarize themselves with the products they use.
[Standard disclaimer]
Risks
External author:
This information is in the sole responsibility of the guest author and does not necessarily represent the opinion of Bank Vontobel Europe AG or any other company of the Vontobel Group. The further development of the index or a company as well as its share price depends on a large number of company-, group- and sector-specific as well as economic factors. When forming his investment decision, each investor must take into account the risk of price losses. Please note that investing in these products will not generate ongoing income.
The products are not capital protected, in the worst case a total loss of the invested capital is possible. In the event of insolvency of the issuer and the guarantor, the investor bears the risk of a total loss of his investment. In any case, investors should note that past performance and / or analysts' opinions are no adequate indicator of future performance. The performance of the underlyings depends on a variety of economic, entrepreneurial and political factors that should be taken into account in the formation of a market expectation.
Disclaimer:
This information is neither an investment advice nor an investment or investment strategy recommendation, but advertisement. The complete information on the trading products (securities) mentioned herein, in particular the structure and risks associated with an investment, are described in the base prospectus, together with any supplements, as well as the final terms. The base prospectus and final terms constitute the solely binding sales documents for the securities and are available under the product links. It is recommended that potential investors read these documents before making any investment decision. The documents and the key information document are published on the website of the issuer, Vontobel Financial Products GmbH, Bockenheimer Landstrasse 24, 60323 Frankfurt am Main, Germany, on prospectus.vontobel.com and are available from the issuer free of charge. The approval of the prospectus should not be understood as an endorsement of the securities. The securities are products that are not simple and may be difficult to understand. This information includes or relates to figures of past performance. Past performance is not a reliable indicator of future performance.