Wild moves in Tesla


The year has started with a huge price increase and enormous trading activity in TSLA.
After reaching its all-time high of 414.66 in November 2021, Tesla stayed at around 300 until the last quarter of 2022. Then began an accelerating fall that culminated in a violent pressure on the stock in December and into the new year. A general fall in technology shares, large insider sales from Tesla CEO Elon Musk, noise surrounding his purchase of Twitter, increasing competition and uncertainty about demand were among the explanatory factors that received a lot of attention daily in social and traditional media. At this time I wrote an article about the company Tesla, which you can read here.
The fall ended with the stock bottoming out at 101.81 on the morning of January 6, and from there a strong upward movement began. As I write this article, TSLA has just completed a day of 11% gains to close at 177.84. 306 million Tesla shares were traded on NASDAQ this Friday, which is twice the average last month, and four times the normal daily turnover through 2022. With an average price of 175, shares were traded for 53 billion dollars, or approximately 530 billion Norwegian/Swedish kroners. To put this in context, it corresponds to roughly half the annual turnover for Oslo Børs OBX or close to 2 months' normal turnover for Sweden's OMXS30. Truly impressive. The large volume in the share on Friday 27/01 was connected with and partly driven by unusually large trading in call options, and we will return to this further down. Turnover in options in the US is sometimes greater than in shares, and under certain conditions they can feed each other through a feedback loop.
Technical trading and risk management
In the case of such fluctuations as Tesla has shown in recent weeks, you will always find someone on social media who has apparently bought at the bottom and benefited from the whole upswing. More often, these are probably the same people who have owned the stock for most of the way down. The truth is that it is not at all easy to trade such movements when dealing sensibly with risk. Let's take a look at the chart of daily prices:
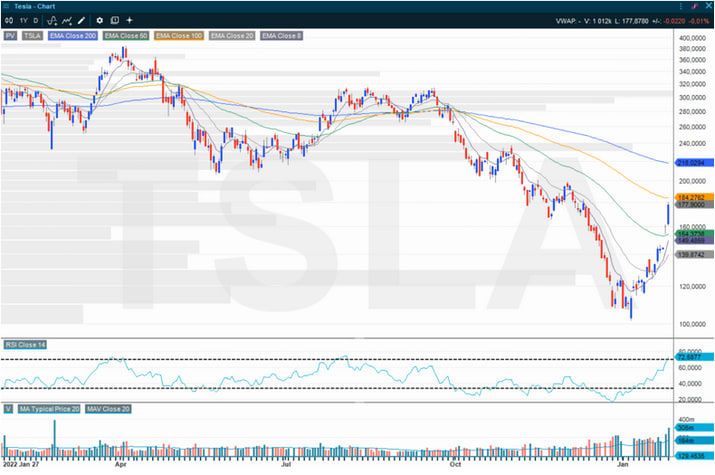
Of the 15 trading days since the stock bottomed at 101.81, there have only been 4 days where the stock has opened higher and continued to rise for most of the day. The other 11 trading days have the share either:
- Opened significantly lower and rose most of the day (1 day).
- Had a significant price jump overnight, fluctuated a lot and ended up close to the opening price (3 days).
- Opened up and fell significantly during the day (2 days).
- Fluctuated a little or a lot throughout the day but ended roughly unchanged (the rest).
The measure for daily fluctuations in the share price (Average True Range - ATR) last 30 days is USD 9.94 or 5.6%. This is a lot for such a large company. By comparison, the daily average movement for the S&P 500 index is about 1.7%. The size of the daily fluctuations has a great impact on how large positions it makes sense to take for a trader who maintains good risk control. See the post about position sizes in trading for more on this. If you use leveraged products to take the position, you must also adjust for this. A list of Vontobel's products with TSLA as underlying can be found here.
A method used by some swing traders is to set stop-loss 1 ATR down from the entry price. If you combine this with a rule to e.g. do not risk more than 1% of the equity on a single trade, these two rules in sum will mean that positions in shares with a high ATR must be kept small compared to those in less volatile shares.
When you look at the chart above, "buy at 102 and sell at 180" looks easy. Kudos to those who have, but I think their numbers are few, maybe zero. Those who want to have a long career in trading must adhere to good risk control rules. So let's see how some of the regular ones would turn out.
Assume in all cases that the sudden reversal from the bottom with a strong blue candlestick gave a buy signal for all traders, and that they bought at the open the following day. The price was then already 118.96, so even then you were a long way from the bottom. The following common swing-trade stop-loss strategies would produce these results:
- Stop-loss on breach of 8-day moving average. (The shortest of the moving averages I use in the chart). This method would have kept you in the position all the way if you used the closing price daily as the outcome criterion and in that case sold in the final minute. Few do this. If you used the corresponding moving average as a running stop-loss throughout the day, you would have been stopped out of the position on 4 occasions.
- Stop-loss 1 ATR down from the last closing price. This method would have kept you in the position throughout the entire movement up.
- Stop-loss on breach of the previous candlestick's lowest price. Here you would have been stopped out of the position on 4 occasions.
We therefore see that for a long-term swing trader the position in the share would have been relatively small, and many of the most used stop-loss methods would have resulted in you being stopped out of the share before it reached 180. The tighter risk control you used; the sooner you would have been stopped out.
A run on options Friday 27th
Let's take a closer look at trading in the stock on January 27, when a special phenomenon occurred. The chart below shows the stock with 20-minute candlesticks, meaning that each bar corresponds to 20 minutes of price action. Friday is marked with a box and I have highlighted some price and volume movements.

While most days we see the largest volume in the stock in the first 20-60 minutes and then a quieter development, last Friday was different. We see several periods of significantly rising volume, and in all cases except for the last 20 minutes this coincided with strong blue candlesticks showing an increase in the price.
American traders I talk to said there was very unusual options activity in TSLA this day, and especially in the very short options with same-day maturity (often called "lotto's"). One of the traders said, "it's a run on the 180's", which meant that there was particularly strong buying interest for the options with a strike price of 180 (TSLA opened at 162.43 and peaked at 180.68). I also see this on the NASDAQ exchange's website. In call options with maturity 180 on the same day, 382,846 contracts were traded. These alone are options on the equivalent of 38 million shares (out of a total of 306 million traded that day). If we add the 170, 172.50, 175 and 177.50 call option series, a further 797,000 contracts were traded, corresponding to 80 million shares. Altogether, in just these five 1-day option series, contracts were traded with an underlying corresponding to 38.6% of the turnover in the TSLA share that day.
OK, you're probably thinking. But what does this mean? Well, the fact is that when such options are bought in the market, it is in most cases a market maker (bank/brokerage) who sells them. In practice, these sellers are computer-controlled programs that manage their risk according to certain parameters. If the price of a share is 165 and someone buys an option that gives them the right to buy the share at 170 on the same day, the market maker will automatically calculate the probability that they will have to deliver these shares and ensure that they have access to them. If someone buy a 100 options this gives the right to buy 10,000 shares. If the market maker considers it 10% likely that the price will go above 170, they may buy 1,000 shares to hedge their sale of the options. If the price of the stock rises sharply, however, it becomes more likely that the option has a real value, and the market maker must increase his hedging, i.e. buy more shares. If very many players simultaneously run a one-sided race against such option series, a feedback loop can thus be created that drives the price of the share further up.
This phenomenon was a major contributing factor to the spectacular price movements in shares such as Gamestop and AMC in 2021. However, it is not commonplace to see it done on such scale as in Tesla. Strong, and rare forces were in place this day.
What now?
In the market, all possibilities are open. It will be interesting to see if the momentum in the share can continue on and drag the price further towards 200. However, a combination of circumstances is often required to be able to drive a share so hard in a coherent movement. Maybe they only managed it because no one was prepared, and it was Friday night. Forces attract counterforces, and with prices close to 100 fresh in mind, there may be larger holders who are interested in selling at prices approaching 200. In the longer-term chart below, however, we see that TSLA is now midway in a broad falling trend channel and can continue further up to 250 without breaking this. The market tends to surprise. It is therefore always a good idea to have a plan for several scenarios and good management of your own risk-taking.

Disclaimer: After many years in the brokerage industry I started my own business in 2021. I published the book "Paleo Trading: How to trade like a Hunter-Gatherer” and launched Paleo Capital that manages a hedge fund according to the principles described in the book. I emphasize that nothing written on this blog is to be regarded as personal advice or a concrete call to take positions. Everyone must be responsible for their own decisions and familiarize themselves with the products they use.
Risks
External author:
This information is in the sole responsibility of the guest author and does not necessarily represent the opinion of Bank Vontobel Europe AG or any other company of the Vontobel Group. The further development of the index or a company as well as its share price depends on a large number of company-, group- and sector-specific as well as economic factors. When forming his investment decision, each investor must take into account the risk of price losses. Please note that investing in these products will not generate ongoing income.
The products are not capital protected, in the worst case a total loss of the invested capital is possible. In the event of insolvency of the issuer and the guarantor, the investor bears the risk of a total loss of his investment. In any case, investors should note that past performance and / or analysts' opinions are no adequate indicator of future performance. The performance of the underlyings depends on a variety of economic, entrepreneurial and political factors that should be taken into account in the formation of a market expectation.
Disclaimer:
This information is neither an investment advice nor an investment or investment strategy recommendation, but advertisement. The complete information on the trading products (securities) mentioned herein, in particular the structure and risks associated with an investment, are described in the base prospectus, together with any supplements, as well as the final terms. The base prospectus and final terms constitute the solely binding sales documents for the securities and are available under the product links. It is recommended that potential investors read these documents before making any investment decision. The documents and the key information document are published on the website of the issuer, Vontobel Financial Products GmbH, Bockenheimer Landstrasse 24, 60323 Frankfurt am Main, Germany, on prospectus.vontobel.com and are available from the issuer free of charge. The approval of the prospectus should not be understood as an endorsement of the securities. The securities are products that are not simple and may be difficult to understand. This information includes or relates to figures of past performance. Past performance is not a reliable indicator of future performance.