The case of Tesla


TSLA was a star in the latest bullmarket, ending in 2021. What now?
We who like both history and finance find it extra exciting when individuals and companies that stand out in particular appear on the scene. Some of these will later stand as icons and examples of ground-breaking new developments. Such people are often controversial in their time and arouse strong opinions by friends and foes. Among these can be counted Henry Ford with mass production of cars, Thomas Edison with electricity at General Electric, John Pierpont Morgan as a pioneer in finance with the investment bank J.P. Morgan, and Steve Jobs with Apple and the smartphone. I am sure the history books will place Elon Musk with Tesla and the electrification of cars among these.
Besides the company Tesla, Elon Musk is a pioneer in space travel with the privately owned SpaceX, is trying to revolutionize tunnel drilling with The Boring Company, is central to Neuralink and OpenAI, and has recently bought Twitter. Impressive, but maybe too much to chew on for one person? However, we will leave this behind, and focus on Tesla.
The TSLA stock
Tesla was listed on NASDAQ USA on 29 June 2010 under the ticker TSLA. At the time of writing, the stock has the sixth largest weight in the NASDAQ 100 index, behind Apple, Microsoft, Alphabet (Google), Amazon and Nvidia. TSLA is also part of the S&P 500 index.
TSLA is among the most traded stocks on the NASDAQ exchange, and the most volatile of the heavyweights. Over the past 30 days, the average daily turnover has been 85 million shares, which at a price of USD 151 means that TSLA is traded for close to USD 13 billion or NOK 130 billion on a normal day. In comparison, the average total daily turnover for the entire Oslo Børs has been approx. NOK 4.3 billion last month, and for Stockholm's OMXS30 index approx. SEK 11 billion. Over the past 30 days, TSLA has had daily fluctuations of approximately 7.5% measured as ATR (average true range) divided by share price. It is much. In comparison, the NASDAQ 100 index stands at 2.5% and the S&P 500 at 1.8%.
Based on this, it is easy to understand that the stock is attractive to traders. It is hyper liquid and very volatile.
Tesla the company
Most people think of Tesla solely as a car manufacturer. Although correct, this does not give the full picture. Tesla has done both vertical and horizontal integration to a greater extent than its traditional competitors. Vertical means that they are both their own supplier and retailer. Horizontally means that they have spread out with other businesses. All of this adds value and makes a pure comparison with other car manufacturers too simple. Let's take some examples:
- Charging stations: Tesla owns and operates its own network of superchargers. At the time of writing, according to its own website, Tesla has more than 40,000 operational superchargers worldwide. In comparison, the largest single company in this area, American ChargePoint (CHPT), has installed 30,000 chargers globally. CHPT has a market value of approx. 3.6 billion USD against TSLA's 477 billion. If you adjust for the number of chargers in this calculation and use CHPT as a benchmark, you can roughly say that 1% of the value in TSLA is in the charging network.
- Energy storage and generation: Tesla offers a battery solution called Powerwall. Put simply, you can say that this is roughly the same battery as in one of Tesla's cars, but for hanging on the wall. The batteries are sold individually to households and can be connected to solar cells, wind, or other forms of energy production. Energy can then be stored and used when needed. In 2016, Tesla merged with SolarCity. They have significant business in the installation of solar cells, and Tesla has previously showcased exciting products in this area. However, Tesla's batteries are also sold in larger packages for industrial use. With more and more wind and solar parks around the world, this is a rapidly growing market. Few know that Tesla is actually the global market leader in energy storage.
- What can this business be worth? According to Tesla's Q3 report, the business area had sales of $1.12 billion in the quarter, a 38.5% increase from the previous year. In comparison, revenues from the automotive area amounted to USD 18.7 billion, up 55% from 3Q 2021. Seen in relation to total revenues, the business area accounts for 5.2% per 3Q 2022. Finding comparables to estimate a value is more difficult than for chargers, but NASDAQ-listed SolarEdge might be relevant. They had sales of USD 836 million in 3Q and have a stock market value of USD 17.9 billion. If you adjust these figures for turnover and apply them to TSLA, it will indicate a stock market value of USD 24 billion in this business area, corresponding to approximately 5% of Tesla's market value. So approximately as the area's share of total turnover.
- Service and other: This accounting item includes servicing of the cars, sales of extra equipment/upgrades and other. It is possible that Tesla's subscription services are also located here. The area had a turnover of 1.65 billion USD in 3Q, up 84% last year. This is thus the fastest growing part of Tesla's revenue and accounted for 7.7% of total revenue in 3Q.
Fundamental comparison to competitors
Tesla undoubtedly operates very differently to the traditional players in the industry. The disadvantage of doing everything new is that there will always be some trial and error before you get it right, but the advantage is that you don't have to resort to an organization, factories and supply chain that are better adapted to history than to the future. This is also visible if you look at a number of fundamental key figures compared to the industry average. The figures are for the last year (trailing twelve months).
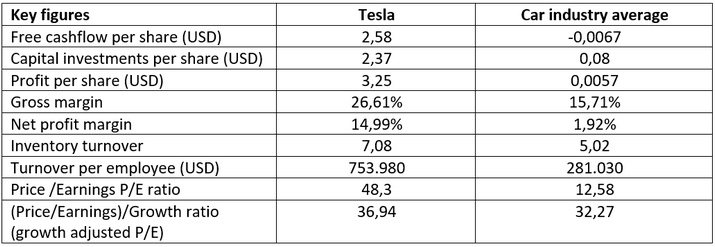
I have not calculated these numbers myself, and this is far from a complete fundamental analysis. However, the immediate impression is that those who shout that Tesla shares are so expensive compared to other car companies might not have such a good case. In many areas, Tesla simply scores dramatically better than the average in the car industry. The ratio I think is most relevant is the P/E/G ratio, where pricing per share (P/E) is adjusted for growth in earnings (E). There, Tesla is only marginally more expensive than the industry average. This means that higher pricing reflects higher earnings growth, precisely as the textbooks in finance should dictate.
The technical picture
In all historical bull markets, you will find stocks that remain as the star example of this market phase. For the bull market that ended in 2021, TSLA is undoubtedly among the leading exponents. The chart below shows price development over the past 5 years with weekly candlesticks. The stock took off violently from the end of 2019, so the fluctuations before that are hardly visible. Along the way, there have been a couple of splits in the stock to get a price per share down to normal levels. The stock peaked at over USD 400 towards the end of 2021 and has since experienced significant headwinds. In recent weeks, the fall has increased sharply, and the share fell below USD 150 in after-market trading on Friday.

If we look at a shorter timeframe chart, we see that the share has halved since September this year and is still trending sharply downwards. The fall has been steep, long, and continuous with increasing intensity in recent days. Currently, the share does not show any technical signs of strength. One should be careful about buying in such strong downtrends. Tactically, however, I notice that the share is very oversold after the long continuous fall. Within such downtrends, there can be quick and significant upswings. It requires precision to trade such, and I must stress that we do not yet see any signs of a longer-term reversal in the technical picture.

Conclusion and current status
Both the company Tesla, the car industry, electrification, and the person Elon Musk are topics that provide a lot of material for the media, brokerage houses, investors, and traders on a daily basis. This article is by no means a full analysis, but I wanted to bring out some points that I personally find relevant. The first is that Tesla is more than just a manufacturer of cars. They are also the global market leader in superchargers and the global market leader in energy storage. They push boundaries in battery production, microchips, and AI. Put bluntly, one could perhaps say that the company is more similar to Apple than to Ford.
The second point is that TSLA scores significantly better than the industry average on many fundamental parameters and, adjusted for growth, the price-gap is not so large. Here, however, it is important to add that major changes are taking place in the industry now. Traditional car manufacturers have, after a late start, made good progress with electric conversion. There are ever more and better models on the market. Tesla's lead is obviously smaller than it was a couple of years ago. In addition, new Chinese manufacturers have recently entered the scene in startlingly large volumes and with cars that (without having tried them) simply look good and have low prices. I think a number of European car manufacturers in particular are almost in shock at how quickly the Chinese have taken market share.
The third and final point is that the stock is among the most liquid and volatile stocks for traders. Technically, it is in an ugly downtrend, but the trend is starting to be significantly stretched (oversold) now towards the end of December. Large share sales by the main owner may have pressured the share in addition to a generally weak market for growth/technology shares. The news surrounding Musk and his purchase of Twitter also contributes to the negative side.
Personally, I think Tesla is one of the most exciting stocks and companies of our time. When buying and selling, however, this must be done according to the usual criteria used for timing and risk control in line with one's own time horizon. But that the share should provide interesting opportunities both on the long and short side in 2023, I consider as certain.
Disclaimer: After many years in the brokerage industry I started my own business in 2021. I published the book "Paleo Trading: How to trade like a Hunter-Gatherer” and launched Paleo Capital that manages a hedge fund according to the principles described in the book. I emphasize that nothing written on this blog is to be regarded as personal advice or a concrete call to take positions. Everyone must be responsible for their own decisions and familiarize themselves with the products they use.
Risks
External author:
This information is in the sole responsibility of the guest author and does not necessarily represent the opinion of Bank Vontobel Europe AG or any other company of the Vontobel Group. The further development of the index or a company as well as its share price depends on a large number of company-, group- and sector-specific as well as economic factors. When forming his investment decision, each investor must take into account the risk of price losses. Please note that investing in these products will not generate ongoing income.
The products are not capital protected, in the worst case a total loss of the invested capital is possible. In the event of insolvency of the issuer and the guarantor, the investor bears the risk of a total loss of his investment. In any case, investors should note that past performance and / or analysts' opinions are no adequate indicator of future performance. The performance of the underlyings depends on a variety of economic, entrepreneurial and political factors that should be taken into account in the formation of a market expectation.
Disclaimer:
This information is neither an investment advice nor an investment or investment strategy recommendation, but advertisement. The complete information on the trading products (securities) mentioned herein, in particular the structure and risks associated with an investment, are described in the base prospectus, together with any supplements, as well as the final terms. The base prospectus and final terms constitute the solely binding sales documents for the securities and are available under the product links. It is recommended that potential investors read these documents before making any investment decision. The documents and the key information document are published on the website of the issuer, Vontobel Financial Products GmbH, Bockenheimer Landstrasse 24, 60323 Frankfurt am Main, Germany, on prospectus.vontobel.com and are available from the issuer free of charge. The approval of the prospectus should not be understood as an endorsement of the securities. The securities are products that are not simple and may be difficult to understand. This information includes or relates to figures of past performance. Past performance is not a reliable indicator of future performance.