Gold will be gold


The US’s central bank, the Fed, and other central banks around the world are trying to fight inflation with increasing rates and QT (Quantitative Tightening). In parallel, important global Purchasing Managers Index PMI is above 50 and the US labour market is adding new jobs at a historically strong pace. Nevertheless, market participants see an increased risk of stagflation followed by a recession. That at the back of many factors, whereof the Philly Fed Business Index turned negative for June, the first since the COVID lockdowns. Also, 59 per cent of US manufacturers are counting on a recession that lies ahead. This implies that the better bets may be on non-cyclical stocks and/or precious metals. Below is the price development of the S&P 500 index and gold since April 2006. As shown, the gold price clearly outperformed S&P 500 during, but also following the recession due to the financial crisis of 2007-2008. Is this a pattern that will repeat?
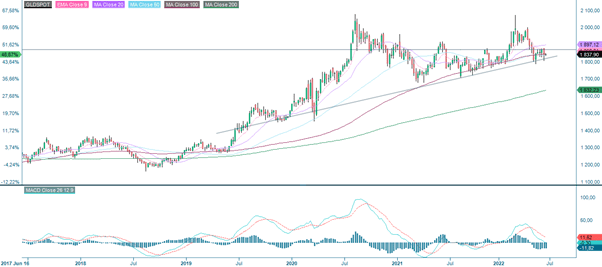
S&P 500 (in USD) versus gold (in USD), April 2006 to June 2022

The gold price is currently between levels around 1 800 and 1 870 USD per troy ounce. Momentum is negative but improving.
S&P 500 (in USD) versus gold (in USD), April 2006 to June 2022

The full name for abbreviations used in the previous text:
EMA 9: 9-day exponential moving average
Fibonacci: There are several Fibonacci lines used in technical analysis. Fibonacci numbers are a sequence of numbers in which each successive number is the sum of the two previous numbers.
MA20: 20-day moving average
MA50: 50-day moving average
MA100: 100-day moving average
MA200: 200-day moving average
MACD: Moving average convergence divergence
Risks
Disclaimer:
This information is neither an investment advice nor an investment or investment strategy recommendation, but advertisement. The complete information on the trading products (securities) mentioned herein, in particular the structure and risks associated with an investment, are described in the base prospectus, together with any supplements, as well as the final terms. The base prospectus and final terms constitute the solely binding sales documents for the securities and are available under the product links. It is recommended that potential investors read these documents before making any investment decision. The documents and the key information document are published on the website of the issuer, Vontobel Financial Products GmbH, Bockenheimer Landstrasse 24, 60323 Frankfurt am Main, Germany, on prospectus.vontobel.com and are available from the issuer free of charge. The approval of the prospectus should not be understood as an endorsement of the securities. The securities are products that are not simple and may be difficult to understand. This information includes or relates to figures of past performance. Past performance is not a reliable indicator of future performance.
External author:
This information is in the sole responsibility of the guest author and does not necessarily represent the opinion of Bank Vontobel Europe AG or any other company of the Vontobel Group. The further development of the index or a company as well as its share price depends on a large number of company-, group- and sector-specific as well as economic factors. When forming his investment decision, each investor must take into account the risk of price losses. Please note that investing in these products will not generate ongoing income.
The products are not capital protected, in the worst case a total loss of the invested capital is possible. In the event of insolvency of the issuer and the guarantor, the investor bears the risk of a total loss of his investment. In any case, investors should note that past performance and / or analysts' opinions are no adequate indicator of future performance. The performance of the underlyings depends on a variety of economic, entrepreneurial and political factors that should be taken into account in the formation of a market expectation.