Something for the brave: Will the Meta stock benefit from Twitter- buyout?


On Monday afternoon, Tesla CEO and multi-billionaire Elon Musk got his buyout-offer on Twitter accepted by the board of directors, meaning that Twitter will go private under total control of Musk.
Musk struck the deal at a value of $54.20 per share, or a total market value of $44 billion. Twitter has stood out as one of few listed large caps in the social media space, and its likely delisting will leave tech investors in a shrunken investment landscape. Investors aiming to allocate funds towards social media stocks might thus direct investments to the other large social media stocks left in public space.
In the Twitter peer group, we note that Meta Platforms stock closed at $174,95, touching price-levels we haven’t seen since April 2020.Yesterday, Meta released its quarterly earnings report after markets closed. While earnings per share were moderately lower than analysts' expectations, the active user count was higher than expected.
Not indicated in the charts below, Meta was up close to 20 per cent yesterday in the after-hours trading. Thus, a rebound back up above previous low from March might indicate an attractive entry-point for the brave tech investors, believing in its fundamental value.
Meta Platforms (in USD) 12-month chart
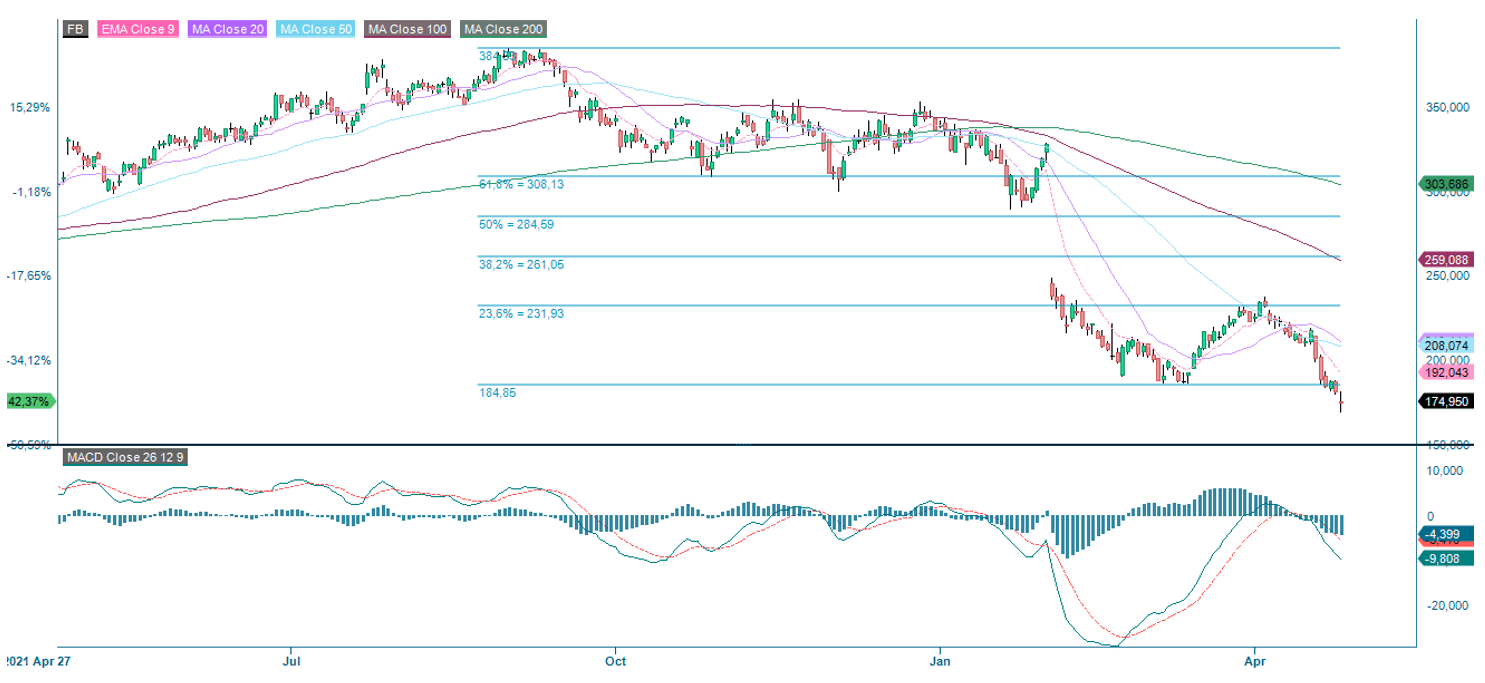
Source: Infront and Carlsquare. Note: Past performance is not a reliable indicator of future results.
Meta Platforms (in USD) weekly five-year chart
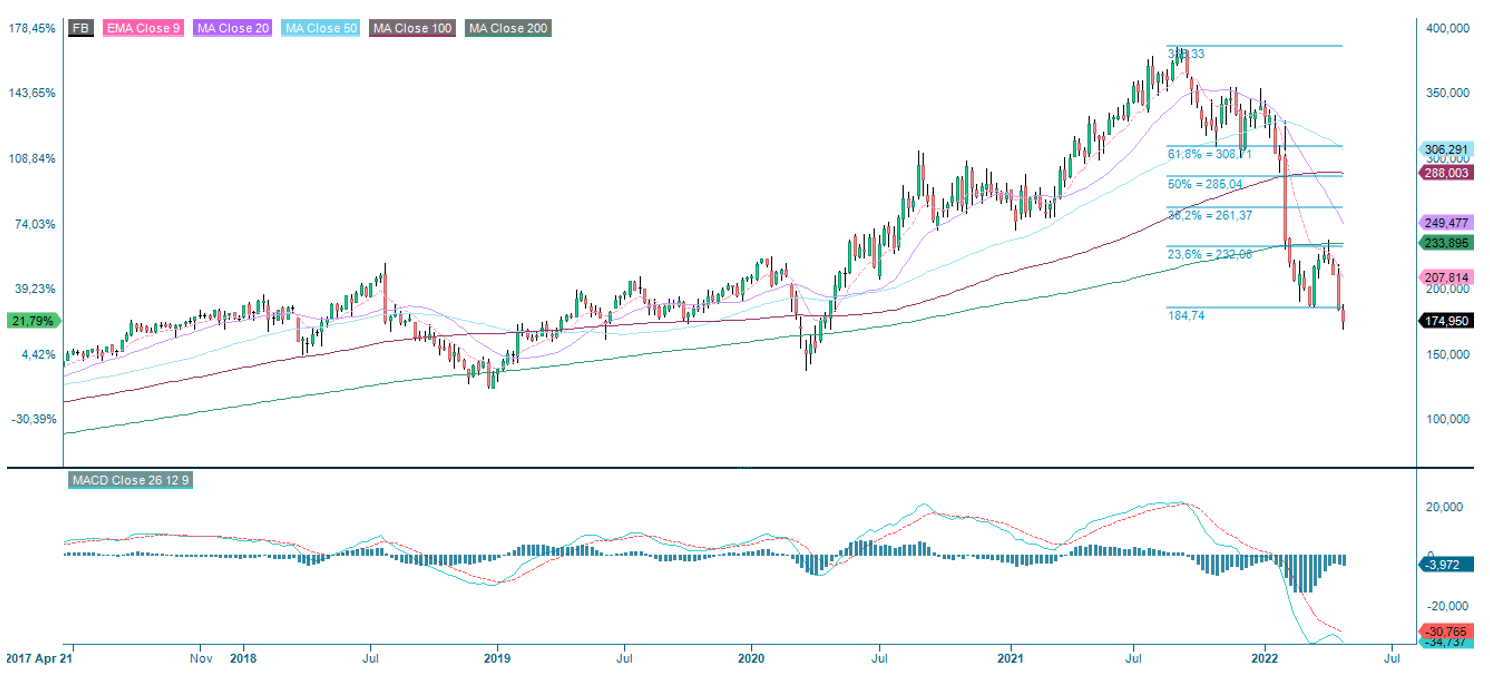
Source: Infront and Carlsquare. Note: Past performance is not a reliable indicator of future results.
The full name for abbreviations used in the previous text:
EMA 9: 9-day exponential moving average
Fibonacci: There are several Fibonacci lines used in technical analysis. Fibonacci numbers are a sequence of numbers in which each successive number is the sum of the two previous numbers.
MA20: 20-day moving average
MA50: 50-day moving average
MA100: 100-day moving average
MA200: 200-day moving average
MACD: Moving average convergence divergence
Risks
External author:
This information is in the sole responsibility of the guest author and does not necessarily represent the opinion of Bank Vontobel Europe AG or any other company of the Vontobel Group. The further development of the index or a company as well as its share price depends on a large number of company-, group- and sector-specific as well as economic factors. When forming his investment decision, each investor must take into account the risk of price losses. Please note that investing in these products will not generate ongoing income.
The products are not capital protected, in the worst case a total loss of the invested capital is possible. In the event of insolvency of the issuer and the guarantor, the investor bears the risk of a total loss of his investment. In any case, investors should note that past performance and / or analysts' opinions are no adequate indicator of future performance. The performance of the underlyings depends on a variety of economic, entrepreneurial and political factors that should be taken into account in the formation of a market expectation.
Disclaimer:
This information is neither an investment advice nor an investment or investment strategy recommendation, but advertisement. The complete information on the trading products (securities) mentioned herein, in particular the structure and risks associated with an investment, are described in the base prospectus, together with any supplements, as well as the final terms. The base prospectus and final terms constitute the solely binding sales documents for the securities and are available under the product links. It is recommended that potential investors read these documents before making any investment decision. The documents and the key information document are published on the website of the issuer, Vontobel Financial Products GmbH, Bockenheimer Landstrasse 24, 60323 Frankfurt am Main, Germany, on prospectus.vontobel.com and are available from the issuer free of charge. The approval of the prospectus should not be understood as an endorsement of the securities. The securities are products that are not simple and may be difficult to understand. This information includes or relates to figures of past performance. Past performance is not a reliable indicator of future performance.