Investors still prefer value ahead of growth. Where is brent oil heading?


The past week has seen a minor share price decline, notably on the New York Stock Exchange, where the S&P500 index fell by 2.4 percent. Otherwise, changes have been small, and in Europe, Paris (CAC40) and Frankfurt (DAX) have risen slightly last week. The cyclical OMX30 in Stockholm is somewhat worse off, while the non-cyclical FTSE (London) index continues to be the best performer this year.
Significant stock indices performance on Monday, April 18, 2022, in one week and this year
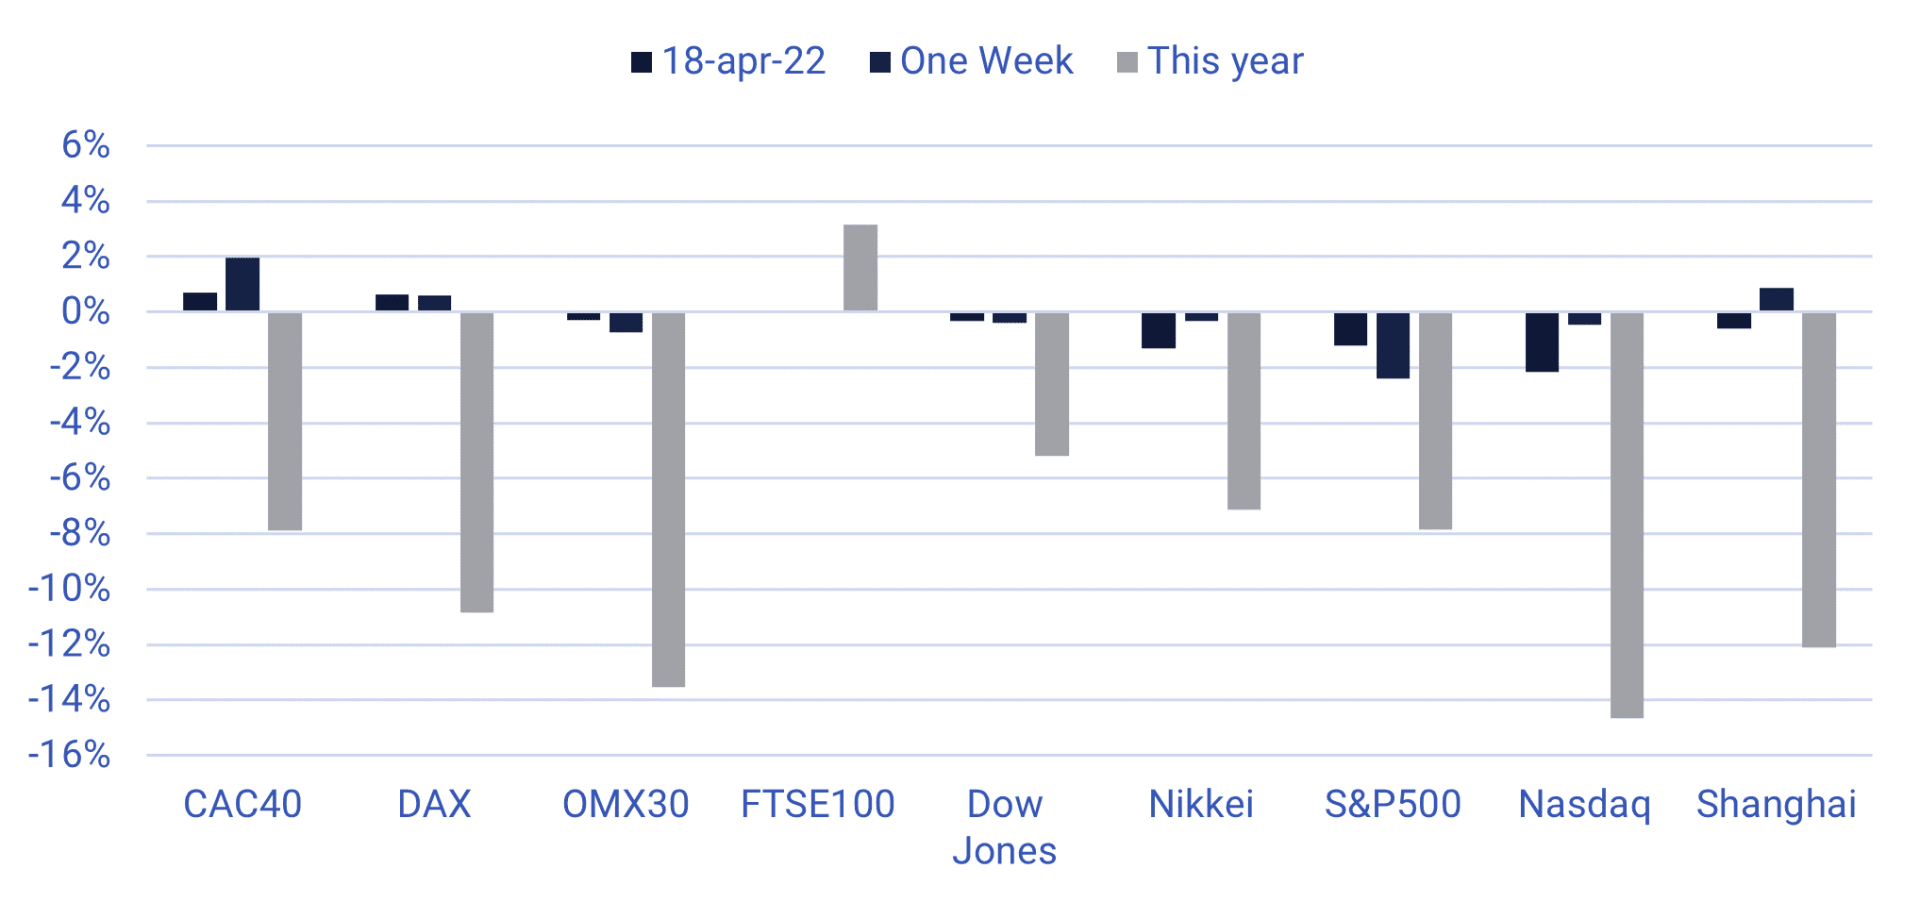
Source: www.di.se,www.cnbc.com
The reporting season for S&P500 companies in the US kicked off in earnest on Wednesday, April 13, with Q1 2022 results from Citigroup, Goldman Sachs, JP Morgan, Morgan Stanley, and Wells Fargo. US bank, with few exceptions, beat low revenue and profit expectations for Q1. But stock price reactions to the reports were mixed; positive in Goldman Sachs, Citigroup, and Morgan Stanley, but negative in JPM Morgan and Wells Fargo. It is despite the weak performance of financial stocks so far this year.
So far, nearly 40 S&P500 companies have reported their Q1 2022 results. In 77 percent of cases, the results have been better than analysts' expectations. However, good results do not seem enough to lift the stock market. 69 S&P500 companies will report their Q1 2022 results this week, including IBM, Johnson & Johnson, Netflix, Tesla, AT&T, Nucor, Snap, and Verizon.
The technical is not in favor of oil
Brent oil has regained some strength after China seems to be looking to ease its restrictions, meaning increased activity and worries about supply in the wake of the Ukraine crisis. However, the daily chart below shows that the oil price is trading in a large bearish descending triangle that tends to break on the downside. Going for a short position may be considered very risky as momentum is picking up (see MACD). A more attractive timing will be when (and if) brent oil breaks the support level below the USD 100-level. In such a scenario, the target price given by the formation is around 70 USD/barrel.
Brent oil price (in USD) daily one year chart
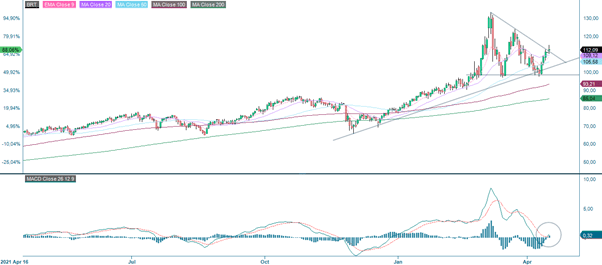
Source: Infront and Carlsquare. Note: Past performance is not a reliable indicator of future results.
Brent oil (in USD), five-year chart
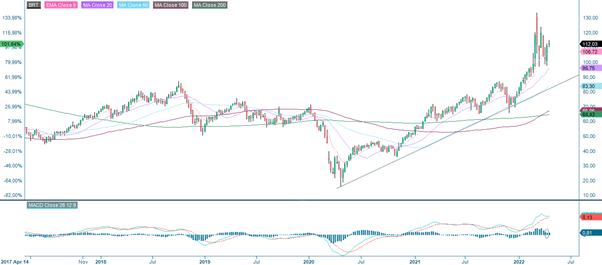
Source: Infront and Carlsquare. Note: Past performance is not a reliable indicator of future results.
The full name for abbreviations used in the previous text:
EMA 9: 9-day exponential moving average
Fibonacci: There are several Fibonacci lines used in technical analysis. Fibonacci numbers are a sequence of numbers in which each successive number is the sum of the two previous numbers.
MA20: 20-day moving average
MA50: 50-day moving average
MA100: 100-day moving average
MA200: 200-day moving average
MACD: Moving average convergence divergence
Risks
External author:
This information is in the sole responsibility of the guest author and does not necessarily represent the opinion of Bank Vontobel Europe AG or any other company of the Vontobel Group. The further development of the index or a company as well as its share price depends on a large number of company-, group- and sector-specific as well as economic factors. When forming his investment decision, each investor must take into account the risk of price losses. Please note that investing in these products will not generate ongoing income.
The products are not capital protected, in the worst case a total loss of the invested capital is possible. In the event of insolvency of the issuer and the guarantor, the investor bears the risk of a total loss of his investment. In any case, investors should note that past performance and / or analysts' opinions are no adequate indicator of future performance. The performance of the underlyings depends on a variety of economic, entrepreneurial and political factors that should be taken into account in the formation of a market expectation.
Disclaimer:
This information is neither an investment advice nor an investment or investment strategy recommendation, but advertisement. The complete information on the trading products (securities) mentioned herein, in particular the structure and risks associated with an investment, are described in the base prospectus, together with any supplements, as well as the final terms. The base prospectus and final terms constitute the solely binding sales documents for the securities and are available under the product links. It is recommended that potential investors read these documents before making any investment decision. The documents and the key information document are published on the website of the issuer, Vontobel Financial Products GmbH, Bockenheimer Landstrasse 24, 60323 Frankfurt am Main, Germany, on prospectus.vontobel.com and are available from the issuer free of charge. The approval of the prospectus should not be understood as an endorsement of the securities. The securities are products that are not simple and may be difficult to understand. This information includes or relates to figures of past performance. Past performance is not a reliable indicator of future performance.