Musk makes Twitter jitter, but what about Tesla?


There has been quite some talk about Elon Musk and his 9,2 per cent stake in Twitter. The story is indeed interesting to follow. However, one should not forget about Tesla, which is set to report its Q1 figures on April 20.
There has been quite some talk about Elon Musk and his 9,2 per cent stake in Twitter. The story is indeed interesting to follow. However, one should not forget about Tesla, which is set to report its Q1 figures on April 20.
According to S&P Capital IQ, the consensus revenue estimate is USD 17.78bn, and the consensus EPS estimate is USD 1.84. That means revenue is expected to grow by 71 per cent compared to the same quarter last year, and EPS to increase by a factor of 4.7. That may seem high, but the estimates may not be too optimistic with a new record set in Q1 2022 in terms of delivered cars.
The guidance on the future is as important as the financial figures and outcome vs expectations. Worries may not be on the demand side, nor the capacity side, as the Gigafactories in Berlin and Texas are both up and running producing cars (or soon to be). However, the lockdown in Shanghai may have caused some production issues.
The Tesla share did not manage to break the falling trendline ahead of the report and is currently trading just above the psychologically important 1,000-level and strong support in the form of MA 100 and Fib 50. Perhaps a robust report and promising guidance can become the trigger needed for the share to break up.
Tesla (in USD) from June 30, 2021, to April 13, 2022
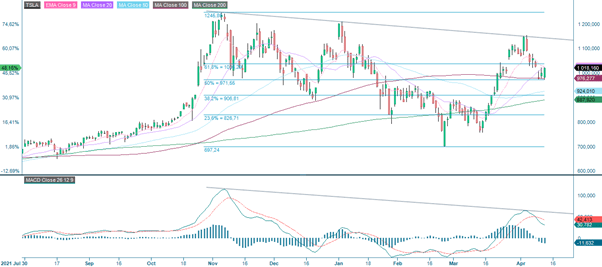
Source: Infront and Carlsquare. Note: Past performance is not a reliable indicator of future results.
Tesla (in USD) five-year weekly chart
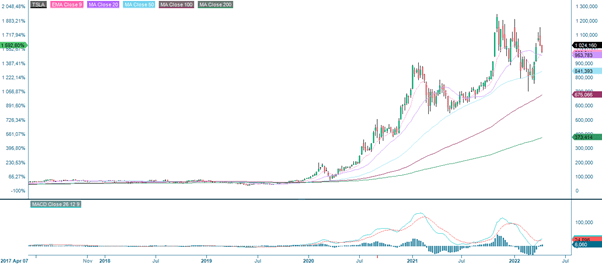
Source: Infront and Carlsquare. Note: Past performance is not a reliable indicator of future results.
The full name for abbreviations used in the previous text:
EMA 9: 9-day exponential moving average
Fibonacci: There are several Fibonacci lines used in technical analysis. Fibonacci numbers are a sequence of numbers in which each successive number is the sum of the two previous numbers.
MA20: 20-day moving average
MA50: 50-day moving average
MA100: 100-day moving average
MA200: 200-day moving average
MACD: Moving average convergence divergence
Risks
External author:
This information is in the sole responsibility of the guest author and does not necessarily represent the opinion of Bank Vontobel Europe AG or any other company of the Vontobel Group. The further development of the index or a company as well as its share price depends on a large number of company-, group- and sector-specific as well as economic factors. When forming his investment decision, each investor must take into account the risk of price losses. Please note that investing in these products will not generate ongoing income.
The products are not capital protected, in the worst case a total loss of the invested capital is possible. In the event of insolvency of the issuer and the guarantor, the investor bears the risk of a total loss of his investment. In any case, investors should note that past performance and / or analysts' opinions are no adequate indicator of future performance. The performance of the underlyings depends on a variety of economic, entrepreneurial and political factors that should be taken into account in the formation of a market expectation.
Disclaimer:
This information is neither an investment advice nor an investment or investment strategy recommendation, but advertisement. The complete information on the trading products (securities) mentioned herein, in particular the structure and risks associated with an investment, are described in the base prospectus, together with any supplements, as well as the final terms. The base prospectus and final terms constitute the solely binding sales documents for the securities and are available under the product links. It is recommended that potential investors read these documents before making any investment decision. The documents and the key information document are published on the website of the issuer, Vontobel Financial Products GmbH, Bockenheimer Landstrasse 24, 60323 Frankfurt am Main, Germany, on prospectus.vontobel.com and are available from the issuer free of charge. The approval of the prospectus should not be understood as an endorsement of the securities. The securities are products that are not simple and may be difficult to understand. This information includes or relates to figures of past performance. Past performance is not a reliable indicator of future performance.