When will it settle?

This week's case is the EUR/USD cross, where the US-Dollar has fallen against the Euro, similar to the last time Trump was elected US President. History suggests that this trend reversal could last for a year or so and is linked to trade rules becoming more certain than they are today
Case of the week: USD strength challenged
The recent decline in global equity markets has hit US equity indices the hardest. The fall has coincided with a weakening of the US dollar against European currencies such as the euro and even more so against smaller currencies such as the SEK.
The weakening of the USD against the EUR also occurred the last time Trump was in the Oval Office. EUR/USD peaked at around 1.58 in April 2008. Thereafter, the USD gradually strengthened against the EUR, with the pair hitting a low of around 1.07 in mid-December 2016 (a few weeks after Trump was first elected US president). Then, just like this time, the euro started to recover some ground against the USD, with EUR/USD reaching almost 1.20 in May 2018. Then there was another trend reversal, with EUR/USD falling back to 1.09 in April 2020. In September 2022, EUR/USD fell below 1.0 for the first time since 2002, before recovering to trade around 1.1.
Since the beginning of 2025, the yield on two-year US government bonds has fallen from 4.2% to 3.95%, while the German equivalent has risen from 1.9% to 2.2%. The US interest rate market is now pricing in three rate cuts by the Federal Reserve over the course of 2025, compared with just over one cut two months ago. It is the increased likelihood of a recession that is driving US rates lower. A lower Treasury yield makes US bonds less attractive. European countries are now being forced to build up their militaries as the previous US military support for NATO and Europe is no longer evident. This is causing European interest rates to rise, which should help strengthen the EUR against the USD.
Behind the turmoil in the equity and currency markets, where investors encounter new risks on an almost daily basis, is U.S. President Trump, who has kicked off his second term with a vengeance, proposing tariffs against Canada, Mexico, Europe, and China. Countries outside the U.S. have naturally reacted, and in some cases, such as Canada, have proposed counter-tariffs. Trade is a complicated matter these days; for instance, car parts often cross borders several times between the U.S. and Canada before being assembled into a vehicle produced in the U.S. Trump's decision last week to impose tariffs on cars illustrated how economic realities limit how high tariffs can go—at least within North America—without harming his own voters with more expensive U.S.-made cars.
The US still imports more than it exports, but the gap has narrowed in recent years. The main trade deficit remains with China, which accounts for 7.0% of US exports and 13.4% of US imports. Unlike his first term as US president, when the focus was on US-China trade relations, Trump has this time put more emphasis on US neighbours Canada and Mexico, with which US exports and imports are more balanced. North America, or NAFTA (North American Free Trade Agreement), has had two free trade agreements between the US, Canada and Mexico, the first from 1994 and the second from 2020.
A weak US dollar and lower interest rates could be part of Trump's strategy to improve the US economy, as the US dollar has a special role as the world's reserve currency. This has allowed the US government to have a much larger national debt than other countries without having to raise interest rates significantly. However, Donald Trump does not seem to have much focus on this issue.
Our conclusion is that as long as Trump continues to waffle on his proposals, the stock market will remain volatile. Let's hope that the car tariff exemption for Canada and Mexico is the first example of Trump having to adjust to reality. If and when the tariff proposals are translated into more modest changes, we believe that the USD will regain some strength.
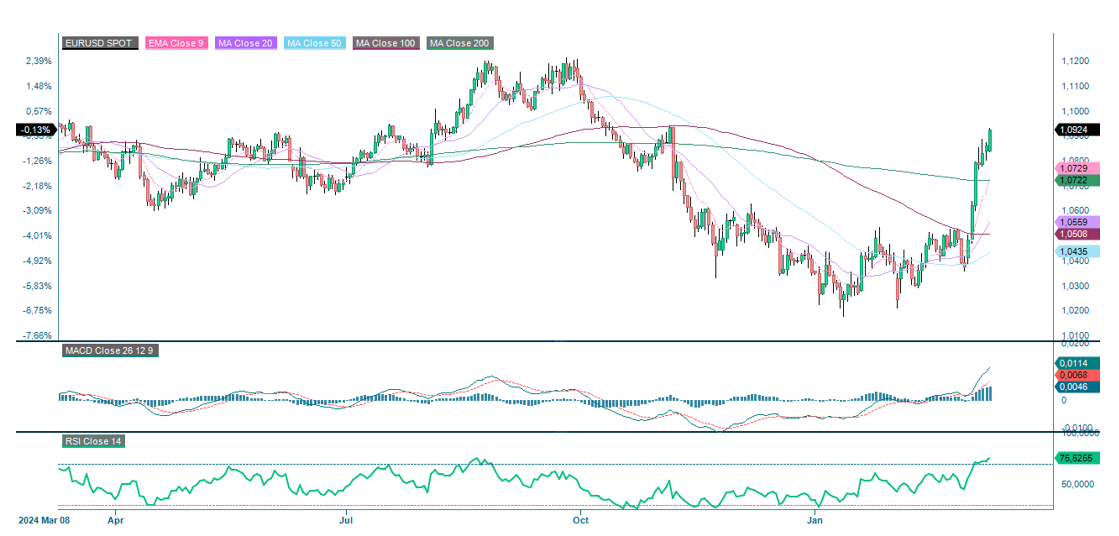
EUR/USD, one-year daily chart
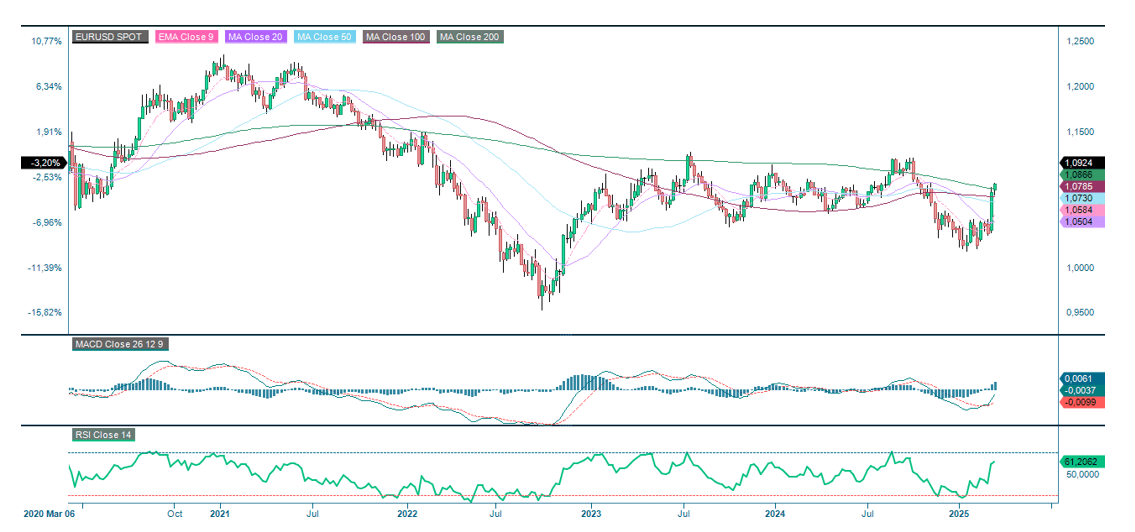
EUR/USD five-year weekly chart
Macro comments
US non-farm payrolls for February, published on Friday 7th March, were almost in line with market expectations. Employment rose by 151,000 new jobs, against expectations for 159,000 new jobs. US employment data in the coming months is likely to reflect the Trump administration's initiative to reduce the number of government employees.
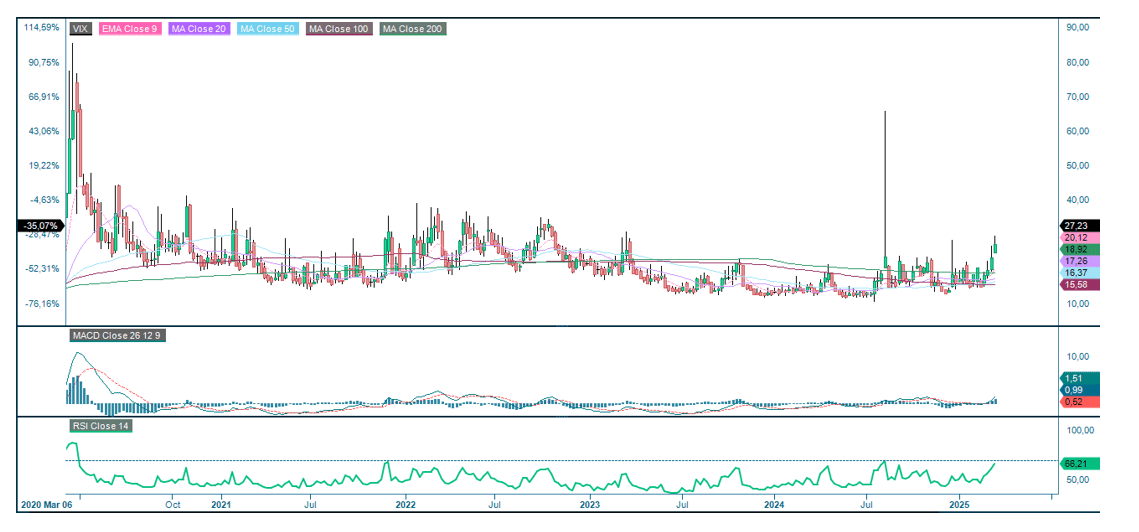
The major US stock market indices ended last week with modest gains, with the S&P500 up 0.6% and the Nasdaq up 0.7%. However, for last week as a whole, the Nasdaq fell 3.8% and the S&P500 fell 3.3%. Meanwhile, the DAX was up 2.0%, while the DJ World Index was down 1.1% last week. Monday 10th February saw another sharp fall in US equity markets, with the S&P500 down 2.7% and the Nasdaq down 4.0%. The VIX has risen sharply since the end of February, but is still well off its last peak in August 2024.
VIX (in percent), weekly five-year chart
Today, Wednesday, March 12, we start the macro agenda with the Japanese PPI (Producer Price Index) for February. We continue with the monthly oil report from OPEC (Organization of ¨the Petroleum Exporting Countries). Inditex and Rheinmetal release interim reports. We also get an interest rate announcement from the Bank of Canada. The US will contribute with the February CPI (Consumer Price Index).
On Thursday, March 13, we will start with the Swedish CPI for February. This will be followed by Eurozone Industrial Production for January and the IEA (International Energy Agency) Monthly Oil Report. The US will contribute with the February PPI and Initial Jobless Claims.
On Friday, 14 March, we will get an interim report from Deutsche Bank. Friday's macroeconomic agenda starts with UK GDP (Gross Domestic Product) and Industrial Production for January and German CPI for February. This is followed by France and Spain's February CPI. From the United States, we get the Michigan index for March.
Still waiting for the bounce
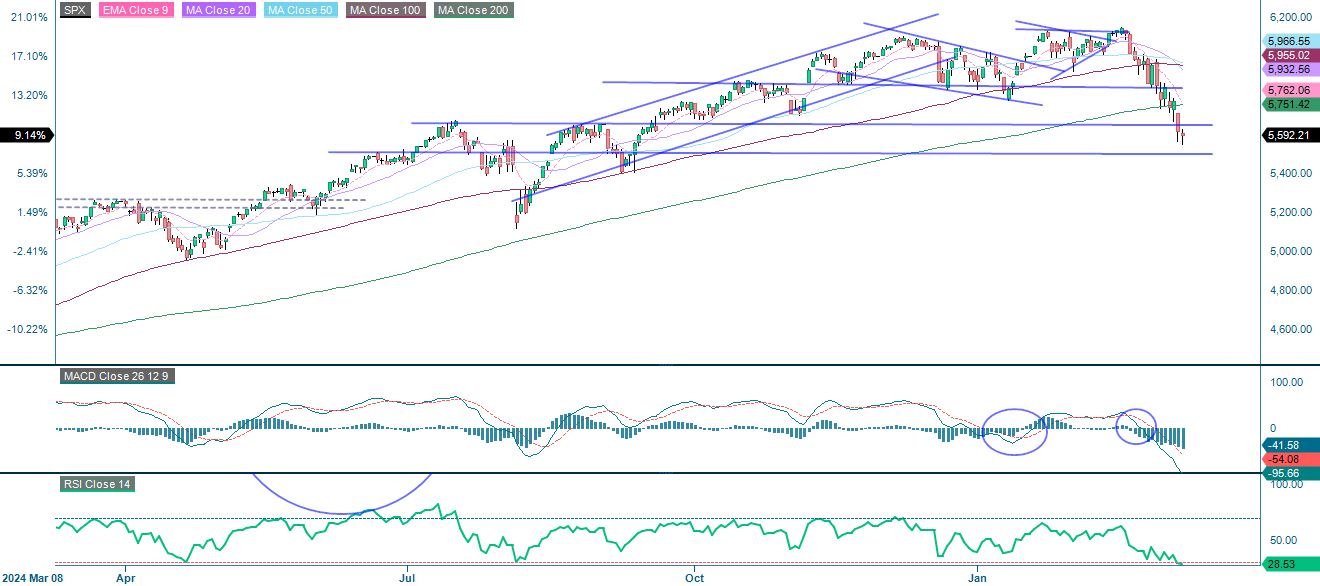
The S&P 500 is under heavy selling pressure and is trading below its MA200, so the long-term trend is down. However, the correction has been swift, with the RSI floating in the oversold territory and the MACD pointing well south. Meanwhile, the index is currently trading in no man's land above the next support level at 5,500. Is this the level to place some buy orders for a bounce? However, yields are also falling, suggesting that concerns about rising inflation and a possible recession are well-founded. So be careful out there.
S&P 500 (in USD), one-year daily chart
S&P 500 (in USD), weekly five-year chart

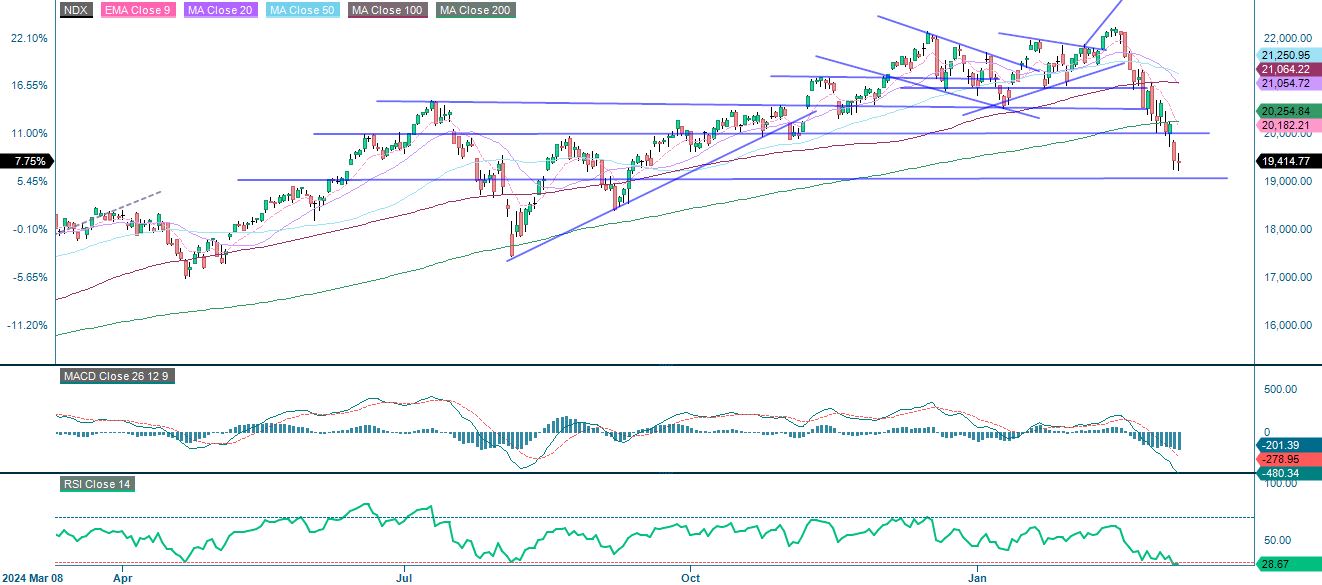
For the Nasdaq 100, the next level on the downside is around 19,000.
Nasdaq 100 (in USD), one-year daily chart
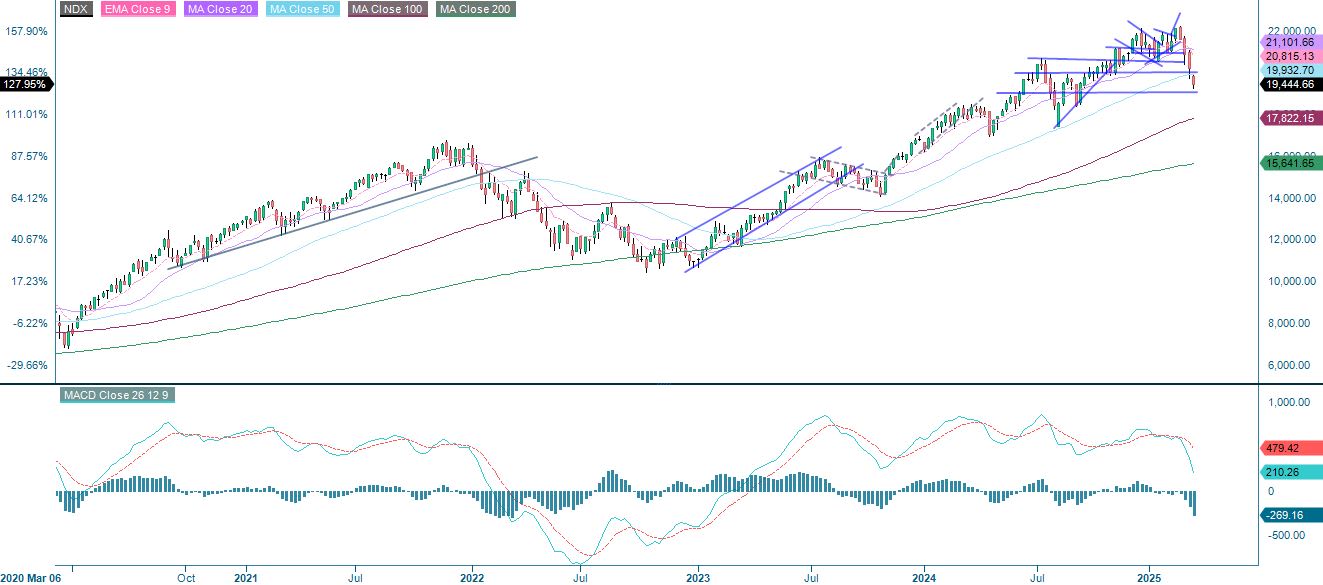
Nasdaq 100 (in USD), weekly five-year chart
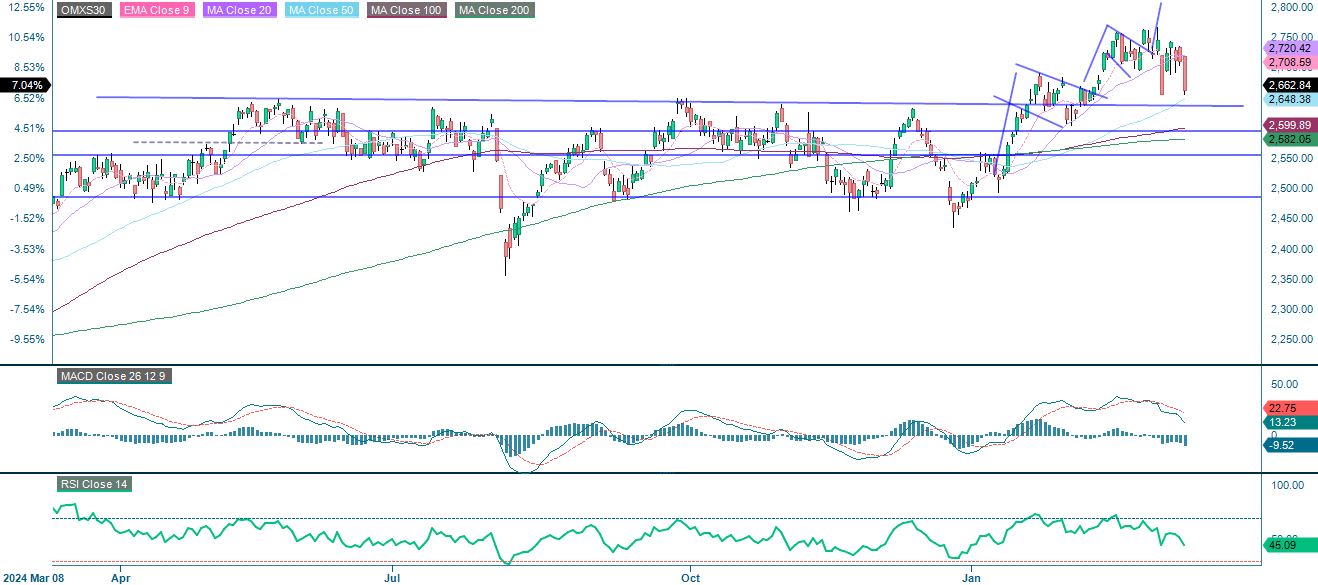
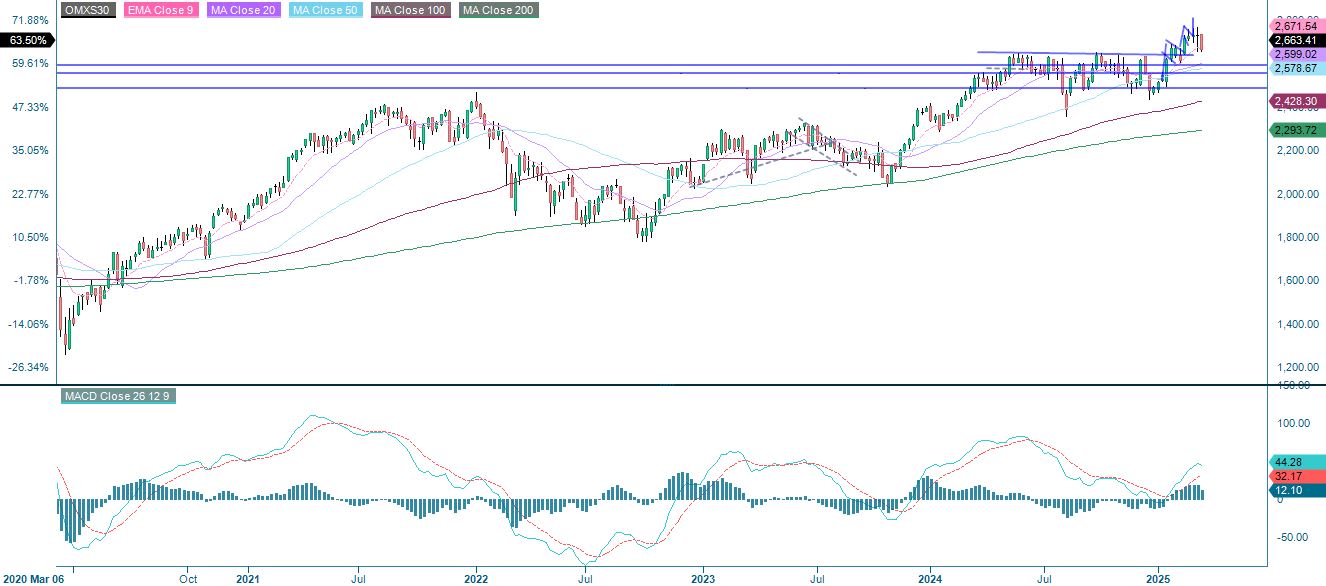
In Sweden, the OMXS30 is struggling with weak sentiment in the US. If the economic data from the US deteriorates, this will most likely have an even stronger impact on the European indices. The next support level for the OMXS30 is between 2,640 and 2,48.
OMXS30 (in SEK), one-year daily chart
OMXS30 (in SEK), weekly five-year chart
Meanwhile, the German DAX is now trading at support of around 22,330. The next level on the downside is found around 21,730.
DAX (in EUR), one-year daily chart

DAX (in EUR), weekly five-year chart

The full name for abbreviations used in the previous text:
EMA 9: 9-day exponential moving average
Fibonacci: There are several Fibonacci lines used in technical analysis. Fibonacci numbers are a sequence in which each successive number is the sum of the two previous numbers.
MA20: 20-day moving average
MA50: 50-day moving average
MA100: 100-day moving average
MA200: 200-day moving average
MACD: Moving average convergence divergence
Risks
Credit risk of the issuer:
Investors in the products are exposed to the risk that the Issuer or the Guarantor may not be able to meet its obligations under the products. A total loss of the invested capital is possible. The products are not subject to any deposit protection.
Currency risk:
If the product currency differs from the currency of the underlying asset, the value of a product will also depend on the exchange rate between the respective currencies. As a result, the value of a product can fluctuate significantly.
External author:
This information is in the sole responsibility of the guest author and does not necessarily represent the opinion of Bank Vontobel Europe AG or any other company of the Vontobel Group. This information is sponsored by Bank Vontobel Europe AG, which may be a counterparty to transactions involving the financial instruments discussed in this information. The further development of the index or a company as well as its share price depends on a large number of company-, group- and sector-specific as well as economic factors. When forming his investment decision, each investor must take into account the risk of price losses. Please note that investing in these products will not generate ongoing income.
The products are not capital protected, in the worst case a total loss of the invested capital is possible. In the event of insolvency of the issuer and the guarantor, the investor bears the risk of a total loss of his investment. In any case, investors should note that past performance and / or analysts' opinions are no adequate indicator of future performance. The performance of the underlyings depends on a variety of economic, entrepreneurial and political factors that should be taken into account in the formation of a market expectation.
Market risk:
The value of the products can fall significantly below the purchase price due to changes in market factors, especially if the value of the underlying asset falls. The products are not capital-protected
Product costs:
Product and possible financing costs reduce the value of the products.
Risk with leverage products:
Due to the leverage effect, there is an increased risk of loss (risk of total loss) with leverage products, e.g. Bull & Bear Certificates, Warrants and Mini Futures.