Nearly oversold US bear markets


Gold is our case this week. After hitting record highs until the 20th of February, the precious metal has suffered a setback. Gold is perceived as a safe-haven asset in an environment where investor and consumer confidence has fallen recently, most likely mainly due to various policy changes and proposals coming out of the White House in Washington D.C. However, from a technical point of view, US equity markets are already starting to look oversold.
Case of the week: Gold grinds higher amid nervous markets
Since the beginning of the year, the international gold price has continued last year's strong trend. From the start of the year to 20 February, both the Gold Index and London spot gold rose by more than 10%, repeatedly breaking records.
However, the gold market has experienced stalled momentum since 10 February, with the gold price consolidating at high levels for almost ten trading days. One day after reaching a new record high, gold dropped on Tuesday, 25 February, slipping 1.9% alongside US equities. Nonetheless, many believe that the uptrend could continue due to ongoing geopolitical issues and that any short-term pullback could be seen as an opportunity to go long again.
Why did the gold price suddenly plummet? There are a number of complex, intertwined factors behind these significant price movements. In our view, there are four main reasons: 1) Easing geopolitical risks, particularly with regard to Russia and Ukraine. 2) Uncertainty about the Fed's path. 3) Some investors deciding to take profits at the top, leading to technical selling, and 4) Trump's tariff policy.
On the 27th February, the spot gold price fell below the key psychological level of $2,900. Trump's comments spurred a rally in the USD, making dollar-denominated gold more expensive for holders of other currencies. Although gold is seen as a safe-haven asset, market concerns over trade uncertainty could lead to further profit-taking as the USD strengthens.
The Gold market fell significantly during the early hours of Friday 28 February. The breakout below the support zone at $2,880 strengthened the bearish pressure on gold, accelerating the ongoing downward correction. Some believe investors were taking profit out of the gold market to cover losses in other markets. While the market will continue to be noisy, we think the overall outlook remains positive due to ongoing tariff wars and concerns over geopolitical issues. Investors will pay close attention to the $2,800 level, as it is not only a psychologically significant figure but also represents previous resistance.
From a technical perspective, gold's upturn on Monday, 3rd March, was strong and it appears likely tobreak through the key resistance of a previous high of $2,880-$2,900. On the daily chart, gold initially shook off the previous downward pressure and began to enter a phase of technical rebound. Considering that short-term market risk sentiment remains cautious, to sustain this higher level, bulls will need to align with the fundamentals, especially the market’s reaction once the new US tariff measures take effect.
Overall, whether gold price can reach a new high level with the next breakout depends on the building of expectations for Fed interest rate cuts, the continued decline in US Treasury bond yields, and the evolution of market sentiment following the implementation of new tariffs.
In summary, gold has short-term investment risks, as the 20-day moving average has reversed direction on the daily chart. In the longer term, however, gold prices are expected to remain high in 2025. The reasons for this include ongoing concerns about the US fiscal deficit, which could drive investors to increase their gold allocations, and central banks (such as, China) potentially to further diversify their USD reserves amid rising trade tensions and geopolitical risks.
Gold spot price (USD/troy ounce), one-year daily chart

Gold spot price (USD/troy ounce), five-year weekly chart

Macro comments
As we showed in the last weekly letter, US equity markets have started 2025 weak, particularly the Russell 2000 and the Nasdaq. In addition, President Trump's actions on everything from tariffs to peace plans are contributing to a deterioration in business and household sentiment. Relatively strong services PMI (Purschasing Managers’ Index) figures from a number of developed countries today (Wednesday 5 February), as well as strong US non-farm payrolls data due on Friday 7 February, may ease investor uncertainty about the economy.
US and euro area service PMIs from March 2023 to February 2025

Today, Wednesday 5 March, the macroeconomic agenda is dominated by the February services PMIs from Japan, China, Sweden, Spain, Italy, France, Germany, the Eurozone, the UK and the US. We also get French industrial production for January, Italian GDP (Gross Domestic Product) for the fourth quarter, Eurozone PPI (Producer Price Index) for January, US industrial orders for January and the Fed Beige Book.
On Thursday, 6 March, Zalando reports its interim results, and we also get Norwegian traffic figures for February. At 8.00 CET Swedish CPI (Consumer Price Index) for February and the Q4 current account balance are due. Three hours later, Eurozone retail sales for January will be released. In the afternoon, the ECB (European Central Bank) makes an interest rate announcement. From the US, we get the Challenger job cuts for February, Q4 productivity, the trade balance for January, initial jobless claims and wholesale inventories for January.
Friday the 7th begins with Chinese Trade Balance for January. This is followed by German Industrial Orders and French Trade Balance for January. Then we move on to North America with the US Nonfarm Payrolls for February, where market expectations are for 143K new jobs.
Rising long-term positive trend at risk. An opportunity for the brave?
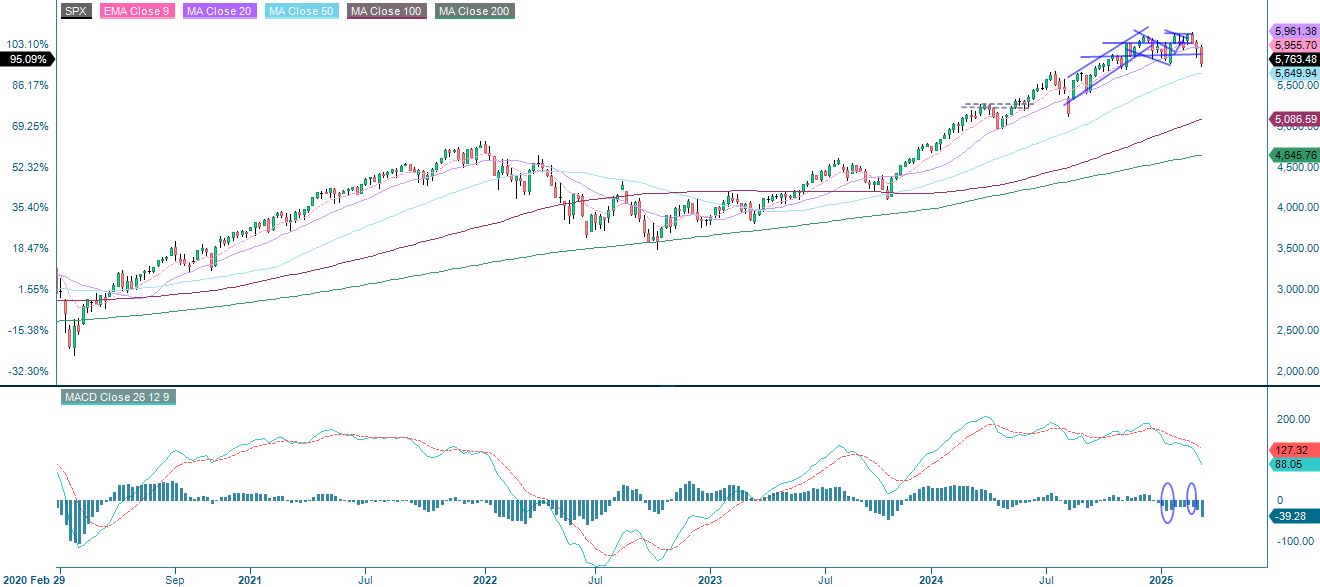
The S&P 500 is currently trading at the MA200 which acts as a support. A break below and the long term uptrend will be broken. The next level on the downside is around 5,650. However, note that support is also found at 5,650 on the 5-year weekly chart. The index is approaching oversold levels on the daily chart. The last two times the RSI (Relative Strength Index) was at these levels, in April 2024 and August 2024, the index bounced nicely. Is this an opportunity for the brave to go long?
S&P 500 (in USD), one-year daily chart

S&P 500 (in USD), weekly five-year chart
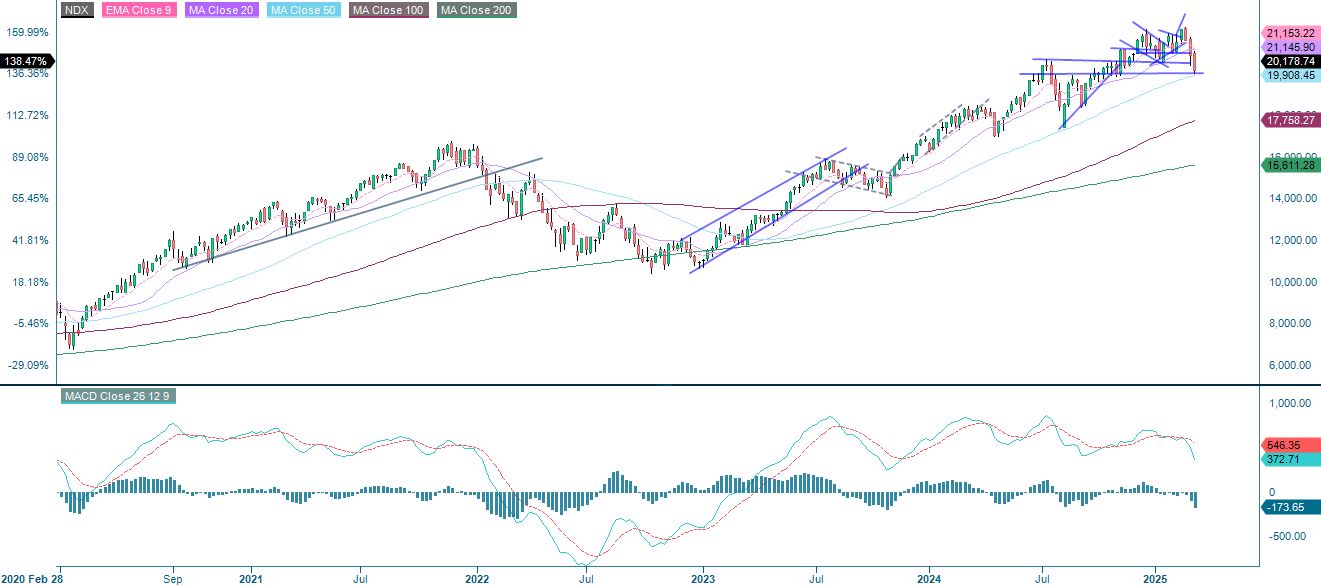
The NASDAQ-100 is trading below the MA200 but is close to support around the 20,000 level. A break to the downside and the next level of support is around 19,500. However, like the S&P 500, the Nasdaq 100 looks oversold. Going long around these levels could be a play for the brave.
NASDAQ-100 (in USD), one-year daily chart

NASDAQ-100 (in USD), weekly five-year chart
In Sweden, the OMXS30 is trading below the MA20 and the short term uptrend can be seen as broken. The next level on the downside is around 2,640. Looking at both the MACD and the RSI, the downside appears to be greater at current levels compared to the S&P 500 and the Nasdaq 100. However, as money continues to flow from the US to Europe, a spread (such as short OMXS30 long S&P 500) may not be as attractive. Rather, placing buy orders around the next level of support may be a better alternative for the brave.
OMXS30 (in SEK), one-year daily chart

OMXS30 (in SEK), weekly five-year chart

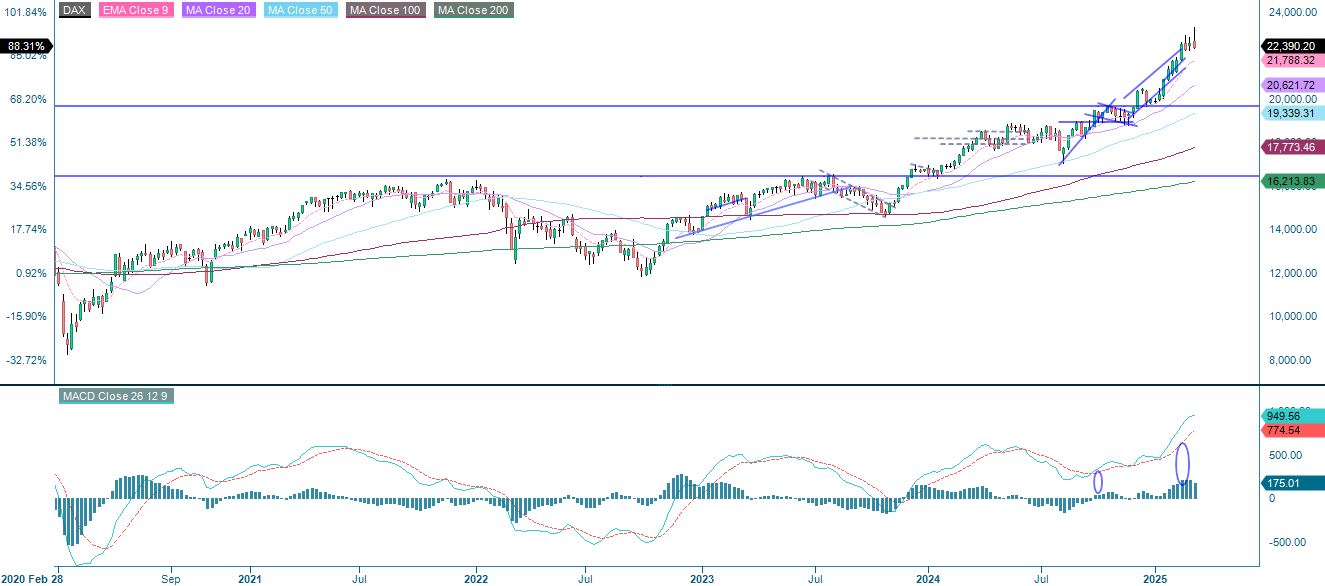
The German DAX is showing resilience to the surrounding markets. This can also be interpreted as a real sign of strength for long-term trading, and can also be interpreted as the market not being too worried about Trump's peace plans at the moment. In the short term, however, the risk has shifted to the downside. In the event of a break to the downside, the 21,750 level could be the next target.
DAX (in EUR), one-year daily chart

DAX (in EUR), weekly five-year chart
The full name for abbreviations used in the previous text:
EMA 9: 9-day exponential moving average
Fibonacci: There are several Fibonacci lines used in technical analysis. Fibonacci numbers are a sequence in which each successive number is the sum of the two previous numbers.
MA20: 20-day moving average
MA50: 50-day moving average
MA100: 100-day moving average
MA200: 200-day moving average
MACD: Moving average convergence divergence
Risks
Credit risk of the issuer:
Investors in the products are exposed to the risk that the Issuer or the Guarantor may not be able to meet its obligations under the products. A total loss of the invested capital is possible. The products are not subject to any deposit protection.
Currency risk:
If the product currency differs from the currency of the underlying asset, the value of a product will also depend on the exchange rate between the respective currencies. As a result, the value of a product can fluctuate significantly.
External author:
This information is in the sole responsibility of the guest author and does not necessarily represent the opinion of Bank Vontobel Europe AG or any other company of the Vontobel Group. This information is sponsored by Bank Vontobel Europe AG, which may be a counterparty to transactions involving the financial instruments discussed in this information. The further development of the index or a company as well as its share price depends on a large number of company-, group- and sector-specific as well as economic factors. When forming his investment decision, each investor must take into account the risk of price losses. Please note that investing in these products will not generate ongoing income.
The products are not capital protected, in the worst case a total loss of the invested capital is possible. In the event of insolvency of the issuer and the guarantor, the investor bears the risk of a total loss of his investment. In any case, investors should note that past performance and / or analysts' opinions are no adequate indicator of future performance. The performance of the underlyings depends on a variety of economic, entrepreneurial and political factors that should be taken into account in the formation of a market expectation.
Market risk:
The value of the products can fall significantly below the purchase price due to changes in market factors, especially if the value of the underlying asset falls. The products are not capital-protected
Product costs:
Product and possible financing costs reduce the value of the products.
Risk with leverage products:
Due to the leverage effect, there is an increased risk of loss (risk of total loss) with leverage products, e.g. Bull & Bear Certificates, Warrants and Mini Futures.