Opportunities in China


Last week we pointed out that the Shanghai stock exchange has significantly underperformed the US and European stock indices. There are some interesting Chinese companies with good growth potential that have been caught up in the fall. One of these is Baidu, which is the case of this week.
Case of the week: Baidu’s growth prospects could be undervalued
Baidu stumbles in Q2, but long-term growth could make it a smart buy.
Back in April this year, we highlighted that Baidu was poised for a possible short-term bounce after the Q1-report if it beat expectations. The share price rose by around 10% the following week, but has since fallen back to even lower levels than before our comment and is now trading at around USD 85.
After posting positive year-on-year revenue growth in Q1, Baidu was unable to maintain its business momentum in Q2. The company generated revenues of $4.67 billion, flat year-over-year and below the consensus estimate of around $4.74 billion. The shortfall was largely due to a 2% year-on-year decline in Baidu's core online marketing business. However, the company's Artificial Intelligence (AI) cloud business saw accelerated growth, with a 14% year-over-year increase in the quarter, contributing to a 10% year-over-year increase in Baidu Core's non-online marketing revenue.
In Q2, Baidu introduced ERNIE 4.0 Turbo, expanding its portfolio of generative AI models. The developer community for PaddlePaddle (Parallel Distributed Deep Learning) and ERNIE has now grown to 14.7 million members. In addition, Apollo Go, Baidu's autonomous ride-hailing service, delivered 899,000 rides in the quarter, reflecting a 26% year-over-year increase. The service has also commenced fully driverless operations in Wuhan. With the upcoming sixth-generation autonomous vehicle, RT6, priced at less than $30,000 per unit, Baidu expect to achieve unit economics break-even for its robotaxi business, a critical milestone for scaling nationwide in the coming years.
Following Baidu's Q2 report, the consensus revenue estimate for the full year has been revised down to $19.08 billion, reflecting 2% year-over-year growth, from the previous estimate of $19.35 billion, which projected 3.5% growth. Wall Street estimates have also narrowed, ranging from $18.73 billion to $19.95 billion. Growth forecasts for 2025 have been reduced. Given the company's ongoing "search" transformation and the challenging macroeconomic environment, the outlook for Baidu's core online marketing segment remains highly uncertain, making the adjustment to future revenue growth forecasts reasonable. However, with Baidu's AI cloud, powered by ERNIE, and its Apollo Go autonomous robot taxi business positioned as long-term growth drivers, a 5-year revenue Compound Annual Growth Rate (CAGR) of 7.5% remains a reasonable assumption according to some analysts.
Despite a Q2 below expectations, Baidu stands out as the owner of China’s largest search engine, commanding a dominant market share of 52%, according to Statcounter. While China’s economy has challenges with regard to consumer spending, Baidu manages to deliver solid operating income and free cash flow results which gives a strong long-term potential for attractive capital returns. Given the share price decline in the last few months, combined with the future possibilities, this might be the right time to buy the Baidu share.
Baidu (in HKD), one-year daily chart

Baidu (in HKD), five-year weekly chart

Macro comments
The federal reserve (Fed) cut the US federal funds rate by 50 basis points (bp) on 18 September. The forecast is for a further 50bp cut over the rest of 2024. This compares with a market expectation of a further 70bps as of late last week. The main reason for the Fed's move was that the US labour market has weakened since August, including a lower wage growth.
The world's major stock markets (with the exception of Shanghai) have continued a modest uptrend after recovering from the sharp fall in early August. The Fed's 50bp rate cut last week added to this. In this context, the brief but sharp breakout in the Volatility Index (VIX) in early August can be seen as a parenthesis or as a warning that new turbulence may arise, sooner or later. The VIX is again trading at a low level of around 16 and represents an opportunity to hedge one's equity portfolio.
US Volatility Index (VIX) in USD, weekly five-year performance

From Sweden, on Wednesday 25th September we will get August producer price index (PPI) and an interest rate statement from the Riksbank. A French household confidence indicator for September is also due.
The US will contribute with new home sales for August and oil inventories, a weekly statistic, reported by the department of energy (DOE). Wednesday will also see the release of interim results from Micron Technology and Cintas.
On the European macroeconomic calendar for Thursday 26th september, Sweden's trade balance and household credit for August and Germany's Gesellschaft für Konsumforschung (GfK) consumer confidence for October are due. From the US, durable goods orders for August, Q2 gross domestic product (GDP), initial jobless claims, August pending home sales and the September Kansas City Fed index are due. Thursday will also see the release of H&M's interim results (OMX Stockholm), followed by Accenture and Costco Wholesale (in the US).
On Friday the 27th we will get French and Spanish consumer price index (CPI) for September, Spanish GDP for Q2 and German unemployment for September. In the US, we will see the August Private Consumption and Inflation (PCE) and the September Michigan index.
Equity indices close to resistance
The DAX is trading close to resistance. A break to the upside seems to need a specific trigger, such as US inflation figures. Perhaps Powell's speech on Thursday will help. However, watch out for a potential double top reversal pattern as well as the negative divergence between the index and the MACD.
DAX (in EUR), one-year daily chart
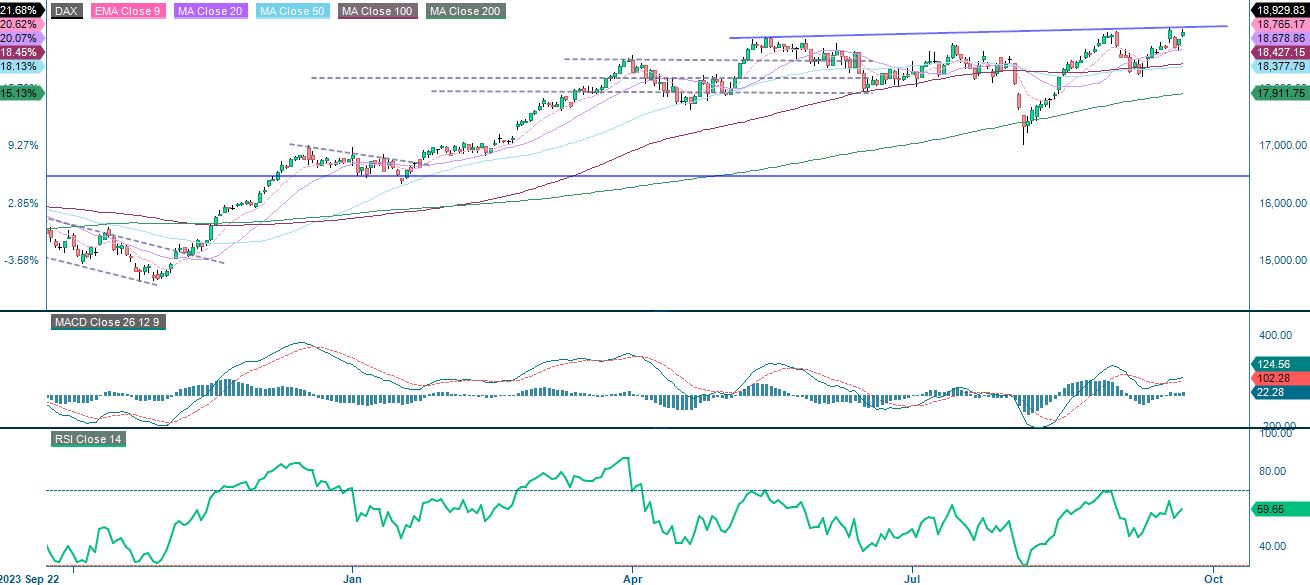
DAX (in EUR), weekly five-year chart

Like the German DAX, the Swedish OMXS30 is trading close to resistance. Again, there is a negative divergence between the index and MACD.
OMXS30 (in SEK), one-year daily chart

OMXS30 (in SEK), weekly five-year chart

The Fed's 50 point rate cut gave the US S&P 500 a boost. However, the index has traded sideways in recent days. It is worth noting that the market is pricing in a relatively high probability of another 50 point rate cut. This means that the market is ahead of the Fed, which has been more dovish in its communication. Therefore, there is some downside risk given current expectations. The first level on the downside is around 5,650. This is followed by the MA20, currently at 5,595.
S&P 500 (in USD), one-year daily chart

S&P 500 (in USD), weekly five-year chart

The Nasdaq 100 is now trading at resistance. The first level on the downside is found around 19,220.
Nasdaq 100 (in USD), one-year daily chart
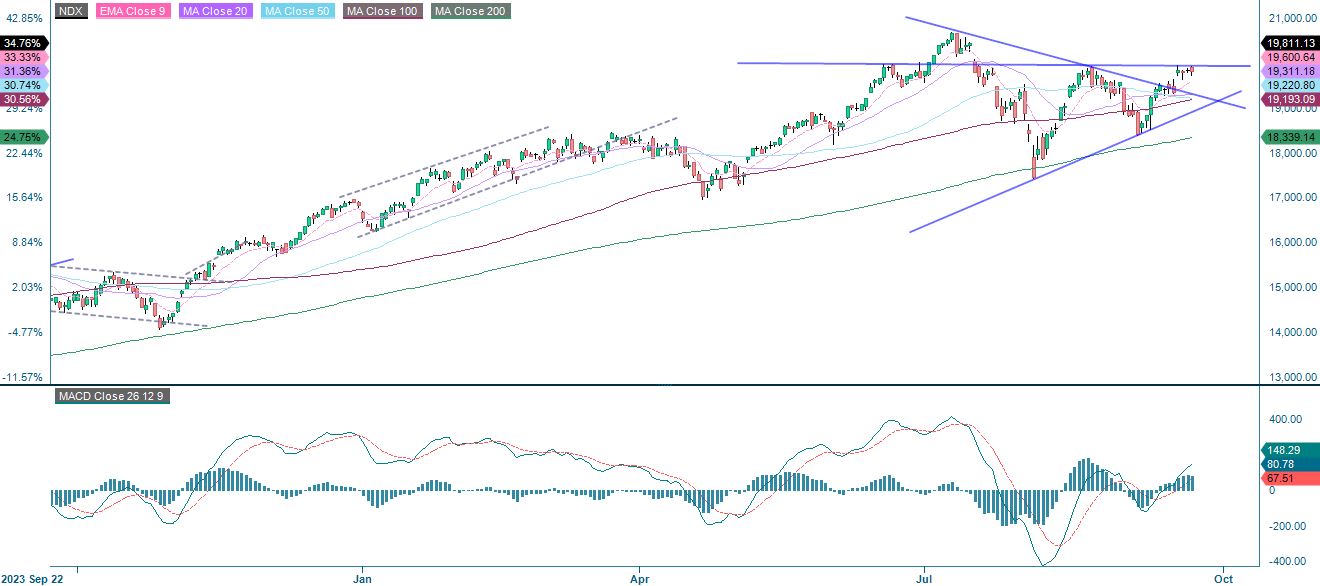
Nasdaq 100 (in USD), weekly five-year chart

The full name for abbreviations used in the previous text:
EMA 9: 9-day exponential moving average
Fibonacci: There are several Fibonacci lines used in technical analysis. Fibonacci numbers are a sequence in which each successive number is the sum of the two previous numbers.
MA20: 20-day moving average
MA50: 50-day moving average
MA100: 100-day moving average
MA200: 200-day moving average
MACD: Moving average convergence divergence
Risks
Credit risk of the issuer:
Investors in the products are exposed to the risk that the Issuer or the Guarantor may not be able to meet its obligations under the products. A total loss of the invested capital is possible. The products are not subject to any deposit protection.
Currency risk:
If the product currency differs from the currency of the underlying asset, the value of a product will also depend on the exchange rate between the respective currencies. As a result, the value of a product can fluctuate significantly.
External author:
This information is in the sole responsibility of the guest author and does not necessarily represent the opinion of Bank Vontobel Europe AG or any other company of the Vontobel Group. This information is sponsored by Bank Vontobel Europe AG, which may be a counterparty to transactions involving the financial instruments discussed in this information. The further development of the index or a company as well as its share price depends on a large number of company-, group- and sector-specific as well as economic factors. When forming his investment decision, each investor must take into account the risk of price losses. Please note that investing in these products will not generate ongoing income.
The products are not capital protected, in the worst case a total loss of the invested capital is possible. In the event of insolvency of the issuer and the guarantor, the investor bears the risk of a total loss of his investment. In any case, investors should note that past performance and / or analysts' opinions are no adequate indicator of future performance. The performance of the underlyings depends on a variety of economic, entrepreneurial and political factors that should be taken into account in the formation of a market expectation.
Market risk:
The value of the products can fall significantly below the purchase price due to changes in market factors, especially if the value of the underlying asset falls. The products are not capital-protected
Product costs:
Product and possible financing costs reduce the value of the products.
Risk with leverage products:
Due to the leverage effect, there is an increased risk of loss (risk of total loss) with leverage products, e.g. Bull & Bear Certificates, Warrants and Mini Futures.
Disclaimer:
This information is neither an investment advice nor an investment or investment strategy recommendation, but advertisement. The complete information on the products (securities) mentioned herein, in particular the structure and risks associated with an investment, are described in the base prospectus, together with any supplements, as well as the final terms relating to the securities. The base prospectus and final terms constitute the solely binding sales documents for the products mentioned herein. It is recommended that potential investors read these documents before making any investment decision. The documents and the key information document are published on the website of the issuer, Vontobel Financial Products GmbH, Bockenheimer Landstrasse 24, 60323 Frankfurt am Main, Germany, on https://prospectus.vontobel.com and are available from the issuer free of charge. The approval of the prospectus should not be understood as an endorsement of the securities. The securities are products that are not simple and may be difficult to understand. This information includes or relates to figures of past performance. Past performance is not a reliable indicator of future performance. This information may only be distributed or published in countries where such distribution or publication is permitted by applicable law. As stated in the relevant base prospectus, the distribution of the securities mentioned in this information is subject to restrictions in certain jurisdictions. This advertisement may not be reproduced or redistributed without prior permission by Vontobel.
© Bank Vontobel Europe AG and / or affiliated companies. All rights reserved.