Probably a good time for Carlsberg


This week's case features Carlsberg, a non-cyclical company whose earnings could benefit from a weaker US dollar due to its high exposure to sales in emerging markets such as China and South East Asia. Investors will focus on the European Central Bank's (ECB) rate decision on the weekly macro agenda. Meanwhile, technical indicators for the major markets are looking weak.
Case of the week: Carlsberg
Financial market jitters returned after Labour Day, in line with the seasonal pattern. September is historically the weakest month for the US equity market. Technology stocks and cyclicals are among the losers on concerns about high valuations and weaker-than-expected economic data.
In contrast, consumer staples companies are now attracting bids. They are perceived as less cyclical and are sometimes seen as bond proxies due to their predictable dividend yields. They therefore become more attractive as interest rates fall. Brewers are also part of this group.
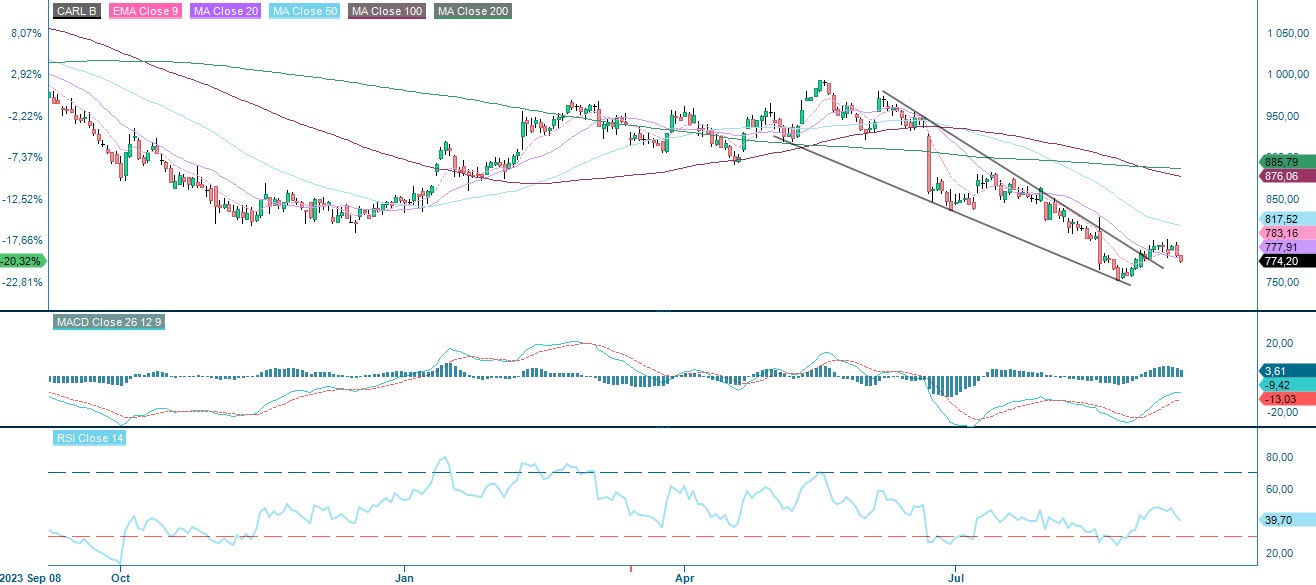
In the Nordic countries, Carlsberg is the bellwether brewer. However, as shown below, Carlsberg shares have underperformed their international peers over the past twelve months.
Carlsberg has a significant presence in China and Southeast Asia. A further weakening of the US dollar in the wake of expected interest rate cuts by the Federal Reserve could benefit emerging markets and, indirectly, companies with exposure to these regions. Around 45% of Carlsberg's sales are generated in emerging markets.
Sales in the second quarter were below expectations as volumes declined due to poor weather in most markets in June this year. However, the weather in Q3 was warm in the key Western European markets. In addition, sporting events such as UEFA Euro 2024 tend to favour beer consumption at the expense of wine consumption. Following the Q2 2024 report, Carlsberg raised its full-year organic growth outlook from 1-5 per cent to 4-6 per cent
Carlsberg (CARL B), one-year daily chart (in DKK)
Carlsberg (CARL B), five-year weekly chart (in DKK)

Macro comments
Inditex releases its quarterly results today, Wednesday 11 September. On the macro front, we get the US Consumer Price Index (CPI) for August as well as Department of Energy (DOE) weekly oil inventories.
On Thursday 12 September, we are expecting interim results from Adobe. Swedish and Spanish CPI for August will also be released. The European Central Bank (ECB) will make an interest rate announcement, with the market expecting a 25 point cut. Investors will also be looking for clues as to how many rate cuts the ECB is planning in the future. From the US we will get Producer Price Index (PPI) for August and the weekly jobless claims. These indicators could affect Federal Reserve's (Fed) decision about its future policy rate path.
Friday's (13th September) macroeconomic agenda begins with Japan's Industrial Production in July. This is followed by the French CPI for August and the Euro-zone industrial production for July. From the US, we get import prices for August and the Michigan index for September.
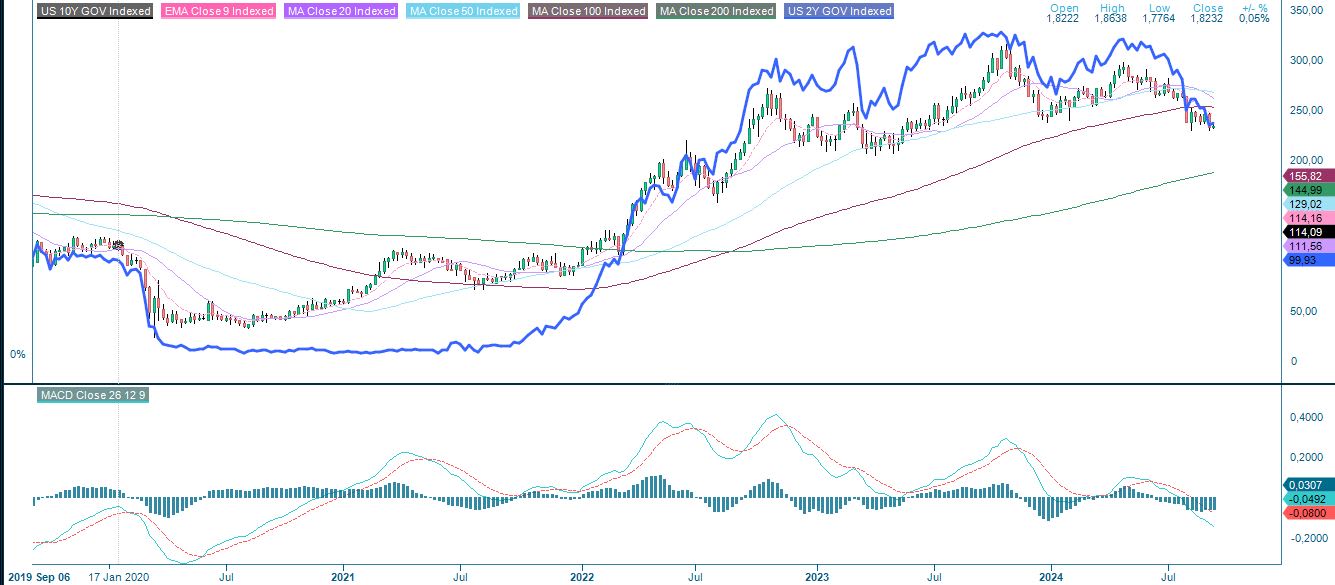
Expectations that central banks including the Fed will cut interest rates in the autumn of 2024 have increased for several months. As a result, the previously inverted interest rate gap between short and long maturities on US government bonds is about to be closed.
US 10-year Treasury yield (red and green) vs US 2-year yield (light blue), weekly five-year chart
Keep stop losses tight
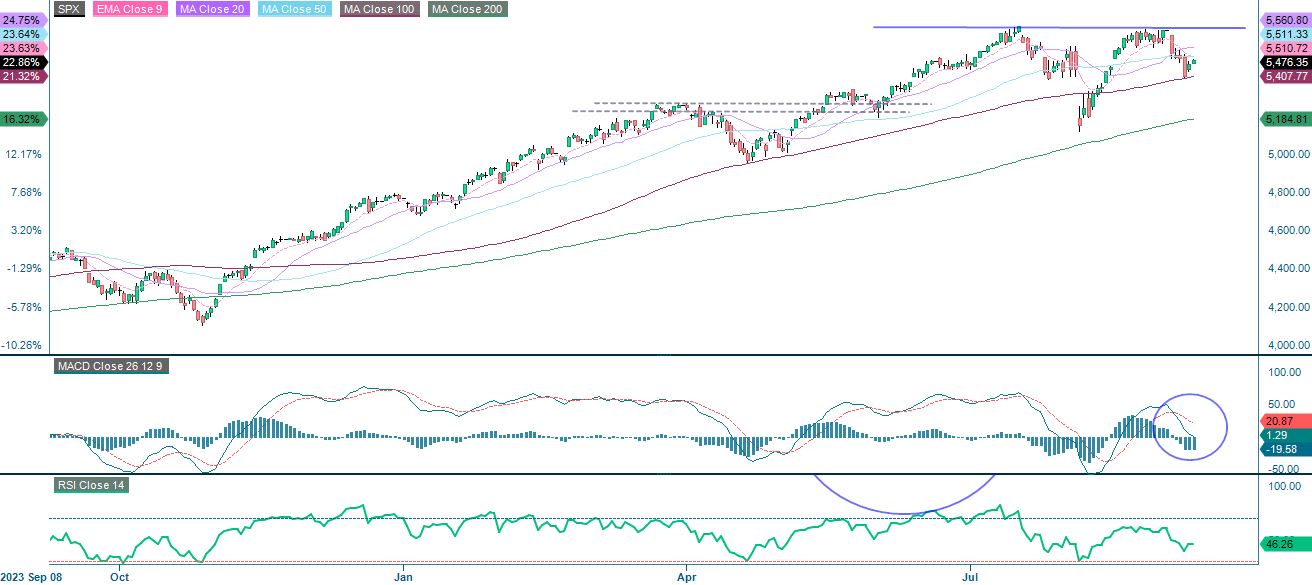
A double top has formed on the S&P 500 and the long term bullish trend is under pressure. The index appears to be bouncing off the support provided by the MA 100, but the downside risk is still very much alive as the MACD is about to give a sell signal. A break below MA100 and 5,185 could be next. A break above MA50 and MA20 as well as the double top is needed for us to feel comfortable in the long term uptrend. So be careful and keep your stop losses tight.
S&P 500 (in USD), one-year daily chart
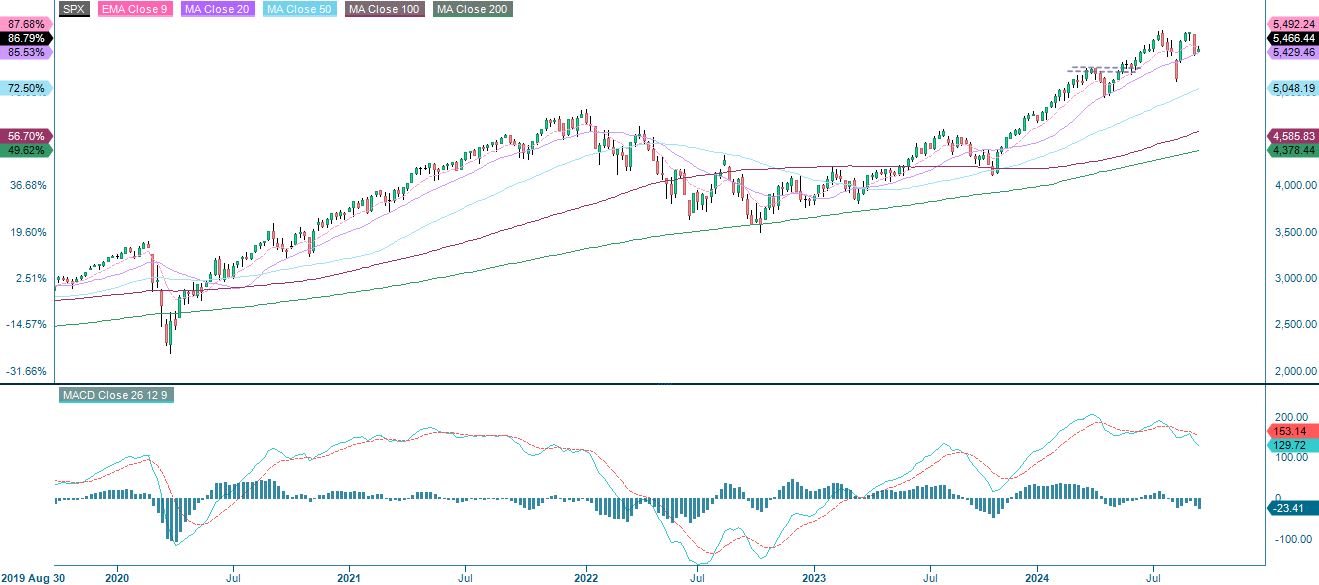
S&P 500 (in USD), weekly five-year chart
Meanwhile, the Nasdaq 100 is consolidating in what can be seen as a large neutral wedge formation - calling for a large move in the direction of the break. Again, keep stop losses tight.
Nasdaq 100 (in USD), one-year daily chart

Nasdaq 100 (in USD), weekly five-year chart

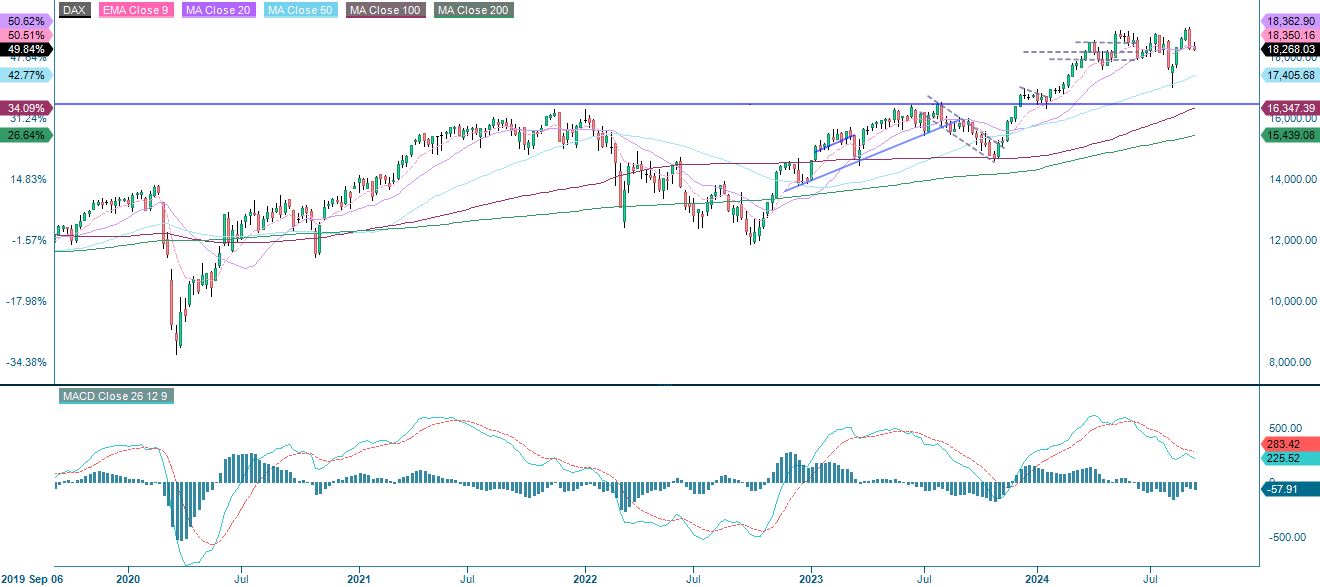
The German DAX is currently trading below the MA50 and MA100 as the MACD recently gave a soft sell signal. The next level on the downside is around 18,000.
DAX (in EUR), one-year daily chart

DAX (in EUR), weekly five-year chart
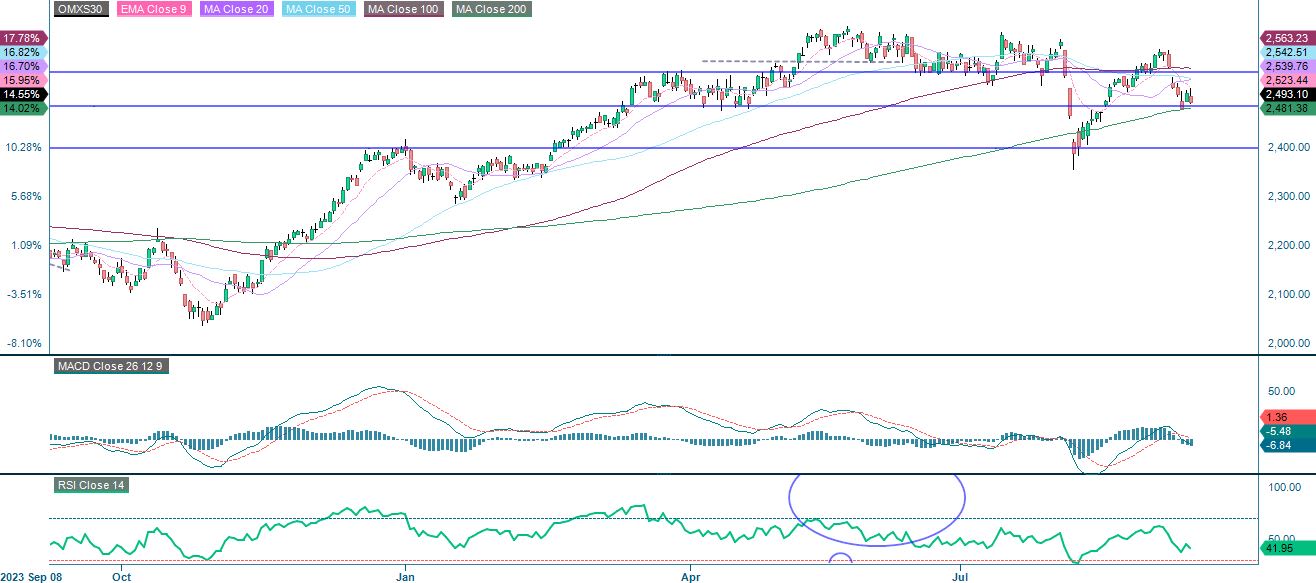
The downside risk is even more evident on the OMXS30 as the index is trading just above the support formed by the MA200 at 2,481. The MACD has given a sell signal. In case of a breach, 2,400 could be the next target.
OMXS30 (in SEK), one-year daily chart
OMXS30 (in SEK), weekly five-year chart

The full name for abbreviations used in the previous text:
EMA 9: 9-day exponential moving average
Fibonacci: There are several Fibonacci lines used in technical analysis. Fibonacci numbers are a sequence in which each successive number is the sum of the two previous numbers.
MA20: 20-day moving average
MA50: 50-day moving average
MA100: 100-day moving average
MA200: 200-day moving average
MACD: Moving average convergence divergence
Risks
External author:
This information is in the sole responsibility of the guest author and does not necessarily represent the opinion of Bank Vontobel Europe AG or any other company of the Vontobel Group. This information is sponsored by Bank Vontobel Europe AG, which may be a counterparty to transactions involving the financial instruments discussed in this information. The further development of the index or a company as well as its share price depends on a large number of company-, group- and sector-specific as well as economic factors. When forming his investment decision, each investor must take into account the risk of price losses. Please note that investing in these products will not generate ongoing income.
The products are not capital protected, in the worst case a total loss of the invested capital is possible. In the event of insolvency of the issuer and the guarantor, the investor bears the risk of a total loss of his investment. In any case, investors should note that past performance and / or analysts' opinions are no adequate indicator of future performance. The performance of the underlyings depends on a variety of economic, entrepreneurial and political factors that should be taken into account in the formation of a market expectation.
Credit risk of the issuer:
Investors in the products are exposed to the risk that the Issuer or the Guarantor may not be able to meet its obligations under the products. A total loss of the invested capital is possible. The products are not subject to any deposit protection.
Market risk:
The value of the products can fall significantly below the purchase price due to changes in market factors, especially if the value of the underlying asset falls. The products are not capital-protected
Risk with leverage products:
Due to the leverage effect, there is an increased risk of loss (risk of total loss) with leverage products, e.g. Bull & Bear Certificates, Warrants and Mini Futures.
Product costs:
Product and possible financing costs reduce the value of the products.
Currency risk:
If the product currency differs from the currency of the underlying asset, the value of a product will also depend on the exchange rate between the respective currencies. As a result, the value of a product can fluctuate significantly.