Signs of share price recovery

Nvidia's stock has accounted for about half of the Nasdaq's gain so far in 2024. Nvidia's interim report on 28 August will be crucial for the market's further sentiment. From a technical point of view, the short-term trend looks positive, after the rather sharp share price decline during the first week of August.
Case of the week: Momentum building in Nvidia ahead of earnings
Chipmaker Nvidia will report Q2 2024/2025 earnings on 28 August. This is a significant event for financial markets and will likely be a vital determinant of investor sentiment soon. In 2024, the 150 or so per cent gain in Nivida explains around half the year-to-date rise in Nasdaq 100, underlying the importance of this single name for the technology sector as well as the general stock market.
Despite the sharp drop of more than 30 per cent in the summer, recent positive share price action could suggest that we will soon again revisit old highs. Nvidia suppliers have also performed strongly in the last week.
Share performance of Nvidia, ASML and TSMC since 31 July 2024
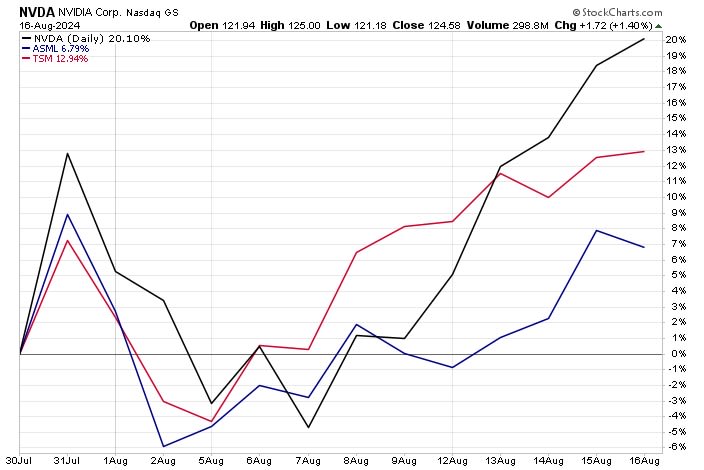
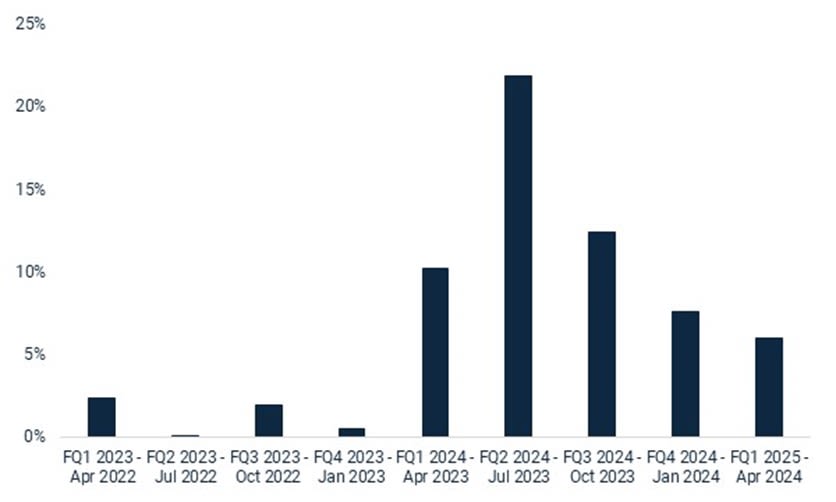
The extraordinary demand for Nvidia GPU computing equipment has translated into soaring growth, and sales in the May to July 2024 quarter are expected to have more than doubled. Given the history of earnings beats compared to consensus estimates (see below), we would anticipate continued strong momentum in the share price ahead of next week's report.
While the high R&D and capex spending reported by tech giants such as Alphabet and Meta to the tune of hundreds of billions of US dollars has been a concern for investors in these companies, this is a further indicator of the strong demand for Nvidia's products. According to a JP Morgan Survey, spending on generative AI hardware is growing by 40 per cent annually. There is a risk that tech companies will eventually rein in spending if returns on the massive AI investments prove to be lower than expected. However, for now, these concerns appear premature.
Nvidia quarterly sales, actual vs estimated, per cent deviation
Given the robust recovery since the August lows of around USD 90 per share, we would not be surprised to see some slight pullback in the shares over the next couple of days. Towards the end of this week, a slew of PMI data is on the macro agenda. Remember that weaker-than-expected ISM spooked the markets at the beginning of August. If Nvidia shares retract to the USD 115 to 120 level, this might provide an opportunity for entry.
Nvidia (USD), one-year daily chart

Nvidia (USD), five-year weekly chart

Macro comments
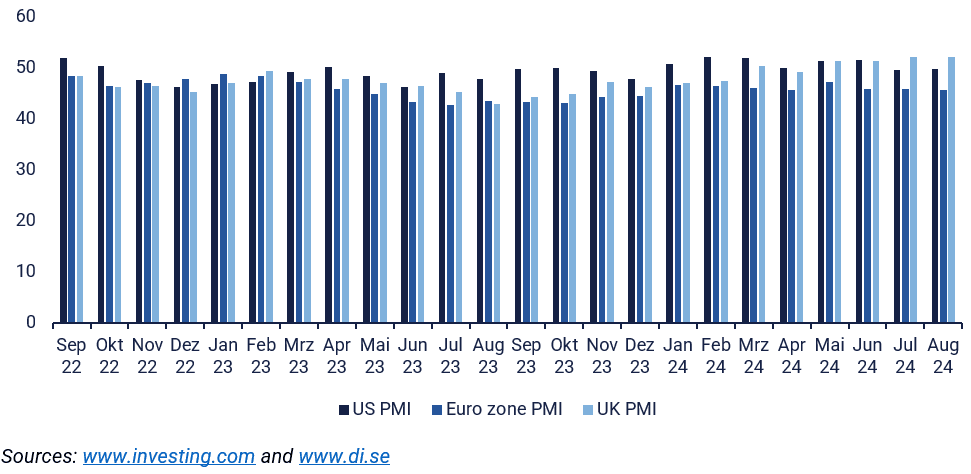
On the macroeconomic calendar, the minutes of the FOMC meeting will be released today, Wednesday 21 August at 20.00. On Thursday, 22 August, the Purchasing Managers' Indexes for August will be released from France, Germany, the Eurozone, the UK and the US. The market expects the US manufacturing PMI to improve slightly to 49.8 in August from 49.6 in July. The Eurozone and UK manufacturing PMIs are expected to end August at roughly the same level as in July (45.7 for the Eurozone and 52.1 for the UK).
US, Eurozone and UK manufacturing PMIs, September 2022 to August 2024 (forecast)
As of Friday 16 August 2024, approximately 465 S&P 500 companies (93% of all companies) have reported their Q2 2024 results. 79% have reported positive earnings surprises, while 60% reported positive revenue surprises. The stock market has been rewarding positive earnings surprises from S&P500 companies in Q2 2024 at average levels. Meanwhile, the market has punished negative earnings surprises more than average.
The average earnings growth rate for S&P500 companies in Q2 2024 is 10.9% as of 16 August. For Q3 2024, the analysts project a 5.2% earnings growth and a 4.9% revenue growth for all S&P50 companies.
Today, Wednesday, 21 August, interim reports from Analog Devices, Synopsys, Target and the TJX Companies are expected. Tomorrow, 22 August, Intuit, Workday and Baidu are scheduled to report.
The short-term trend is positive. Further upside?
The S&P 500 appears to be approaching mid-July levels. Note how the MACD has generated a buy signal. The RSI is also not yet overbought. So, the odds are in favour of further upside. However, for those who have not yet realised profits from buying the dip, now is not a bad opportunity.
S&P 500 (in USD), one-year daily chart

S&P 500 (in USD), weekly five-year chart

The first resistance level for the Nasdaq 100 is around 20,000. In the event of a break to the upside, the next target could be the previous high of mid-July.
Nasdaq 100 (in USD), one-year daily chart

Nasdaq 100 (in USD), weekly five-year chart

The DAX is trading just south of resistance. Note how the MACD is about to give a buy signal.
DAX (in EUR), one-year daily chart

DAX (in EUR), weekly five-year chart

OMXS30 is also stuck at resistance. The heavyweight banks may have peaked in loan profits.Given the index composition – long DAX short OMXS30- this could be an interesting case.
OMXS30 (in SEK), one-year daily chart

Resistance is approaching on the weekly 5-year chart.
OMXS30 (in SEK), weekly five-year chart

The full name for abbreviations used in the previous text:
EMA 9: 9-day exponential moving average
Fibonacci: There are several Fibonacci lines used in technical analysis. Fibonacci numbers are a sequence in which each successive number is the sum of the two previous numbers.
MA20: 20-day moving average
MA50: 50-day moving average
MA100: 100-day moving average
MA200: 200-day moving average
MACD: Moving average convergence divergence
Risks
External author:
This information is in the sole responsibility of the guest author and does not necessarily represent the opinion of Bank Vontobel Europe AG or any other company of the Vontobel Group. This information is sponsored by Bank Vontobel Europe AG, which may be a counterparty to transactions involving the financial instruments discussed in this information. The further development of the index or a company as well as its share price depends on a large number of company-, group- and sector-specific as well as economic factors. When forming his investment decision, each investor must take into account the risk of price losses. Please note that investing in these products will not generate ongoing income.
The products are not capital protected, in the worst case a total loss of the invested capital is possible. In the event of insolvency of the issuer and the guarantor, the investor bears the risk of a total loss of his investment. In any case, investors should note that past performance and / or analysts' opinions are no adequate indicator of future performance. The performance of the underlyings depends on a variety of economic, entrepreneurial and political factors that should be taken into account in the formation of a market expectation.
Credit risk of the issuer:
Investors in the products are exposed to the risk that the Issuer or the Guarantor may not be able to meet its obligations under the products. A total loss of the invested capital is possible. The products are not subject to any deposit protection.
Market risk:
The value of the products can fall significantly below the purchase price due to changes in market factors, especially if the value of the underlying asset falls. The products are not capital-protected
Risk with leverage products:
Due to the leverage effect, there is an increased risk of loss (risk of total loss) with leverage products, e.g. Bull & Bear Certificates, Warrants and Mini Futures.
Product costs:
Product and possible financing costs reduce the value of the products.
Currency risk:
If the product currency differs from the currency of the underlying asset, the value of a product will also depend on the exchange rate between the respective currencies. As a result, the value of a product can fluctuate significantly.