S&P500 and Nasdaq trading at overbought levels


In this week´s case we ask ourselves whether the Coinbase is being fuelled by Bitcoin or whether it is just hot air from the Altcoin hype? After all, there is a risk of the cryptocurrency market consolidating, with only a few winners remaining. From a technical analysis and RSI view, the US equity indices are currently trading at overbought levels.
Case of the week: Coinbase Moon Landing
It's not just stocks that are on a tear this year. Cryptocurrencies are experiencing a massive upswing too, with Bitcoin, the leading cryptocurrency, surging over 60% year-to-date. This rise isn't just due to investors being more willing to take risks. It's also driven by the historic approval of the first-ever Bitcoin exchange-traded funds (ETFs) by U.S. regulators in January. These ETFs saw a staggering $5 billion flow in on their very first day of trading. Riding this wave is Coinbase, a world-renowned cryptocurrency exchange and wallet provider. Year-to-date, Coinbase shares have increased with roughly 55%.
Coinbase's revenue saw a significant boost in the first quarter, more than doubling year-over-year to reach $1.59 billion. This growth was largely driven by a surge in transactional revenue, which nearly tripled. Since Coinbase generates roughly two-thirds of its income from trading spreads, this suggests a significant increase in trading activity. However, the story wasn't just about the Bitcoin ETF launch. Coinbase also highlighted a 30% growth in market capitalization of USDC, a prominent stablecoin pegged to the US dollar. This indicates increased demand for this type of cryptocurrency, which likely contributed to overall trading volume.
In addition to transactional revenue, Coinbase also saw a 41% increase in subscription and service revenue year-over-year to $510.9 million. This growth can be partially attributed to the increasing popularity of Coinbase One, the company's consumer subscription plan. The Coinbase One offers benefits such as zero trading fees and higher interest rates on USDC holdings for a monthly fee starting at $29.99. The programme has performed well, surpassing 400,000 subscribers in the first quarter.
A significant portion of Coinbase´s growth is attributable to altcoins, referring to smaller cryptocurrencies. Altcoins have been a breeding ground for speculation, which is good news for Coinbase in the short term, as these assets come with wider trading spreads that generate a significant portion of their revenue. Over half of Coinbase's transactional revenue in Q1 came from trades that weren't Bitcoin or Ethereum. This highlights the dominance of altcoins in their trading volume. However, there's a potential risk on the horizon. Many believe the cryptocurrency market will eventually consolidate, with only a select few winners remaining. If this happens and speculation around altcoins dries up, it could lead to a decline in the trading spreads that Coinbase relies on for much of its revenue.
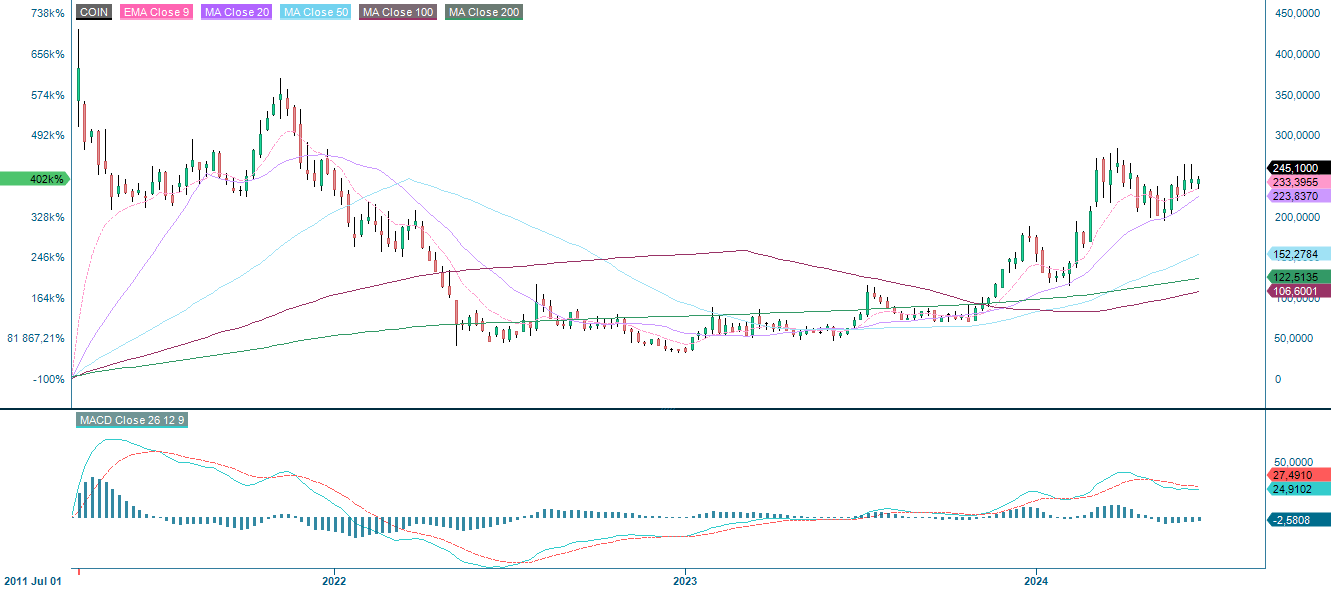
While Coinbase has enjoyed a significant run-up this year, its current valuation raises concerns. At a share price near $245, the company boasts a market cap of $60.0 billion. However, factoring in its $7.1 billion cash holdings and $4.2 billion debt, Coinbase's enterprise value sits at $57.1 billion. Meanwhile, analysts on Wall Street predict revenue of $5.96 billion for Coinbase in fiscal year 2025 (FY25). This represents a 2% year-over-year decline, suggesting an expectation that the current surge in trading activity won't be sustained. With this estimate, Coinbase trades at a ratio of 9.6x EV (Enterprise Value) to FY25 revenue. Furthermore, Coinbase generated $1.0 billion in adjusted EBITDA in Q1. Even assuming Q1's trading volume is maintained and annualizing the company's EBITDA to $4.0 billion, the stock would still trade at a price-to-earnings ratio (P/E) of 14.3x EV/adjusted EBITDA. These figures suggest a substantial portion of Coinbase's potential growth might already be priced into the stock. Given the surge in the share price so far this year, Coinbase might trade at more risk than reward at these levels.
Coinbase (in USD), one-year daily chart

Coinbase (in USD), weekly chart since IPO in April 2021
Macro comments
Chinese statistics for May released on Sunday 16 June showed a relatively stable domestic manufacturing industry, which is expected to grow by 5-7% in 2024. But consumer demand is weak. In addition, construction-related investment is slowing, which has been the case for some time.
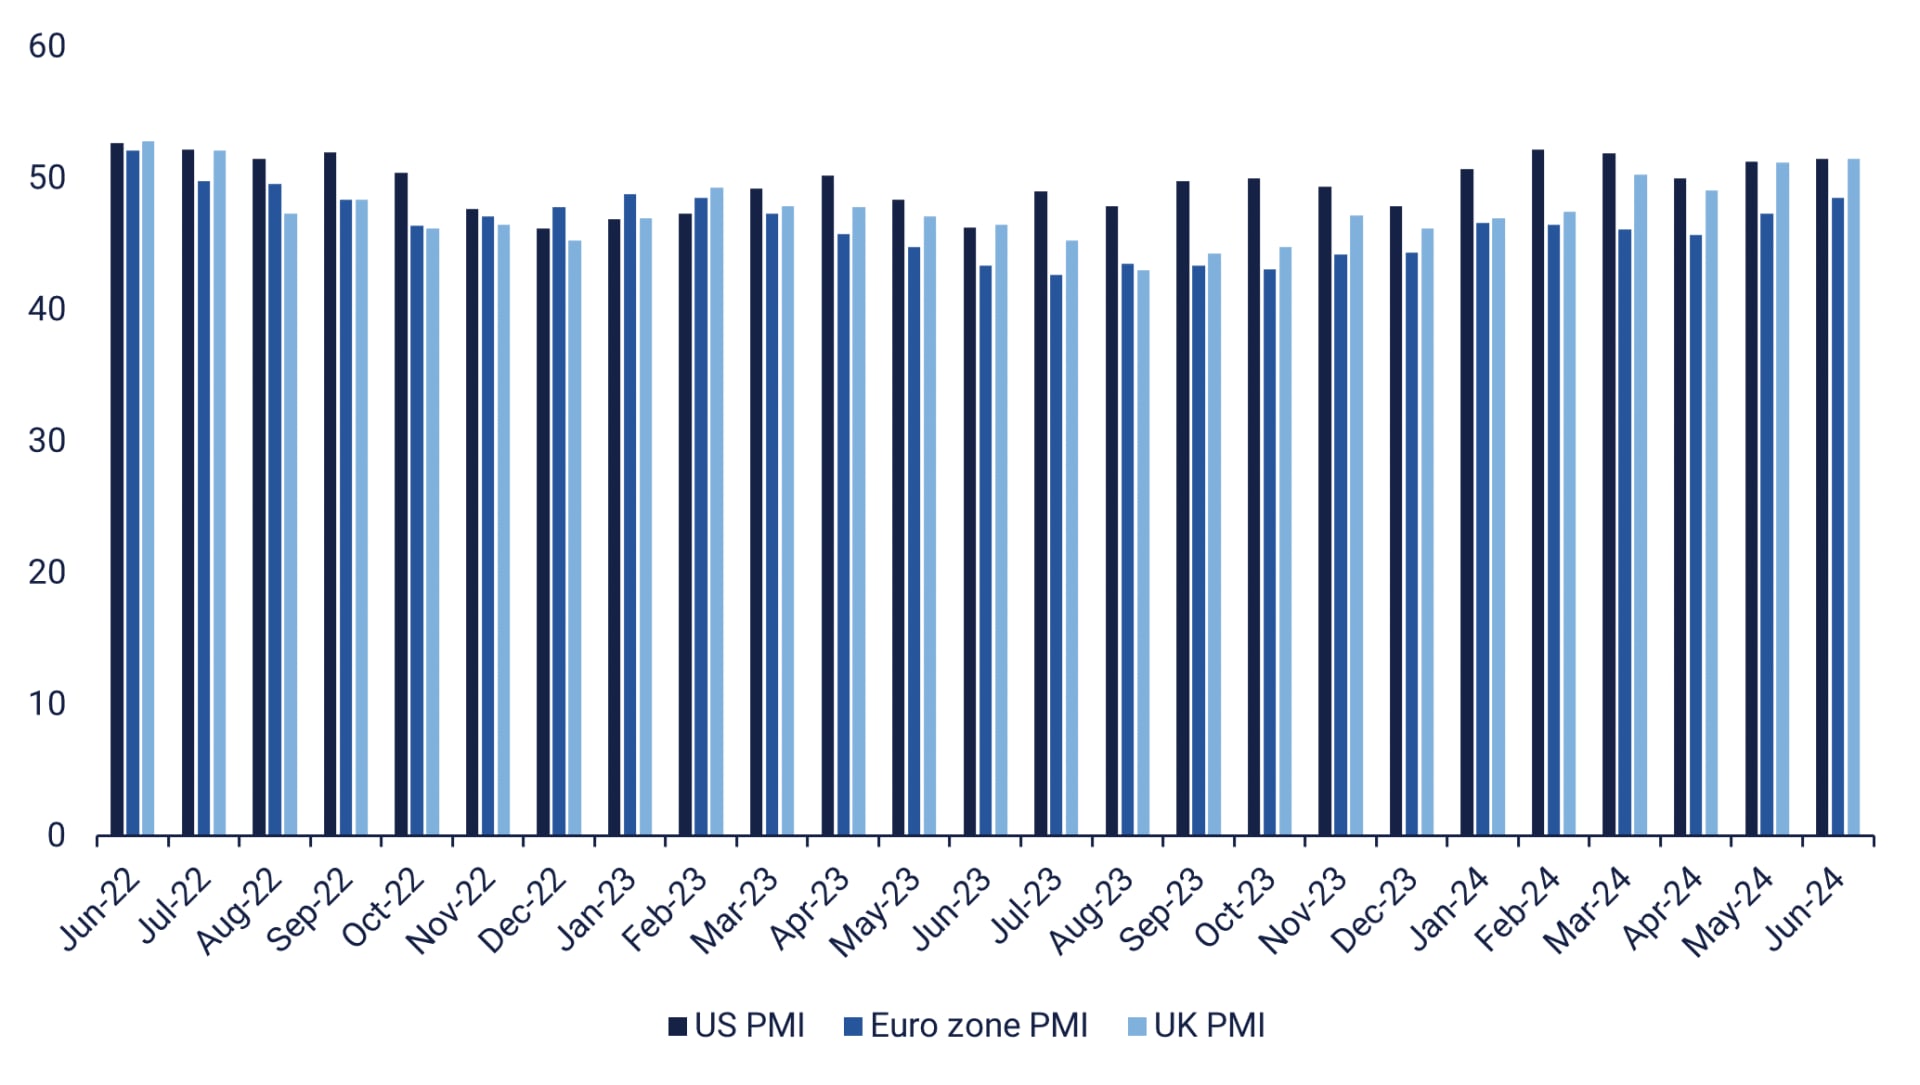
An interim report from Accenture is due on Thursday 20 June. On the same day, the German Producer Price Index for May will be released, giving an indication of the inflation rate, while the Bank of England will publish its interest rate statement. On Friday 21 June we will get the June PMIs from France, Germany, the EU, the UK and the US. The Stockholm Stock Exchange will be closed on Friday for Midsummer Eve celebrations.
Manufacturing PMI for the US, the euro area and the UK June 2022-June 2024 (forecast)
US equity indices overbought according to RSI
The S&P 500 continues to rally, driven by falling interest rates. Momentum is positive and rising. Meanwhile, the relative strenght index (RSI) on both the daily and weekly charts are overbought. However, this is not a clear sell signal. Nevertheless, it might be wise to be cautious around these levels.
S&P 500 (in USD), one-year daily chart

S&P 500 (in USD), weekly five-year chart

RSI for Nasdaq 100 is also indicating overbought levels, and so is the case for many of the Mag7-stocks. A short sell-off driven by profit taking is not unlikely.
Nasdaq 100 (in USD), one-year daily chart
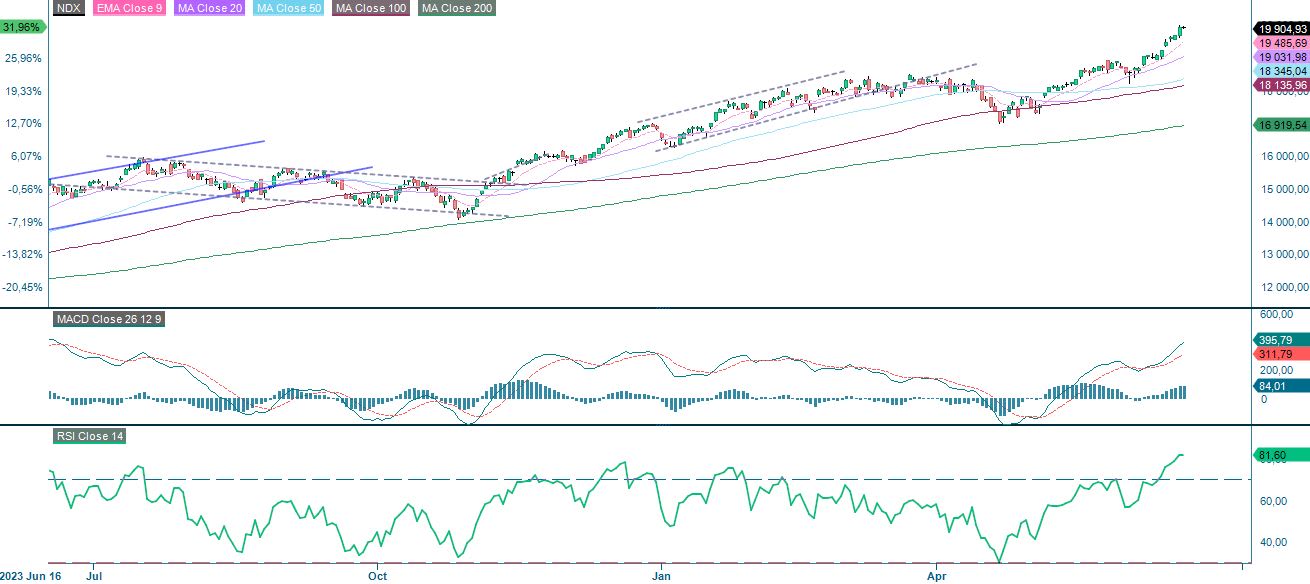
Nasdaq 100 (in USD), weekly five-year chart

As illustrated in the daily chart below, OMXS30 is facing selling pressure as the index is trading below MA50 close to support around 2,560. Also well worth noticing is that MACD has generated a sell signal.
OMXS30 (in SEK), one-year daily chart
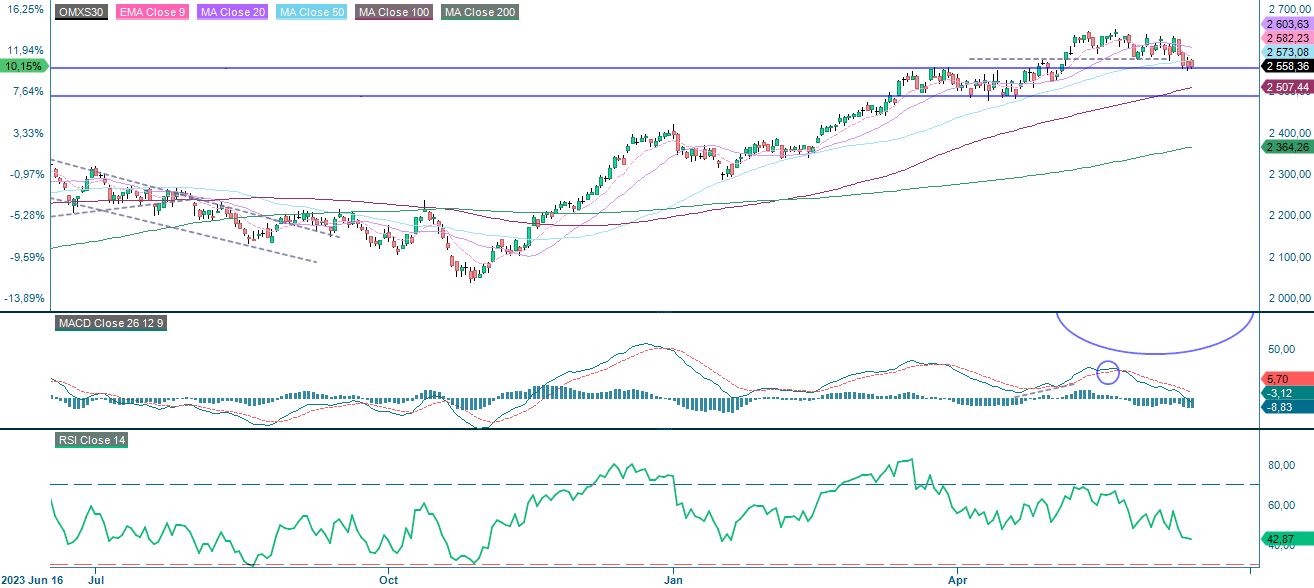
OMXS30 (in SEK), weekly five-year chart

DAX on the other hand has bounced nicely of MA 100. Long DAX short S&P 500 may be an interesting spread.
DAX (in EUR), one-year daily chart

DAX (in EUR), weekly five-year chart

The full name for abbreviations used in the previous text:
EMA 9: 9-day exponential moving average
Fibonacci: There are several Fibonacci lines used in technical analysis. Fibonacci numbers are a sequence in which each successive number is the sum of the two previous numbers.
MA20: 20-day moving average
MA50: 50-day moving average
MA100: 100-day moving average
MA200: 200-day moving average
MACD: Moving average convergence divergence
Risks
External author:
This information is in the sole responsibility of the guest author and does not necessarily represent the opinion of Bank Vontobel Europe AG or any other company of the Vontobel Group. This information is sponsored by Bank Vontobel Europe AG, which may be a counterparty to transactions involving the financial instruments discussed in this information. The further development of the index or a company as well as its share price depends on a large number of company-, group- and sector-specific as well as economic factors. When forming his investment decision, each investor must take into account the risk of price losses. Please note that investing in these products will not generate ongoing income.
The products are not capital protected, in the worst case a total loss of the invested capital is possible. In the event of insolvency of the issuer and the guarantor, the investor bears the risk of a total loss of his investment. In any case, investors should note that past performance and / or analysts' opinions are no adequate indicator of future performance. The performance of the underlyings depends on a variety of economic, entrepreneurial and political factors that should be taken into account in the formation of a market expectation.
Disclaimer:
This information is neither an investment advice nor an investment or investment strategy recommendation, but advertisement. The complete information on the products (securities) mentioned herein, in particular the structure and risks associated with an investment, are described in the base prospectus, together with any supplements, as well as the final terms relating to the securities. The base prospectus and final terms constitute the solely binding sales documents for the products mentioned herein. It is recommended that potential investors read these documents before making any investment decision. The documents and the key information document are published on the website of the issuer, Vontobel Financial Products GmbH, Bockenheimer Landstrasse 24, 60323 Frankfurt am Main, Germany, on https://prospectus.vontobel.com and are available from the issuer free of charge. The approval of the prospectus should not be understood as an endorsement of the securities. The securities are products that are not simple and may be difficult to understand. This information includes or relates to figures of past performance. Past performance is not a reliable indicator of future performance. This information may only be distributed or published in countries where such distribution or publication is permitted by applicable law. As stated in the relevant base prospectus, the distribution of the securities mentioned in this information is subject to restrictions in certain jurisdictions. This advertisement may not be reproduced or redistributed without prior permission by Vontobel.
© Bank Vontobel Europe AG and / or affiliated companies. All rights reserved.
Credit risk of the issuer:
Investors in the products are exposed to the risk that the Issuer or the Guarantor may not be able to meet its obligations under the products. A total loss of the invested capital is possible. The products are not subject to any deposit protection.
Market risk:
The value of the products can fall significantly below the purchase price due to changes in market factors, especially if the value of the underlying asset falls. The products are not capital-protected
Risk with leverage products:
Due to the leverage effect, there is an increased risk of loss (risk of total loss) with leverage products, e.g. Bull & Bear Certificates, Warrants and Mini Futures.
Product costs:
Product and possible financing costs reduce the value of the products.
Currency risk:
If the product currency differs from the currency of the underlying asset, the value of a product will also depend on the exchange rate between the respective currencies. As a result, the value of a product can fluctuate significantly.