US PCE and Euro CPI in focus


This week's case is a follow-up to orange juice, where the price has surged on expectations of limited supply. The market will focus on the ECB's May Consumer Price Index (CPI) figures and the US Personal Consumption Expenditures (PCE) figures for April, both due on Friday the 31st, which could potentially move interest rates.
Case of the week: Orange is the new black, at least for now
Since our last update on frozen concentrated orange juice (FCOJ) in early March, the prices of FCOJ futures prices have trended higher than expected. The lack of favourable weather and clinical progress against citrus greening disease has led to supply expectations drying up. However, as we approach the halfway point of 2024, bullish liquidity may dry up in the second half of the year.
Since our update on FCOJ in early March, the price of the contract for difference (CFD) has risen from ~$360/lb to around ~$480/lb, equivalent to futures prices of $3.6 and $4.8 per pound. This is not unexpected and as discussed in the previous update, while there are still bullish factors, there is little reason for prices to fall. While the US market produces juice that is mainly consumed domestically, producers such as Brazil have struggled to meet export targets. Brazil, the clear leader in orange juice production, reported a stunted outlook for 2024. More specifically, Fundecitrus, an association of citrus growers and juice producers based in São Paulo, reported its growth outlook for the 2024/2025 season. Compared to the previous season, the orange crop is expected to decrease by 24.36%, a result like the low crop of 1989. Furthermore, of the different sub-regions in São Paulo, only two regions have seen an increase in the number of fruits per tree. For the region, the number of oranges on trees has fallen by 29% compared with the 2023/2024 harvest.
A factor that negatively correlates with the number of oranges described above is the maximum temperature in the growing regions. The regions with the lowest number of oranges per tree also have the highest median maximum temperatures, around 34-35 degrees Celsius. Given this negative correlation with high temperatures, it is not ideal that we are about to enter the warm phase of the El Niño phenomenon. As mentioned in the previous update, this phase is associated with prolonged warm temperatures in the São Paulo region. Another factor negatively affecting the crop is fruit drop, which is positively correlated with citrus greening disease. Fruit loss due to greening is expected to increase from 3.08% in the 2022/2023 season, to 5.48% in the 2023/2024 season, to 8.4% in the current 2024/2025 season. This is partly due to a new psyllid that spreads the bacteria that cause greening. The insect is resistant to insecticides, highlighting the need for Invaio Sciences' Trecise technology as mentioned in the previous report.
All in all, FCOJ futures prices have rightly risen as the supply outlook looks bleak. There has not been enough progress in the fight against greening, which means that a large percentage of the crop never makes it to the juice factories. In addition, the weather has not been conducive to growing citrus and, consequently, to juice production. On the demand side, the question is how much of the cost will be passed on to customers. Orange juice in particular accounts for the bulk of all juice sales. It is reasonable to expect empty shelves in the summer as this is the more intense part of the juice consumption cycle. In terms of how futures prices will move, it is possible that liquidity in the futures markets will squeeze out investors, like what was seen in cocoa. However, in terms of "organic" negative price pressure, there are not many triggers that could push prices down. So, while prices are likely to fluctuate as volatility is high, there are more factors pointing upwards than downwards for the second half of 2024.
Orange Juice (USD/Lbs) CFD, one-year daily chart

Orange Juice (USD/Lbs) CFD, five-year weekly chart

Macro comments
Nvidia managed to beat earnings expectations by 11.5% in its quarterly report on Wednesday 22nd May. NVDA shares rose strongly within 24 hours of the quarterly report.
Strong macro data from the US, where the weighted PMI came in at 54.4 versus expectations of 51.2 on Thursday the 23rd, pushed the US ten-year Treasury yield up 6 basis points to 4.48%. It is currently trading at 4.45%.
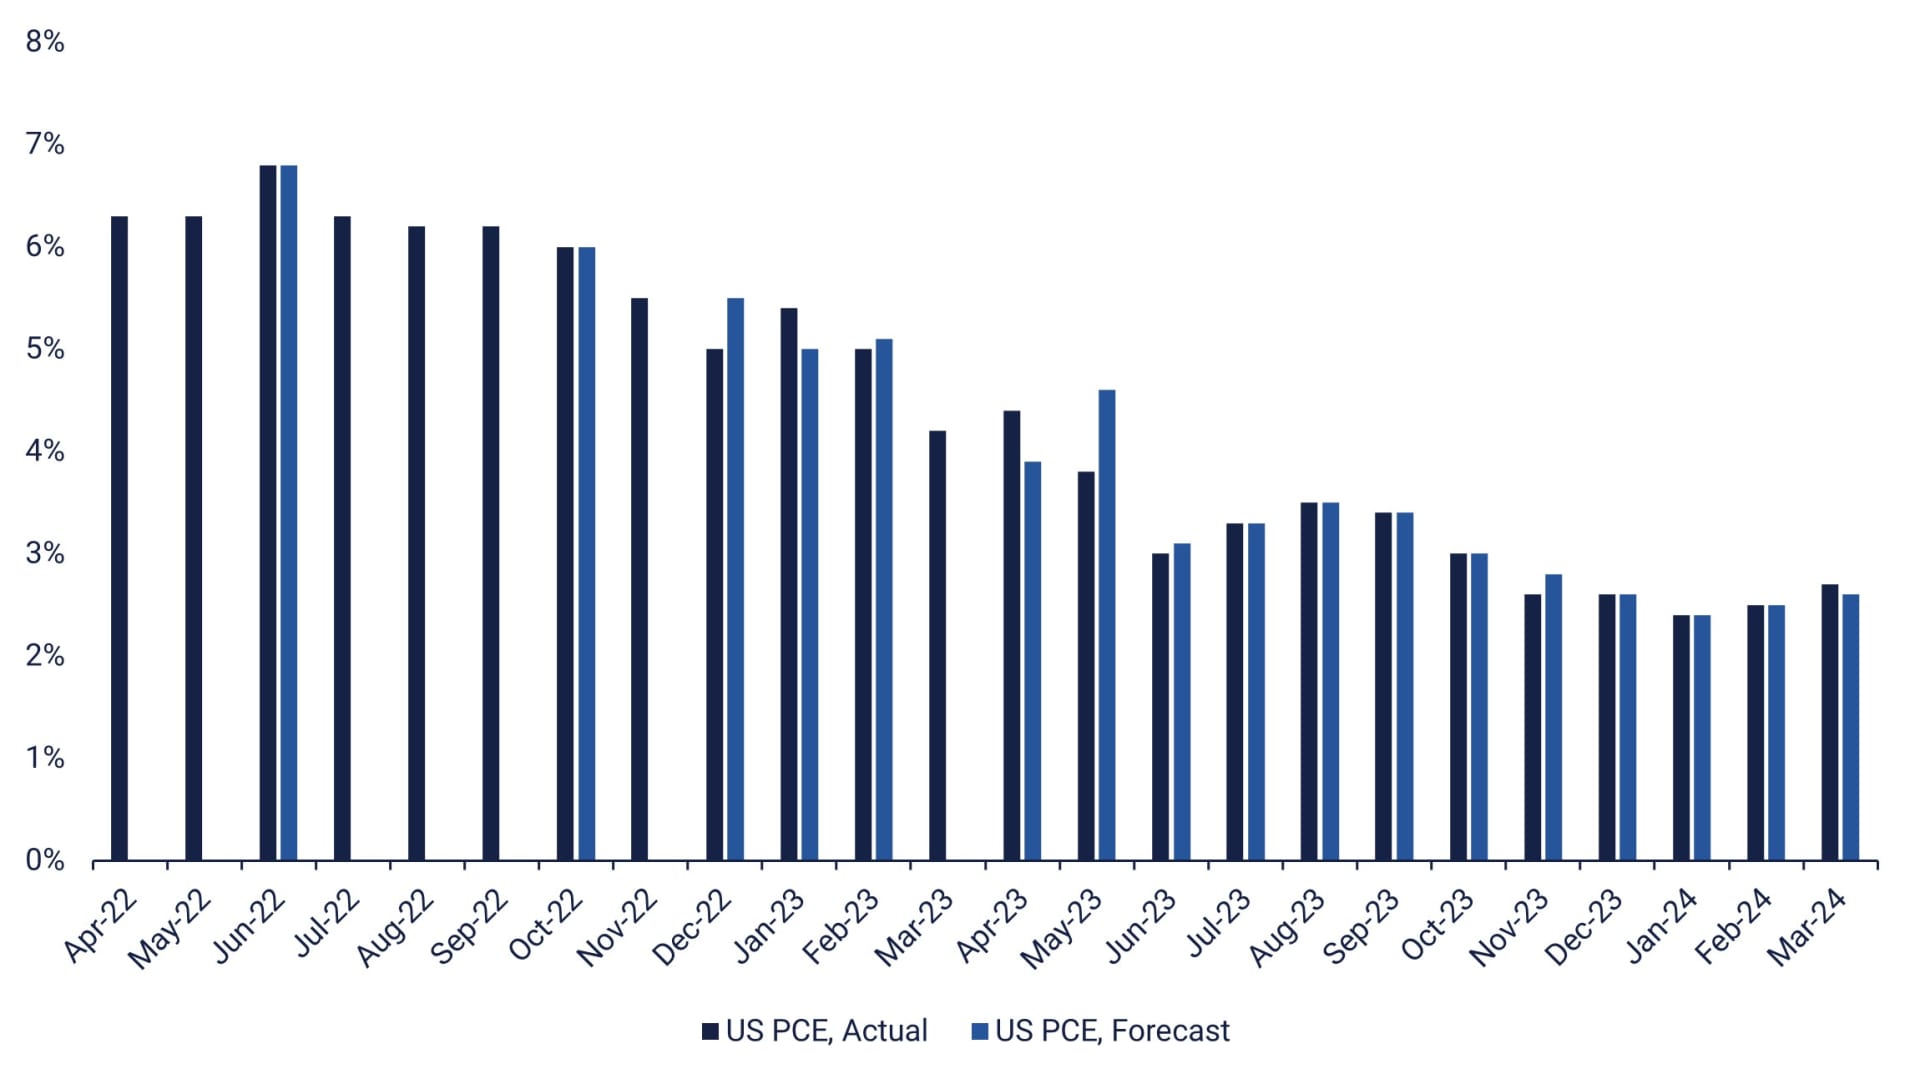
The main macro news this week will be German CPI for May on Wednesday the 29th. This will be followed by US Q1 GDP, Goods Trade Balance, and Pending Home Sales for April on Thursday the 30th. On Friday morning, the 31st, we will get Japan's Industrial Production for April and China's Purchasing Managers Index PMI for May. A little later, on Friday the 31st, we get the Eurozone CPI for May, which is expected to have risen from 2.4% in April to 2.5% at an annual rate. Very important on Friday will also be the US PCE inflation index for April, which will be compared with the 2.7% annualised PCE inflation rate for March.
As for the rest of the Q1 2024 reports, Salesforce will release its interim results on Wednesday 29 May. This will be followed by Costco Wholesale and Dell Technologies on Thursday 30 May.
US PCE index, May 2022 to April 2024 (actual and forecast)
Can the PCE lead the S&P500 on Friday?
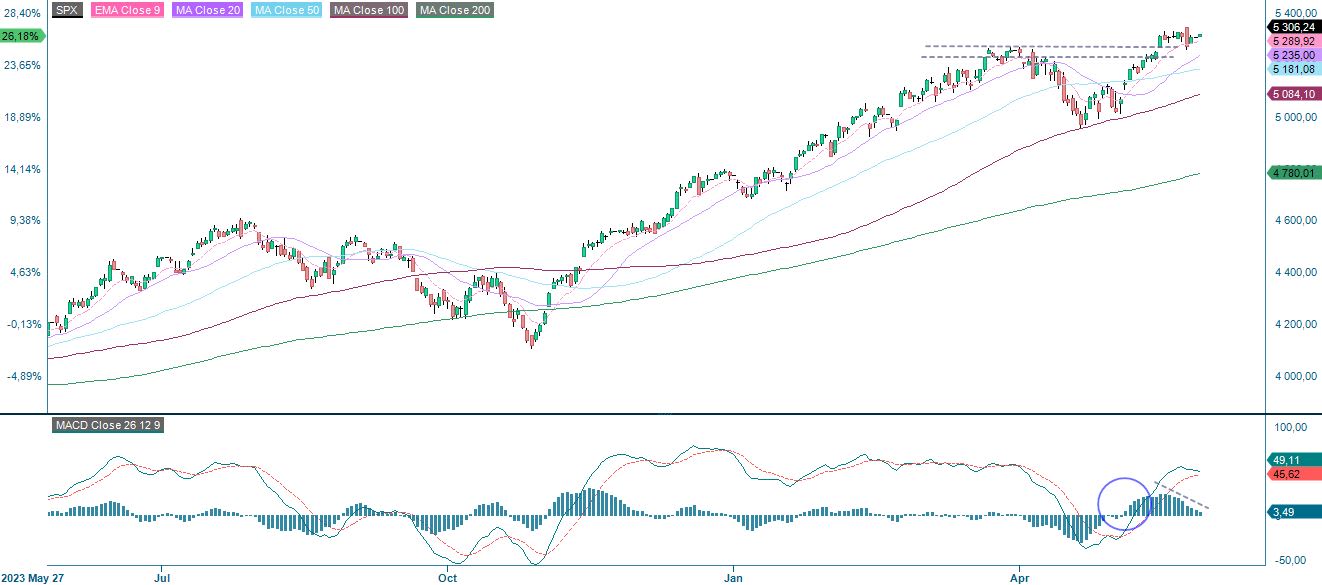
The S&P 500 is currently trading sideways with positive but declining momentum as shown on the MACD histogram. However, the index is well supported by a rising EMA9, support at 5,260 and a rising MA20. A potential trigger for the S&P's direction will be Friday's PCE figure from the US.
S&P 500 (in USD), one-year daily chart
S&P 500 (in USD), weekly five-year chart

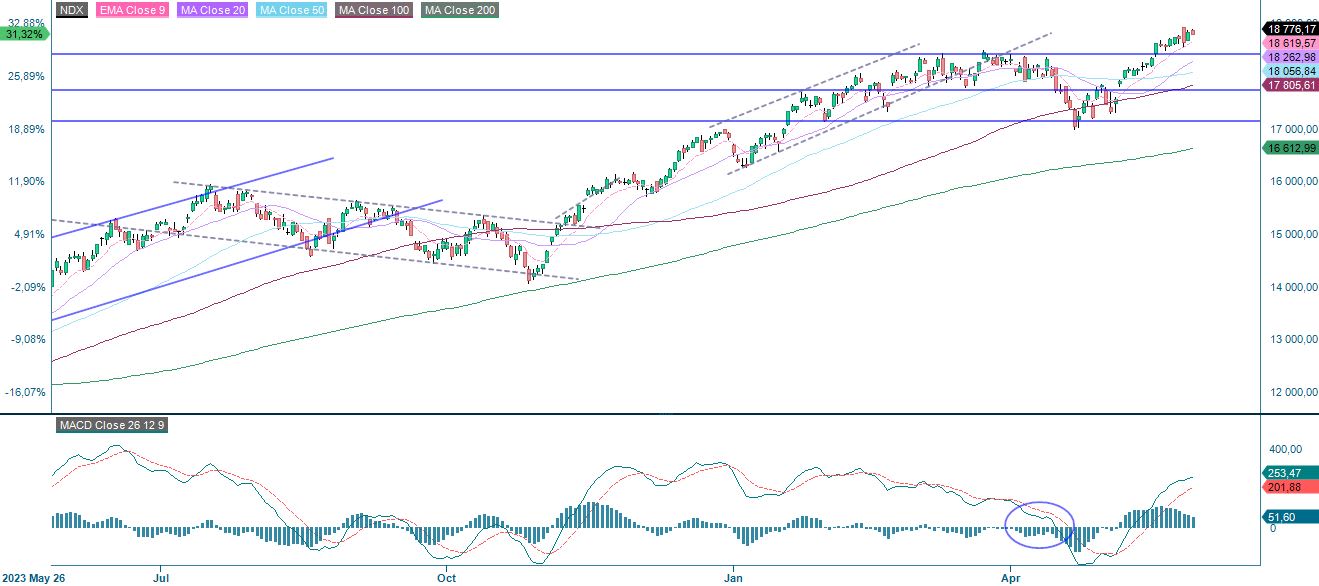
The Nasdaq 100 is trading slightly higher, supported by the EMA9. This despite the recent rise in yields.
Nasdaq 100 (in USD), one-year daily chart
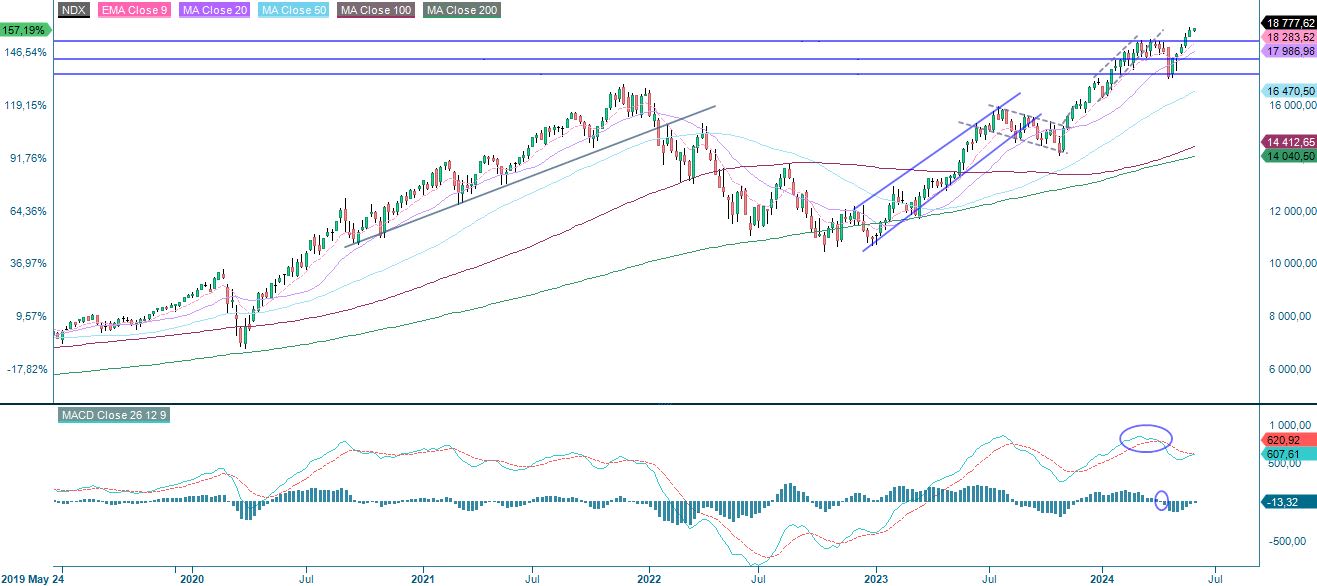
Nasdaq 100 (in USD), weekly five-year chart
As the chart below shows, the Swedish OMXS30 is trading sideways. Meanwhile, the MACD has given a soft sell signal. Therefore, the risk is to the downside. The MA20 is acting as a support on the downside. The index needs a positive trigger to reduce the risk of a negative setback.
OMXS30 (in SEK), one-year daily chart

However, another (but shorter) flag pattern has formed on the weekly chart. These tend to break in the direction of the trend - up.
OMXS30 (in SEK), weekly five-year chart

The same goes for the German DAX.
DAX (in EUR), one-year daily chart

DAX (in EUR), weekly five-year chart

The full name for abbreviations used in the previous text:
EMA 9: 9-day exponential moving average
Fibonacci: There are several Fibonacci lines used in technical analysis. Fibonacci numbers are a sequence in which each successive number is the sum of the two previous numbers.
MA20: 20-day moving average
MA50: 50-day moving average
MA100: 100-day moving average
MA200: 200-day moving average
MACD: Moving average convergence divergence
Risks
External author:
This information is in the sole responsibility of the guest author and does not necessarily represent the opinion of Bank Vontobel Europe AG or any other company of the Vontobel Group. This information is sponsored by Bank Vontobel Europe AG, which may be a counterparty to transactions involving the financial instruments discussed in this information. The further development of the index or a company as well as its share price depends on a large number of company-, group- and sector-specific as well as economic factors. When forming his investment decision, each investor must take into account the risk of price losses. Please note that investing in these products will not generate ongoing income.
The products are not capital protected, in the worst case a total loss of the invested capital is possible. In the event of insolvency of the issuer and the guarantor, the investor bears the risk of a total loss of his investment. In any case, investors should note that past performance and / or analysts' opinions are no adequate indicator of future performance. The performance of the underlyings depends on a variety of economic, entrepreneurial and political factors that should be taken into account in the formation of a market expectation.
Credit risk of the issuer:
Investors in the products are exposed to the risk that the Issuer or the Guarantor may not be able to meet its obligations under the products. A total loss of the invested capital is possible. The products are not subject to any deposit protection.
Market risk:
The value of the products can fall significantly below the purchase price due to changes in market factors, especially if the value of the underlying asset falls. The products are not capital-protected
Risk with leverage products:
Due to the leverage effect, there is an increased risk of loss (risk of total loss) with leverage products, e.g. Bull & Bear Certificates, Warrants and Mini Futures.
Product costs:
Product and possible financing costs reduce the value of the products.
Currency risk:
If the product currency differs from the currency of the underlying asset, the value of a product will also depend on the exchange rate between the respective currencies. As a result, the value of a product can fluctuate significantly.