Amazon and Apple in focus this week


We believe Baidu could see a short-term bounce in its share price if its Q1 2024 report, due on 16 May, beats expectations. The company has consistently been at the forefront of China's AI development, but political risks are weighing on the share price. This week's stock sentiment will be driven by Amazon and Apple, which report their interim results on Tuesday 30 April and Thursday 2 May respectively.
Case of the week: Baidu
History repeating itself for the Chinese AI giant?
When we last spotlighted Baidu Inc. in November 2023, we focused on the potential for a short-term bounce in the share price following Q3 2023 earnings, which were due a few days after our commentary. As predicted, the share price rose from around USD 108 per share to USD 124 per share within a few trading days. Since then, however, the share price has fallen back and is now trading around USD 100 per share. So, the situation today is the same as it was in November, with the Q1 2024 report due to be released on 16 May.
Baidu has consistently been at the forefront of Chinese AI development, and recent progress suggests that it is actively consolidating its position. What sets Baidu apart, particularly when compared to its prominent counterparts such as Alibaba and Tencent, is its extensive involvement across the AI spectrum. From proprietary models such as ERNIE and PLATO to fostering a developer ecosystem through the PaddlePaddle open-source framework, Baidu maintains a distinct advantage in its home market, even as competition intensifies.
In the Q4'23 report, Baidu highlighted Samsung and Honor smartphones with integrated Baidu AI chat capabilities. It also unveiled a series of AI toolkits - AgentBuilder, AppBuilder and ModelBuilder - aimed at driving AI innovation. Baidu has reported significant adoption of Ernie, with 26,000 businesses using its capabilities through the API and 4,000 merchants using the AI chatbot. There are also rumours that Apple is looking to partner with Baidu to bring generative AI to Apple devices sold in China. Specifically, Apple is looking to use ERNIE in iPhone 16, Mac OS and iOS18 in China. A potential partnership with Apple would be crucial for Baidu as competition intensifies.
In today's market, AI-related investments tend to command significant premiums, but Baidu is a notable exception. While the company may not be as competitive as its Western counterparts in AI, its first-mover advantage within China is strong. Going forward, progress in both AI development and monetisation of AI development will be critical to the stock's future performance. Despite low market expectations, success in AI initiatives could provide a valuable growth opportunity given the current subdued sentiment. However, political risk is always a factor when considering Chinese stocks, and Baidu is no exception.
As Q1 2024 results approach, the possibility of an expanded share buyback programme should also be kept in mind, especially given Baidu's growing net cash reserves, which now account for almost half of its market capitalisation. Expectations for Baidu remain modest, so we reiterate our November 2023 mantra: Despite high political risks, Baidu could very well see a near-term bounce in the share price if the Q1 2024 report beats expectations.
Baidu (USD), one-year daily chart

Baidu (USD), five-year weekly chart

Macro comments
US equities rose sharply on Friday 19th April after Personal Consumption Expenditures (PCE) inflation data came in line with expectations. Earnings reports from some of the Magnificent Seven, such as Microsoft and Alphabet, also boosted the S&P500 index by 1.0% on Friday and 2.7% for the week from 22nd to 26th April.
Year-to-date, one-year and five-year performance of major stock indices

As of Friday 19 April 2024, around 230 S&P 500 companies (46% of all companies) have reported their Q1 2024 results. 77% have reported positive earnings surprises and 60% have reported positive revenue surprises.
The average net profit margin for S&P500 companies has improved from 11.2% in Q4 2023 to 11.5% in Q1 2024 and is expected to improve further to 12.2% in Q2 2024 and 12.6% in Q3 2024, before falling back to 12.5% in Q4 2024.
The three best performing S&P500 sectors in terms of positive earnings surprises in Q1 2024 are Health Care, Communication Services, and Information Technology. Meanwhile, the three worst performing S&P500 sectors are Financials, Real Estate and Energy.
From 11 April to 26 April, we tracked the earnings performance of 69 large-cap S&P500 companies. These companies beat analysts' earnings estimates by an average of 10.3% and the median by 7.1%. However, this has only resulted in an average share price increase of 0.3% and a median price increase of 0.5%.
At a crossroads for the short-term trend ahead of Amazon and Apple
The S&P 500 is at a crossroads in its short-term trend. A break above 5,130 and the previous top at 5,250 could be next. Note that the MACD is about to give a soft buy signal. On the downside, the MA100 currently at 4,980 acts as support. Reports from Amazon on Tuesday 30th April and Apple on Thursday 2nd May are likely to have a major impact on the direction of the index.
S&P 500 (in USD), one-year daily chart

S&P 500 (in USD), weekly five-year chart

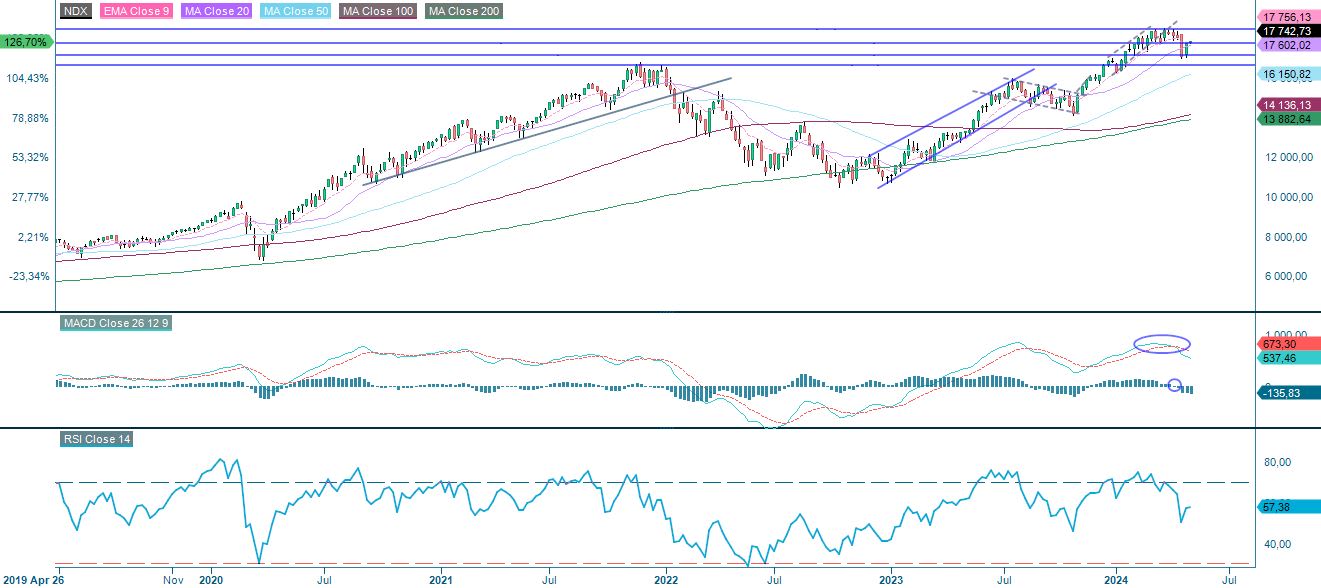
The Nasdaq 100 needs to break above the MA50, currently at 17,936, before the previous high of 18,420 can be tested.
Nasdaq 100 (in USD), one-year daily chart

Nasdaq 100 (in USD), weekly five-year chart
The Swedish OMXS30 has broken above the trading range. Is this a breakout? Well, according to the MACD, the index seems to have some energy left. However, the OMXS30 is also likely to be heavily influenced by the upcoming reports from Amazon and Apple.
OMXS30 (in SEK), one-year daily chart

OMXS30 (in SEK), weekly five-year chart

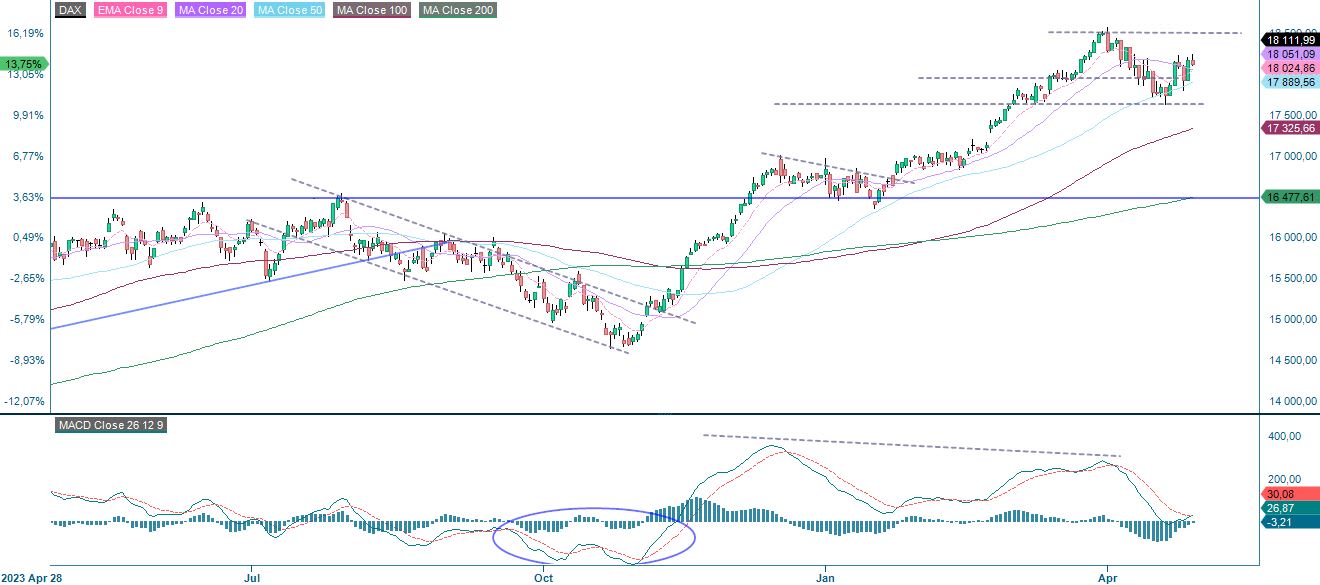
The German DAX's MA20 is trading above all of its moving averages. The next level on the upside is between 18,400 and 18,500. The MA50, currently at 17,889, acts as support on the downside.
DAX (in EUR), one-year daily chart
DAX (in EUR), weekly five-year chart

The full name for abbreviations used in the previous text:
EMA 9: 9-day exponential moving average
Fibonacci: There are several Fibonacci lines used in technical analysis. Fibonacci numbers are a sequence in which each successive number is the sum of the two previous numbers.
MA20: 20-day moving average
MA50: 50-day moving average
MA100: 100-day moving average
MA200: 200-day moving average
MACD: Moving average convergence divergence
Risks
External author:
This information is in the sole responsibility of the guest author and does not necessarily represent the opinion of Bank Vontobel Europe AG or any other company of the Vontobel Group. This information is sponsored by Bank Vontobel Europe AG, which may be a counterparty to transactions involving the financial instruments discussed in this information. The further development of the index or a company as well as its share price depends on a large number of company-, group- and sector-specific as well as economic factors. When forming his investment decision, each investor must take into account the risk of price losses. Please note that investing in these products will not generate ongoing income.
The products are not capital protected, in the worst case a total loss of the invested capital is possible. In the event of insolvency of the issuer and the guarantor, the investor bears the risk of a total loss of his investment. In any case, investors should note that past performance and / or analysts' opinions are no adequate indicator of future performance. The performance of the underlyings depends on a variety of economic, entrepreneurial and political factors that should be taken into account in the formation of a market expectation.
Credit risk of the issuer:
Investors in the products are exposed to the risk that the Issuer or the Guarantor may not be able to meet its obligations under the products. A total loss of the invested capital is possible. The products are not subject to any deposit protection.
Market risk:
The value of the products can fall significantly below the purchase price due to changes in market factors, especially if the value of the underlying asset falls. The products are not capital-protected
Risk with leverage products:
Due to the leverage effect, there is an increased risk of loss (risk of total loss) with leverage products, e.g. Bull & Bear Certificates, Warrants and Mini Futures.
Product costs:
Product and possible financing costs reduce the value of the products.
Currency risk:
If the product currency differs from the currency of the underlying asset, the value of a product will also depend on the exchange rate between the respective currencies. As a result, the value of a product can fluctuate significantly.