Equity rally driven by lower interest rates


For much of 2023, the gold price faced a headwind from rising interest rates. Now, the tide has turned towards falling interest rates, which will benefit cyclicals and real estate stocks in particular. However, we believe that gold will soon start to rally as central bank easing has historically often been bullish for gold. From a technical point of view, the index charts are less convincing.
Case of the week: Time to shine for all things golden
Gold has performed surprisingly well in 2023 despite facing a headwind of rising interest rates for a large part of the year. Recently, the tide has turned in favour of the precious metal as yields have turned sharply lower. The dovish outlook at the latest FOMC meeting at the Federal Reserve appears to confirm that a peak in interest rates is behind us for now. The Fed is now signalling interest rate cuts during 2024. When central banks start easing, it is usually bullish for gold.
Gold price (USD per oz) versus Fed funds rate, one-year daily chart since December 1999

The gold price has been volatile lately, breaking to new all-time highs (in USD) before pulling back. However, the price trend is positive and supported by fundamentals. Q4 and Q1 are seasonally strong periods for the gold price from a historical perspective.
Gold (USD per oz), one-year daily chart

The shares of gold miners have not kept keep pace with the metal itself. During the equity market rally in Q4 2023, investors seem to have preferred shares in more cyclical and interest rate-sensitive companies. We believe, however, that investor focus could soon turn to the laggards, including gold miners. A rule of thumb is that gold mining stocks move at about twice the rate of change in the gold price due to operating leverage. That is since miners have a cost for extracting the metal. A caveat is that cost inflation has been a headwind for many mining companies in the last three years. However, recent lower oil prices might provide some relief. The largest gold miners are listed in the US and Canada, including the sector bellwether Newmont.
Gold (USD per oz) vs Newmont, year-to-date daily chart

Gold (USD per oz), five-year weekly chart

Macro-comments
The Fed's interest rate announcement on Wednesday 13th December reduced the yield on two-year US government bonds by around 30 basis points, from about 4.6% to about 4.3%. This rate has since risen slightly to 4.4%. Lower interest rates are creating a new environment that should benefit cyclical companies, as well as real estate and, to some extent, information technology. Since November 2023, we have seen a tendency for FANG and growth companies such as Nvidia to lose ground against the S&P 500, despite posting better-than-expected interim results.
The OMX contains significantly more cyclical and interest rate-sensitive companies than the S&P500. This explains why the OMX30 gained 8.5% over the last month, while the S&P500 gained only 5.4%.
US PCE inflation already peaked in June 2022 at 7.1 per cent and has been declining since then. The PCE inflation for October 2023 came in at 3.0 per cent. The PCE inflation for November 2023, to be released on Friday 22 December, is expected to show a further decline to 2.9 per cent.
The VIX, a measure of volatility that also shows the level of investor uncertainty, has fallen to lows since before the levels before the Covid pandemic. With rate cuts are now on the horizon, it is natural that the market's fears are beginning to subside.
There are some major US companies reporting also this week; Micron Technology, General Mills and Toro on Wednesday the 20th December and Nike, Cintas and Paychex on Thursday the 21st December.
US HYG ETF, five-year weekly chart

VIX, five-year weekly chart

Reduce risk with a spread at overbought levels?
Despite non-dovish comments from several Fed members, the rally does not seem to want to end. For the S&P 500, the next level on the upside can be found at around 4,800. Note that RSI is at overbought levels. Are the so-called smart investors still buying, or is greed driving the rally at these levels?
S&P 500 (in USD), two-year daily chart

S&P 500 (in USD), weekly five-year chart

Meanwhile, the Nasdaq 100 is trading at a new all-time high.
Nasdaq 100 (in USD), two-year daily chart
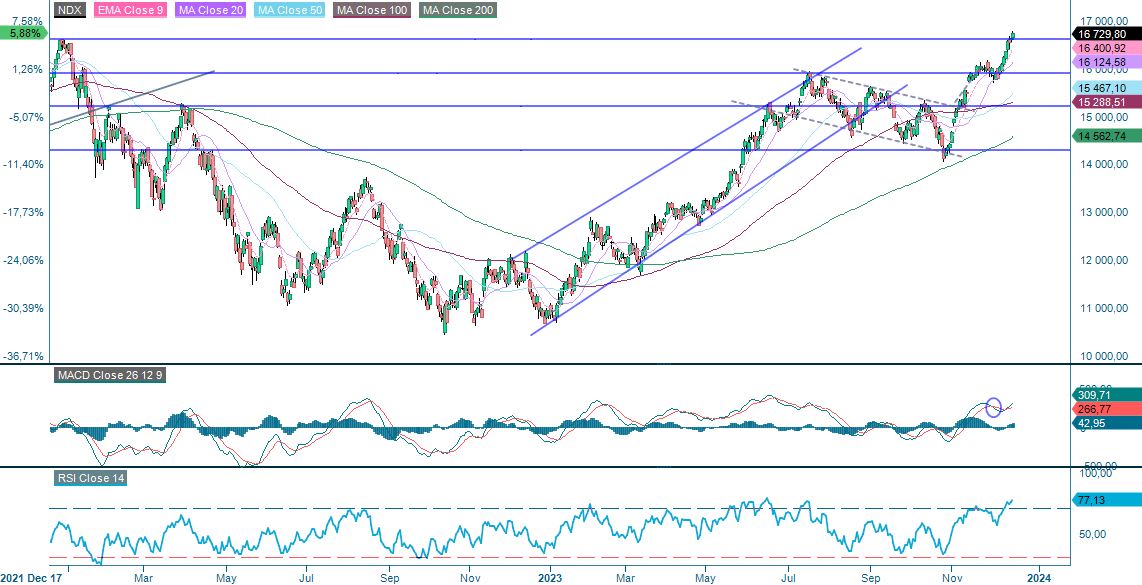
Nasdaq 100 (in USD), weekly five-year chart

OMXS30 still have some left to go before reaching the gap and highs from 2022. Maybe one should buy a spread, short S&P 500 and long OMXS30?
OMXS30 (in SEK), two-year daily chart
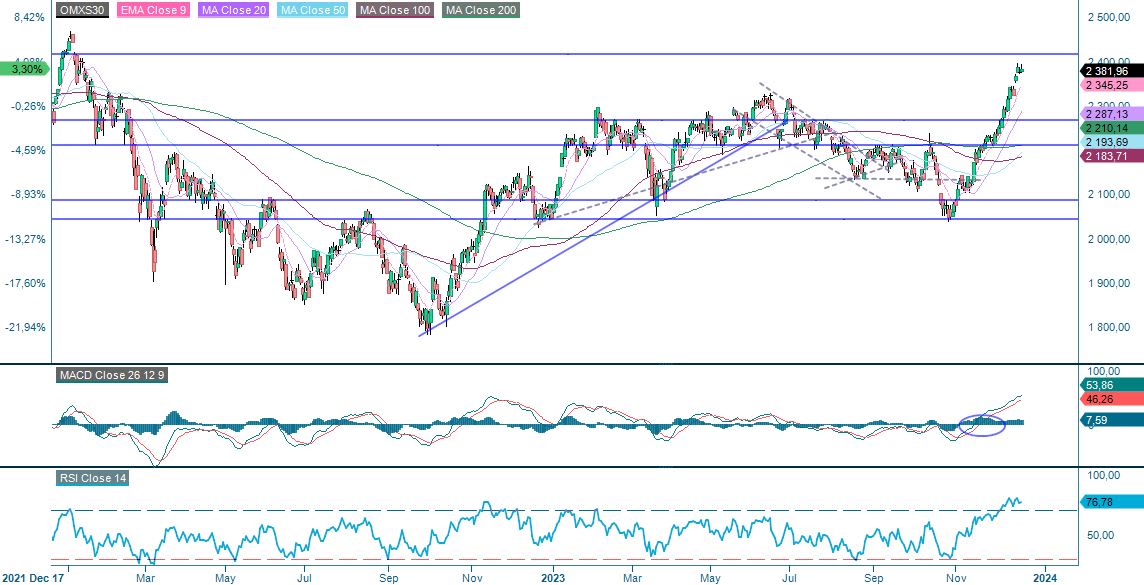
OMXS30 (in SEK), weekly five-year chart

On the other hand, DAX is losing momentum, as illustrated by the soft sell signal in MACD. That is at levels surpassing those reached in 2022. Maybe long OMXS30 and short DAX may be an even more attractive spread? Also, it is difficult to ignore the scary-looking doji in the weekly chart generated last week.
DAX (in EUR), one-year daily chart

DAX (in EUR), weekly five-year chart

The full name for abbreviations used in the previous text:
EMA 9: 9-day exponential moving average
Fibonacci: There are several Fibonacci lines used in technical analysis. Fibonacci numbers are a sequence in which each successive number is the sum of the two previous numbers.
MA20: 20-day moving average
MA50: 50-day moving average
MA100: 100-day moving average
MA200: 200-day moving average
MACD: Moving average convergence divergence
Risks
External author:
This information is in the sole responsibility of the guest author and does not necessarily represent the opinion of Bank Vontobel Europe AG or any other company of the Vontobel Group. This information is sponsored by Bank Vontobel Europe AG, which may be a counterparty to transactions involving the financial instruments discussed in this information. The further development of the index or a company as well as its share price depends on a large number of company-, group- and sector-specific as well as economic factors. When forming his investment decision, each investor must take into account the risk of price losses. Please note that investing in these products will not generate ongoing income.
The products are not capital protected, in the worst case a total loss of the invested capital is possible. In the event of insolvency of the issuer and the guarantor, the investor bears the risk of a total loss of his investment. In any case, investors should note that past performance and / or analysts' opinions are no adequate indicator of future performance. The performance of the underlyings depends on a variety of economic, entrepreneurial and political factors that should be taken into account in the formation of a market expectation.
Disclaimer:
This information is neither an investment advice nor an investment or investment strategy recommendation, but advertisement. The complete information on the products (securities) mentioned herein, in particular the structure and risks associated with an investment, are described in the base prospectus, together with any supplements, as well as the final terms relating to the securities. The base prospectus and final terms constitute the solely binding sales documents for the products mentioned herein. It is recommended that potential investors read these documents before making any investment decision. The documents and the key information document are published on the website of the issuer, Vontobel Financial Products GmbH, Bockenheimer Landstrasse 24, 60323 Frankfurt am Main, Germany, on https://prospectus.vontobel.com and are available from the issuer free of charge. The approval of the prospectus should not be understood as an endorsement of the securities. The securities are products that are not simple and may be difficult to understand. This information includes or relates to figures of past performance. Past performance is not a reliable indicator of future performance. This information may only be distributed or published in countries where such distribution or publication is permitted by applicable law. As stated in the relevant base prospectus, the distribution of the securities mentioned in this information is subject to restrictions in certain jurisdictions. This advertisement may not be reproduced or redistributed without prior permission by Vontobel.
© Bank Vontobel Europe AG and / or affiliated companies. All rights reserved.
Credit risk of the issuer:
Investors in the products are exposed to the risk that the Issuer or the Guarantor may not be able to meet its obligations under the products. A total loss of the invested capital is possible. The products are not subject to any deposit protection.
Market risk:
The value of the products can fall significantly below the purchase price due to changes in market factors, especially if the value of the underlying asset falls. The products are not capital-protected
Risk with leverage products:
Due to the leverage effect, there is an increased risk of loss (risk of total loss) with leverage products, e.g. Bull & Bear Certificates, Warrants and Mini Futures.
Product costs:
Product and possible financing costs reduce the value of the products.
Currency risk:
If the product currency differs from the currency of the underlying asset, the value of a product will also depend on the exchange rate between the respective currencies. As a result, the value of a product can fluctuate significantly.