The bears are in charge in Sweden and sneaking up on the US


This week we look at the Brazilian coffee market, where the prices of two different types of coffee beans, Arabica and Robusta, have recently diverged. The price charts for OMX Stockholm have been looking weak for some time. Similar patterns, reminiscent of a so-called bear market, are now beginning to be seen in the US stock indices.
Case of the week: A different blend of coffee
As Brazil, the largest coffee producer in the world, has enjoyed near-perfect weather for harvesting coffee, prices have been pressed downward. Coming off the high plateaus reached in 2022, the price has more or less reverted to the mean, albeit a bit higher than the five-year average. Although recent developments could point to a long-term decline in price, there is potential for a rebound as the season draws to a close.
Arabica coffee Sep ’23 future price chart (in USD), contract average comparison daily chart (against average price for the five prior September futures)

ICE contracts for coffee have historically been reserved for premium, washed coffee beans of arabica coffee. But recently, unwashed beans from Brazil have entered the ICE warehouse. The unwashed beans have caused unrest in other arabica-producing countries, where small-scale farms fear that the premium status of the contract is being compromised. Coffee from Brazil is usually sold in physical markets where sellers can fetch a higher price. Still, recently ICE has started increasing its stock of Brazilian coffee, with about 30 % of the approved stock in ICE warehouses coming from Brazil. Likely to include unwashed beans, this represents a significant shift for the commodity. Smaller players, more likely to grow coffee on hillsides where it can not be harvested as efficiently as on plane surfaces, are now under more pressure than ever to increase yields and efficiency.
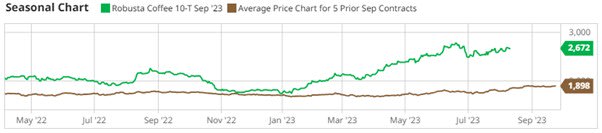
On the other side of the coffee spectrum, the more bitter robusta coffee has been struggling to meet production quotas and timelines. While Brazil only has a quarter of the harvest left to go, countries like Indonesia have been dealing with El Niño. After heavy downpours during the summer, the forecast is now shifted toward dryness for the remainder of the year, entirely at odds with the crop cycle of the coffee beans. Together, robusta is again nearing the All-time high reached in June of this year.
In the short term, a meteorological surprise and a pendulum effect could entail a rush for the relatively cheaper arabica. Brazil outpaced the harvesting speeds of 2022 more considerably at the beginning of the season than currently in the last stretch. Considering that demand is looking as solid as ever, there is a significant possibility for a rally in arabica prices as traders start to divest their long positions in robusta.
Robusta coffee Sep ’23 future price chart (in USD), contract average comparison daily chart (against average price for the five prior September futures)
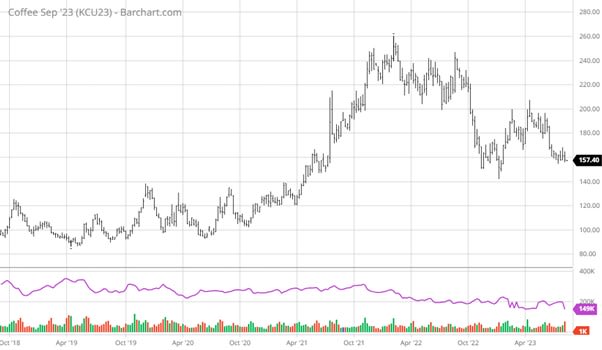
Arabica coffee price chart (in USD/Lbs), one-year daily chart

Arabica coffee price chart (in USD/Lbs), five-year weekly chart
Minor rate hike after US inflation data
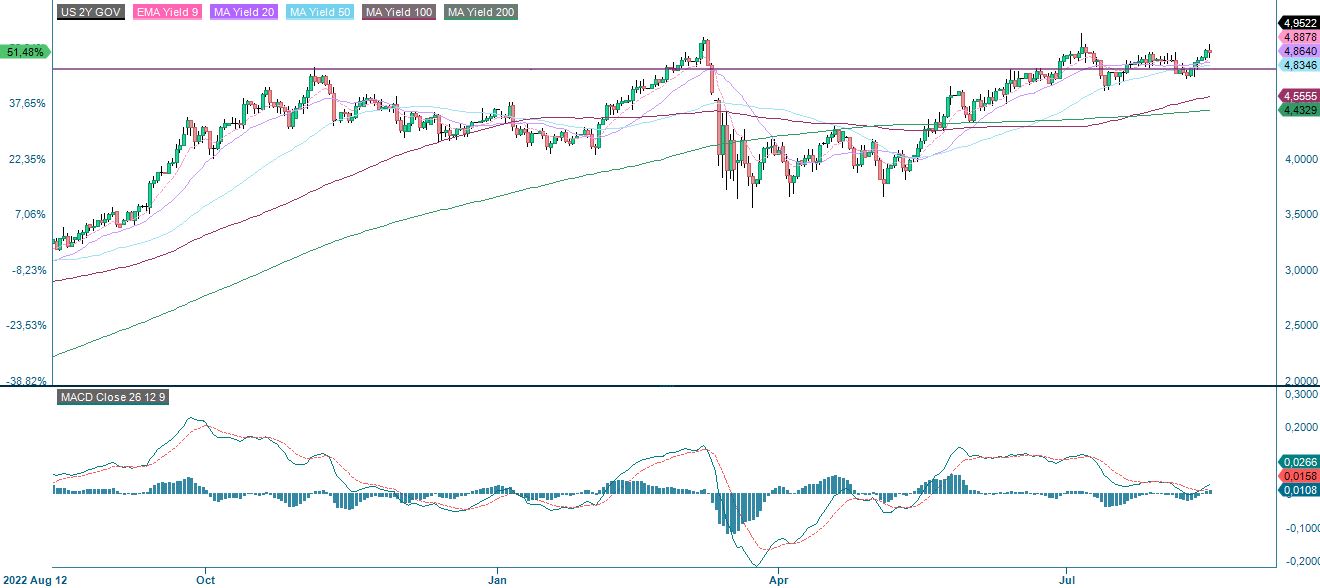
The US Consumer Price Index for July was released on Thursday, 10th August. Inflation rose by 0.2% in July and by 3.2% annually. The US Producer Price Index, released on Friday, 11th August, was slightly higher than analysts' expectations (0.8% vs. 0.7% forecast for July). The two-year US Treasury note yield rose by eleven bps (from 4.78% to 4.89%) between Thursday 10th and Monday 14th August.
US 2-year Treasury yield (in %), one-year daily chart
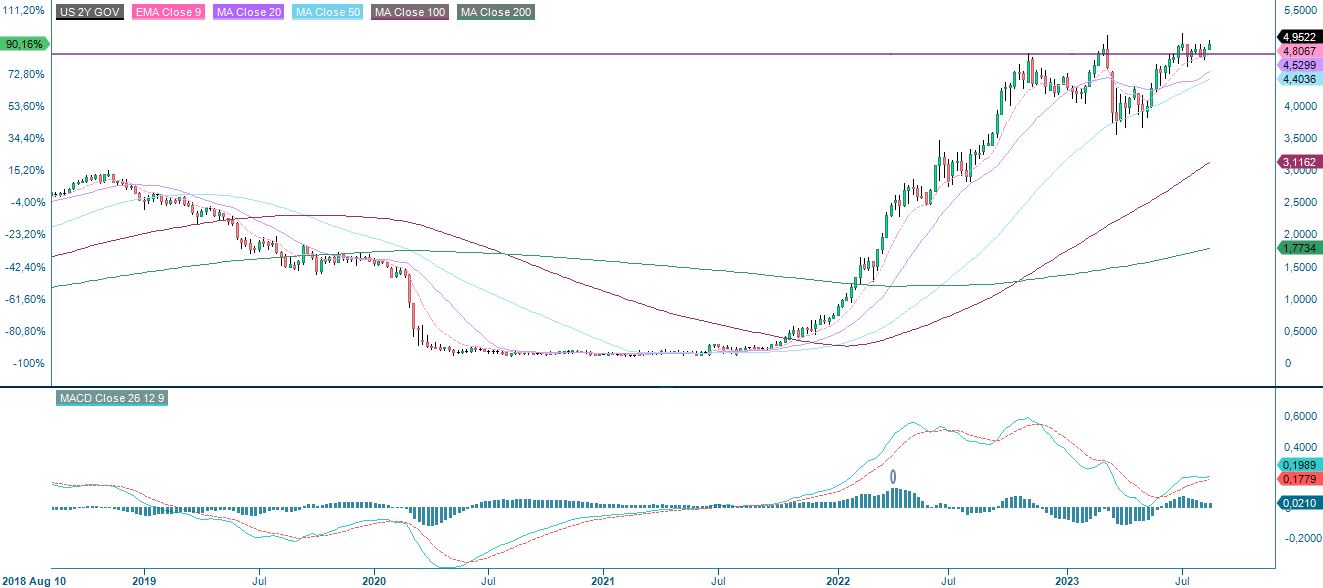
US 2-year Treasury yield (in %), five-year weekly chart
Eurozone Consumer Price Index for July are due on Friday, 18th August. It is expected to have fallen by 0.1% in July, putting the annual inflation rate at 5.3%. Looking ahead into August, oil and natural gas prices have risen recently. There is also a risk that food prices will rise this autumn, where for example, rice prices in Asia have increased lately.
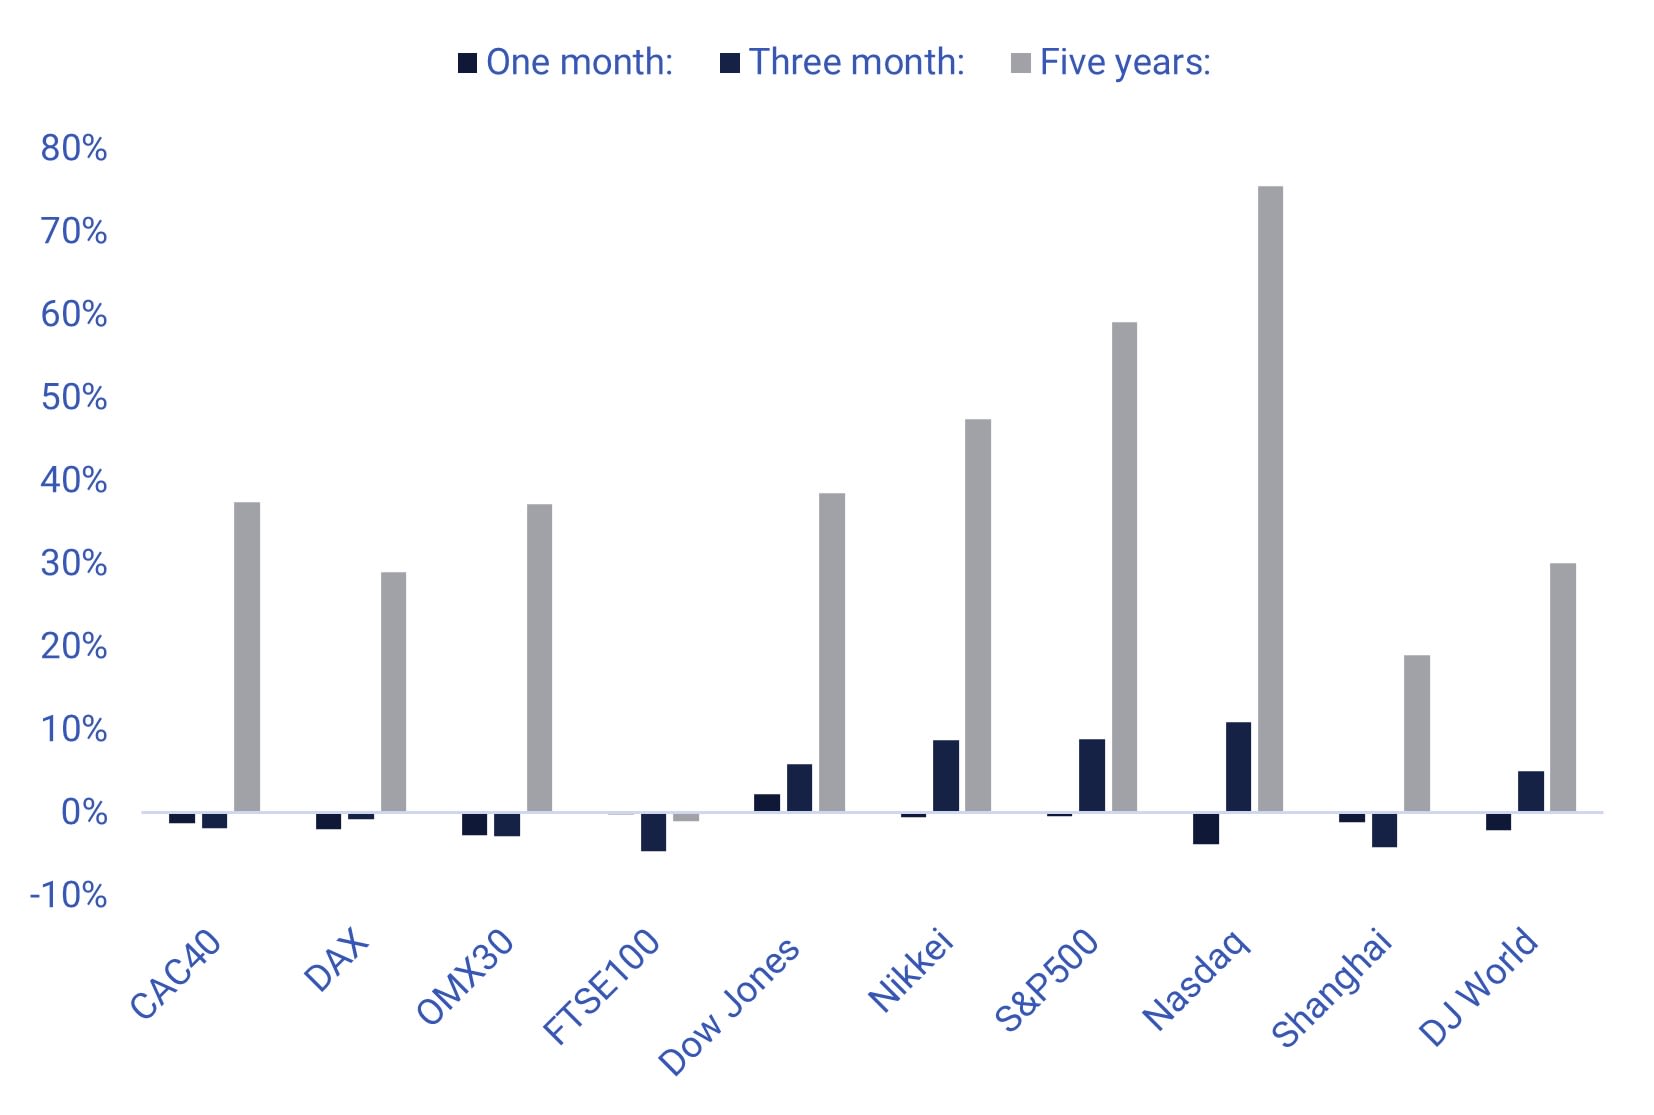
As can be seen from the chart below, the US equity indices and the Nikkei have outperformed the European equity indices over the last three months. Meanwhile, worrying news from China's commercial property sector has weighed down the Shanghai stock index. We also saw weak Chinese trade data last week.
Significant stock indices performance in one month, three months and five years
The UK Consumer Price Index and Producer Price Index for July and June industrial production and Q2 GDP and employment from the eurozone will be presented on Wednesday, 16 August. We also get July housing and industrial production from the US, weekly oil inventories (DOE), and the Fed's July 26th meeting minutes on Wednesday, 16 August.
On Thursday, 17 August, we get Japan's July trade balance and June machinery orders. From the US, there will be the Philadelphia Fed index for August, weekly unemployment data and leading indicators for July.
Friday, 18 August’s news agenda consists of Japan’s July Consumer Price Index, the Q2 employment and Q3 industrial capacity utilisation from Sweden and UK retail sales for July. We also get Eurozone statistics of the June trade balance and construction output, July Consumer Price Index and Q2 job vacancies.
The bears are in charge in Sweden and sneaking up on the US
S&P 500 is now trading at support made up by MA50, currently at 4,452. Meanwhile, MACD is approaching a sell signal. In case of a break to the downside, the next level is found around 4,330, followed by MA100. Selling short a stop-loss around MA20, currently at 4,523, may look attractive from a risk/reward perspective.
S&P 500 (in USD), one-year daily chart

S&P 500 (in USD), weekly five-year chart

Nasdaq 100 is also trading close to support. If more bears come to the market, the next level is found between 14,230 to 14,300. Again a short bet may look attractive from a risk/reward perspective, given a stop loss around MA20, currently at 15,408.
Nasdaq 100 (in USD), one-year daily chart
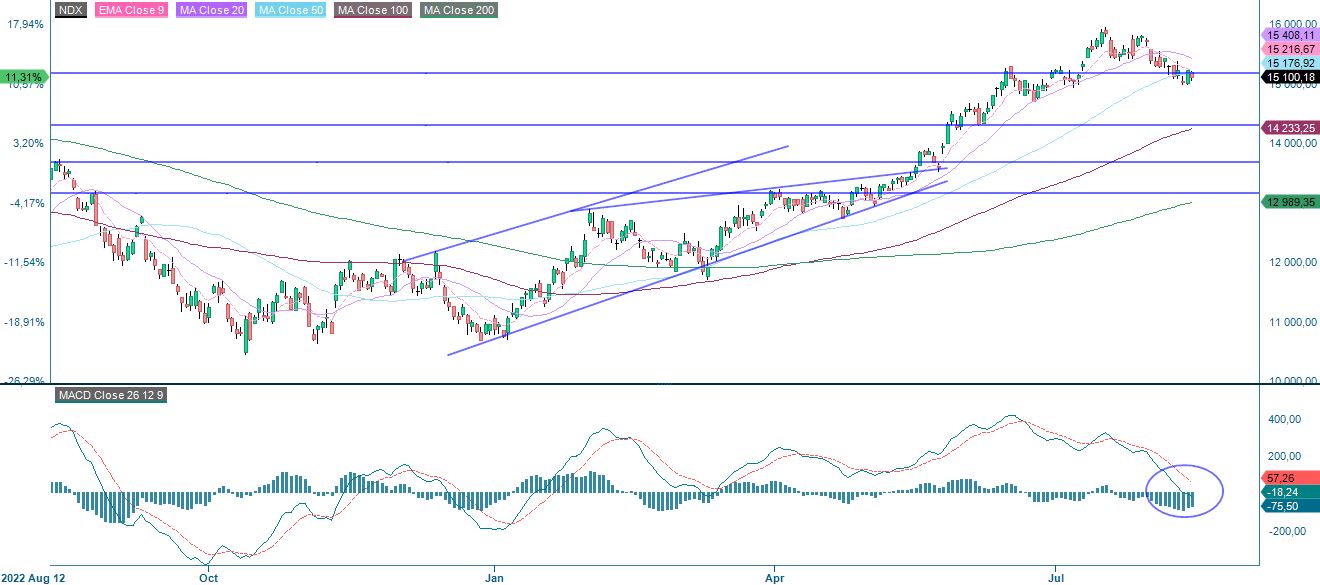
MACD has generated a soft sell signal in the weekly chart below.
Nasdaq 100 (in USD), weekly five-year chart

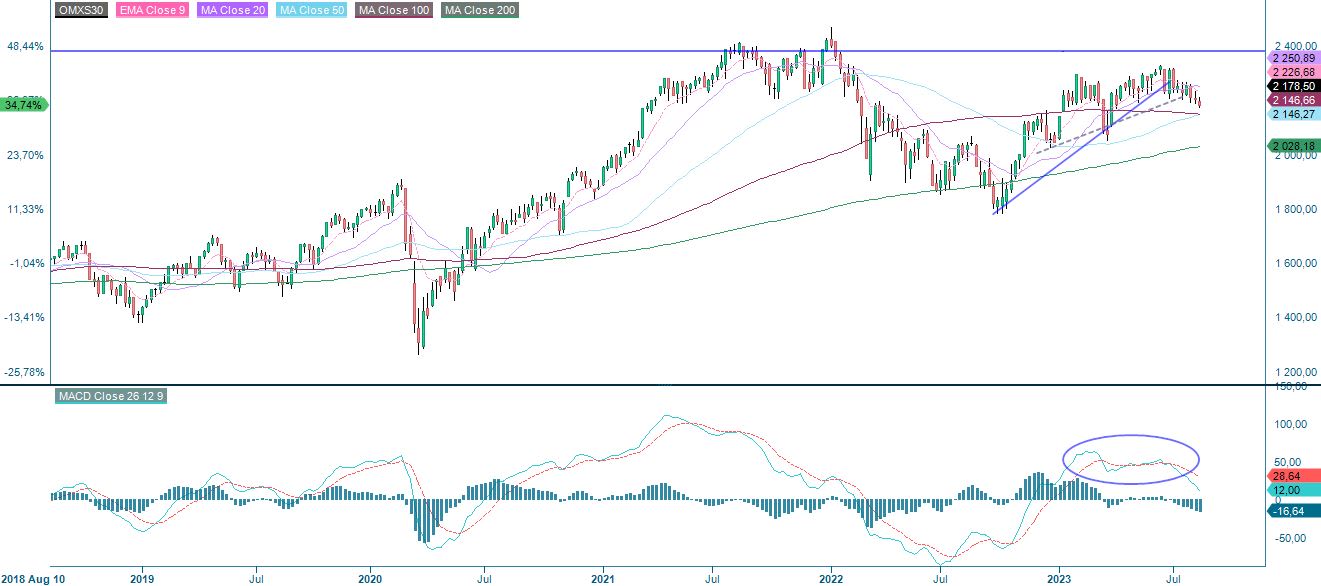
The bears have established themselves in Sweden as OMXS30 closed yesterday’s trading below MA200. The next downside level is around 2,120, where Fibonacci 38.2 meets up.
OMXS30 (in SEK), one-year daily chart

OMXS30 (in SEK), weekly five-year chart
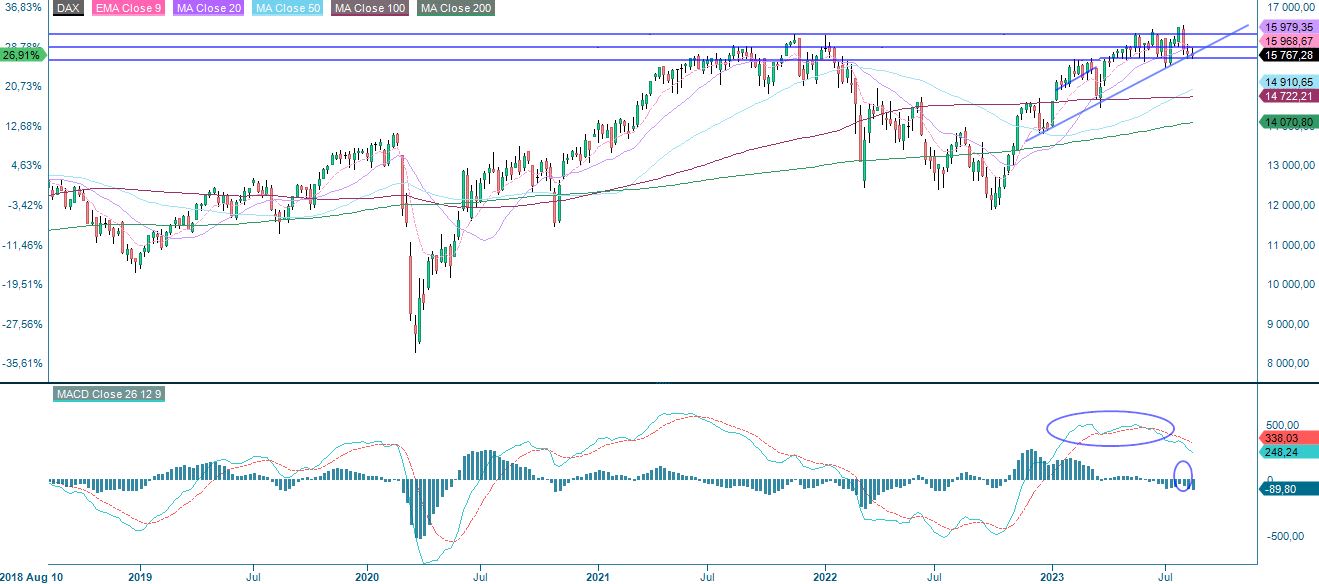
The German DAX is trading around support of around 15,700. The next level on the downside is pretty close, around 15,445. Next after that is MA200, currently at 15,335. Thus, DAX looks the least attractive for a short trade from a risk/reward perspective.
DAX (in EUR), one-year daily chart

DAX (in EUR), weekly five-year chart
Time to take profits in oil
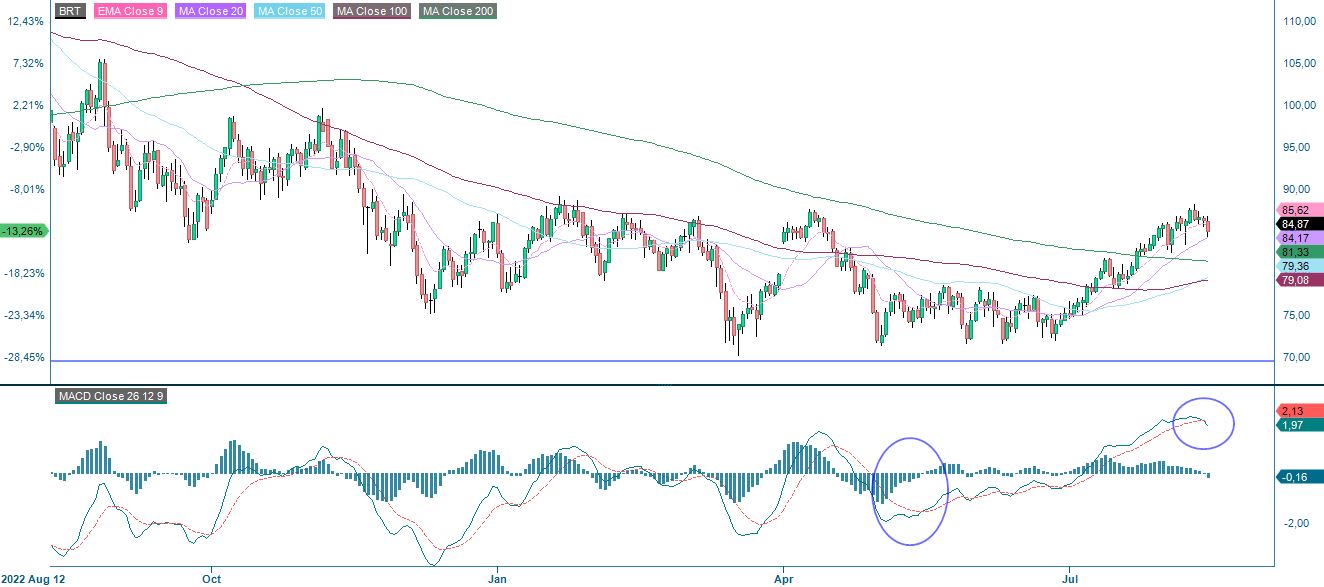
As mentioned last week, Brent oil has performed strongly but is currently at levels where it has bounced back down from several times this year. Maybe history will repeat itself, and it is time to take profits. This case is still alive as MACD recently generated a soft sell signal.
Brent oil (in USD per barrel), one-year daily chart
Brent oil (in USD per barrel), weekly five-year chart

The full name for abbreviations used in the previous text:
EMA 9: 9-day exponential moving average
Fibonacci: There are several Fibonacci lines used in technical analysis. Fibonacci numbers are a sequence in which each successive number is the sum of the two previous numbers.
MA20: 20-day moving average
MA50: 50-day moving average
MA100: 100-day moving average
MA200: 200-day moving average
MACD: Moving average convergence divergence
Risks
External author:
This information is in the sole responsibility of the guest author and does not necessarily represent the opinion of Bank Vontobel Europe AG or any other company of the Vontobel Group. This information is sponsored by Bank Vontobel Europe AG, which may be a counterparty to transactions involving the financial instruments discussed in this information. The further development of the index or a company as well as its share price depends on a large number of company-, group- and sector-specific as well as economic factors. When forming his investment decision, each investor must take into account the risk of price losses. Please note that investing in these products will not generate ongoing income.
The products are not capital protected, in the worst case a total loss of the invested capital is possible. In the event of insolvency of the issuer and the guarantor, the investor bears the risk of a total loss of his investment. In any case, investors should note that past performance and / or analysts' opinions are no adequate indicator of future performance. The performance of the underlyings depends on a variety of economic, entrepreneurial and political factors that should be taken into account in the formation of a market expectation.
Disclaimer:
This information is neither an investment advice nor an investment or investment strategy recommendation, but advertisement. The complete information on the products (securities) mentioned herein, in particular the structure and risks associated with an investment, are described in the base prospectus, together with any supplements, as well as the final terms relating to the securities. The base prospectus and final terms constitute the solely binding sales documents for the products mentioned herein. It is recommended that potential investors read these documents before making any investment decision. The documents and the key information document are published on the website of the issuer, Vontobel Financial Products GmbH, Bockenheimer Landstrasse 24, 60323 Frankfurt am Main, Germany, on https://prospectus.vontobel.com and are available from the issuer free of charge. The approval of the prospectus should not be understood as an endorsement of the securities. The securities are products that are not simple and may be difficult to understand. This information includes or relates to figures of past performance. Past performance is not a reliable indicator of future performance. This information may only be distributed or published in countries where such distribution or publication is permitted by applicable law. As stated in the relevant base prospectus, the distribution of the securities mentioned in this information is subject to restrictions in certain jurisdictions. This advertisement may not be reproduced or redistributed without prior permission by Vontobel.
© Bank Vontobel Europe AG and / or affiliated companies. All rights reserved.