Are Alibaba and Gold in for a rebound?


This week we look at Alibaba, where splitting up the business can revitalise operations. The US debt ceiling deal boosted equity markets on Friday. Gold prices could also recover, supported by a weaker USD
Case of the week: Business split might make the Alibaba share rebound
Alibaba published its financial statement for Q1 2023 on Friday, 18th May. At first glance, the company’s performance was less than satisfactory. The growth rate of year-to-year revenue was only 2%. The income from operations decreased by 9% year-over-year. But the net result improved from a loss of RMB 18,357 million to a net profit of RMB 21,996 million (USD 3,203 million) primarily due to net gains from equity investments in publicly traded companies. However, there is a political risk in Alibaba. Rumours of an impending break up of Alibaba have been swirling since the founder of Alibaba, Jack Ma, who has been bold enough to question the Communist Party’s decision and suggested specific regulatory changes being needed. The authorities in China do not like the idea of a sizeable non-state-owned enterprise outshining the party. China has taken a series of actions against big tech as tightening rules on data security or clamping down on alleged monopolistic behaviour. Some people believed that the forced disaggregation of Alibaba was only a matter of time. Combining those concerns with the ungratified financial result, Alibaba stocks falling the next day after the report’s release should not cause much surprise.
Many countries suffered from a rapid acceleration of core inflation since mid-2021. On the other hand, removing strict Covid restrictions from December last year was generally seen as positive for the Chinese economy. Many anticipated a solid rebound in economic activity. Unexpectedly, revenue generation from the home market declined by 2% in Q1 2023, while the international market increased by 1%. The company’s once relentless growth has run out of steam due to server market competition Alibaba has experienced. TikTok, owned by ByteDance, is seen by merchants as the leader in live-streaming e-commerce. At the same time, Nasdaq -listed Pinduoduo has a leading position in the rural and low-cost e-commerce market.
In this challenging market environment, Alibaba split the empire into six units. The board has approved a complete spin-off of the Cloud Intelligence Group to become an independent publicly listed company. Alibaba has a favourable position in the cloud computing market and aims to compete with established U.S. giants such as Microsoft and Amazon. Moreover, the company will start price cuts to its cloud computing services which will inevitably trigger a price war. The strategy was designed similarly to Tesla; price reduction would boost demand and increase pressure on rivals, which may wipe out several competitors.
The fact that Alibaba is constantly being eaten up by its peers in the e-commerce market proves that it can't cope with business challenges by spending large amounts of money on acquisitions and creating monopolies. The technological revolution is destined to breed a new generation of information flow and new product ecology, and only companies that still retain the spirit of adventure and innovation will be able to seize the opportunities. However, after a weak share price performance and considering the strategic decisions taken, Alibaba shares look attractive.
Alibaba (in HKD), one-year daily graph

Alibaba (in HKD), five-year weekly grap

Bullish signs in S&P 500 but Nasdaq 100 is flying
After being closed on Monday, S&P 500 is trading above the resistance of around 4,200. That is positive. Momentum is also positive and increasing, as visualised by MACD. But one should note how the ceiling of a narrow rising trend channel is closing up. If this can also be broken, the way up to levels around 4,300 should be a smooth ride from a technical perspective.
S&P500 price chart (in USD), one-year daily chart

Yet another bullish sign can be found in the weekly chart, as the index is trading above its MA200.
S&P500 price chart (in USD), five-year weekly chart

Nasdaq 100 is flying and is currently trading above resistance around 14,300. Closing of the gap from early April 2022, around 14,800, is subsequent.
Nasdaq 100 (in USD), two-year daily chart

Nasdaq 100 (in USD), weekly five-year chart

Meanwhile, the OMXS30 is struggling to break up above the resistance in Sweden. Selling pressure on the index-heavy banks is not helping out. MACD is falling, but the index is still trading above its shorter moving averages (EMA9 and MA20), serving as the first levels of support.
OMXS30 (in SEK), two-year daily chart

OMXS30 (in SEK), weekly five-year chart

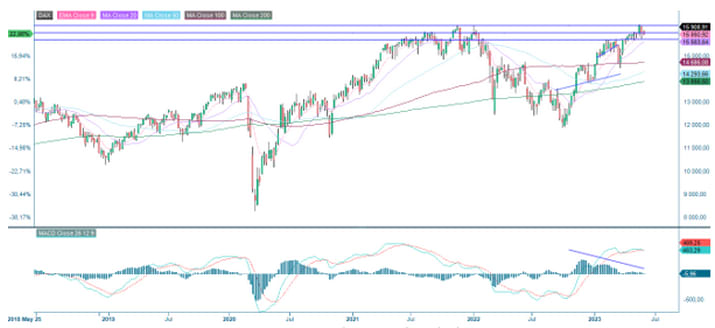
The German DAX is also struggling to break resistance. The index is below the shorter moving averages. The next level on the downside is MA50, currently at 15,711.
DAX (in EUR), two-year daily chart

DAX (in EUR), weekly five-year chart
Can the market find value in gold again?
Gold has been having a rough time and has fallen. The chart below shows that the gold price is currently trading at support. Yesterday, rates in the US were down. Meanwhile, the USD weakened. Can investors find value in gold again with help from a weaker USD?
Gold (in USD), two-year daily chart

The instruments below have the underlying SEK per 1 EUR.
MA200 serves as a support in the weekly chart.
Gold (in USD), weekly five-year chart

General market comments: US debt ceiling deal positive for markets
US stocks continued to rise on Friday, 26 May, supported by further tech stock gains. The S&P 500 rose by 1.3%, the Nasdaq by 2.2%, and the Dow Jones by 1%. Over the weekend, an agreement in principle was reached between Biden and Republican leaders on the US debt ceiling. The US Senate and the House of Representatives must approve the two-year deal.
IT stocks lifted US equity markets while energy and a few other defensive sectors fell on Friday, 26th May. Nvidia released a strong Q1 earnings report on Wednesday, 24 May, with profits 18.5% higher than analysts had expected. Nvidia shares rose 24.6% in the 24 hours following the report and gained a further 2.5% on Friday 26th. Other strong performers on Friday included Broadcom (+11.5%), which will release its Q1 results on Thursday, 1st June. Similarly, Micron shares rose 6.2% on Friday, 26 May and Gap shares gained 12% after the company's Q1 2023 report showed stronger-than-expected margins.
Today, Wednesday 31st May, at 14.00 CET, we will get the Euro-zone Consumer Price Index (CPI) figure in May, following the CPI figures from Germany, France and Italy a few hours earlier. The market expects German inflation to have been 0.6% in May 2023, up from 0.4% in April and 7.2% to 7.3% year-on-year.
Thursday, 1 June, is dominated by industrial Purchasing Managers’ Indices (PMIs) from Japan, China, Spain, Italy, France, Germany, the UK and the US. We also get German retail sales for April. From the US, we have Challenger layoffs for May, the ADP national private employment report for May, weekly jobless claims and construction spending for April.
US Non-Farm Payrolls on Friday the 2nd will be an essential input ahead of the Fed meeting on the 13th and 14th. Market expectations are for 180,000 new jobs in May, down from 253,000 in April. A stronger-than-expected result could tip the scales favouring a Fed rate hike.
Significant stock indices performance in one week, one month and three months

Significant stock indices performance in five years
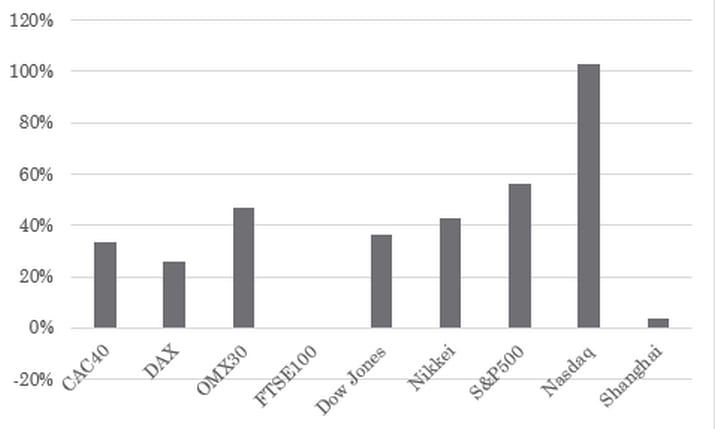
The previous chart shows that the Nasdaq and the Nikkei have been the best-performing indices in recent weeks and months. Meanwhile, the US volatility index (VIX) remains at record lows.
VIX, one-year daily chart

This week (29 May-2 June), nine S&P500 companies are scheduled to report Q1 2023 results. Salesforce reports its Q1 2023 figures on Wednesday, 31 May, while Broadcom reports quarterly figures on Thursday, 1 June.
The average earnings per share surprise are 8.4%, and the median is 5.5% for the large-cap S&P500 companies reporting since 21 March. Share price movements following these quarterly reports have been 0.2% on average and -0.1% on median.
The full name for abbreviations used in the previous text:
EMA 9: 9-day exponential moving average
Fibonacci: There are several Fibonacci lines used in technical analysis. Fibonacci numbers are a sequence of numbers in which each successive number is the sum of the two previous numbers.
MA20: 20-day moving average
MA50: 50-day moving average
MA100: 100-day moving average
MA200: 200-day moving average
MACD: Moving average convergence divergence
Risks
External author:
This information is in the sole responsibility of the guest author and does not necessarily represent the opinion of Bank Vontobel Europe AG or any other company of the Vontobel Group. This information is sponsored by Bank Vontobel Europe AG, which may be a counterparty to transactions involving the financial instruments discussed in this information. The further development of the index or a company as well as its share price depends on a large number of company-, group- and sector-specific as well as economic factors. When forming his investment decision, each investor must take into account the risk of price losses. Please note that investing in these products will not generate ongoing income.
The products are not capital protected, in the worst case a total loss of the invested capital is possible. In the event of insolvency of the issuer and the guarantor, the investor bears the risk of a total loss of his investment. In any case, investors should note that past performance and / or analysts' opinions are no adequate indicator of future performance. The performance of the underlyings depends on a variety of economic, entrepreneurial and political factors that should be taken into account in the formation of a market expectation.
Disclaimer:
This information is neither an investment advice nor an investment or investment strategy recommendation, but advertisement. The complete information on the products (securities) mentioned herein, in particular the structure and risks associated with an investment, are described in the base prospectus, together with any supplements, as well as the final terms relating to the securities. The base prospectus and final terms constitute the solely binding sales documents for the products mentioned herein. It is recommended that potential investors read these documents before making any investment decision. The documents and the key information document are published on the website of the issuer, Vontobel Financial Products GmbH, Bockenheimer Landstrasse 24, 60323 Frankfurt am Main, Germany, on https://prospectus.vontobel.com and are available from the issuer free of charge. The approval of the prospectus should not be understood as an endorsement of the securities. The securities are products that are not simple and may be difficult to understand. This information includes or relates to figures of past performance. Past performance is not a reliable indicator of future performance. This information may only be distributed or published in countries where such distribution or publication is permitted by applicable law. As stated in the relevant base prospectus, the distribution of the securities mentioned in this information is subject to restrictions in certain jurisdictions. This advertisement may not be reproduced or redistributed without prior permission by Vontobel.
© Bank Vontobel Europe AG and / or affiliated companies. All rights reserved.