The trend towards value stocks favourable for Dow Jones


The trend of falling inflation and lower long-term interest should benefit value stocks. In recent quarters, orders have been firm for industrial and capital goods. One way to get such exposure is via the Dow Jones Industrial Index.
Major stock markets have traded slightly lower ahead of the US Consumer Price Index (CPI) figures for November today and the Fed's interest rate decision tomorrow, Wednesday, 14 December. The US Producer Price Index (PPI) figures for November were slightly higher than anticipated, 0.3% against expectations of 0.2%. But in annual terms, inflation in the US has fallen from 9.7% in July to 7.4% in November 2022.
This is also reflected in the 10-year US Treasury yield, which has declined from 4.22% on 21 October to 3.61% as of 12 December 2022.
US 10-year Treasury Yield (in %)

At the same time, order intake for industrial goods remains good in Europe and the US, partly affected by previous major supply disruptions. One sector that invests heavily in industrial goods is, unsurprisingly, energy-producing companies. But the coming energy transition also drives demand and product development in the automotive sector. Businesses have been ordering more to ensure they receive the deliveries that have been delayed.
We believe that the current interest rate and inflation environment, which now seems to be falling back to a somewhat more stable and lower level, could be favourable for value stocks. That includes companies that can provide a high and stable dividend and whose businesses also benefit from the possibility of better-operating margins given lower input prices. Such companies are, for example, found in the engineering and construction sectors.
Despite these developments, the Dow Jones index has fallen back recently. This could offer an opportunity to invest in this index with giants such as Apple, Caterpillar, Coca-Cola, and General Electric, plus stable dividend stocks such as Walgreens Boots Alliance.
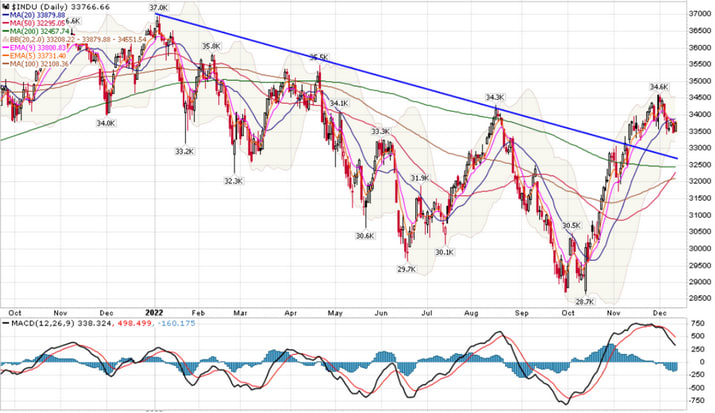
Dow Jones Industrial Index, a daily one-year graph
Related Products
Technically, the Dow Jones Industrial does not look that strong since it has fallen below MA20. At the same time, there is support further down in the form of the MA200 and MA100.
Dow Jones Industrial index, a weekly five-year share price chart

The full name for abbreviations used in the previous text:
EMA 5: 5-day exponential moving average
EMA 9: 9-day exponential moving average
Fibonacci: There are several Fibonacci lines used in technical analysis. Fibonacci numbers are a sequence of numbers in which each successive number is the sum of the two previous numbers.
MA20: 20-day moving average
MA50: 50-day moving average
MA100: 100-day moving average
MA200: 200-day moving average
MACD: Moving average convergence divergence
BB(20,2,0): Bollinger bands is a line used in technical analysis, it is a set of trendlines plotting two standard deviations away from the MA20.
Risks
External author:
This information is in the sole responsibility of the guest author and does not necessarily represent the opinion of Bank Vontobel Europe AG or any other company of the Vontobel Group. This information is sponsored by Bank Vontobel Europe AG, which may be a counterparty to transactions involving the financial instruments discussed in this information. The further development of the index or a company as well as its share price depends on a large number of company-, group- and sector-specific as well as economic factors. When forming his investment decision, each investor must take into account the risk of price losses. Please note that investing in these products will not generate ongoing income.
The products are not capital protected, in the worst case a total loss of the invested capital is possible. In the event of insolvency of the issuer and the guarantor, the investor bears the risk of a total loss of his investment. In any case, investors should note that past performance and / or analysts' opinions are no adequate indicator of future performance. The performance of the underlyings depends on a variety of economic, entrepreneurial and political factors that should be taken into account in the formation of a market expectation.
Disclaimer:
This information is neither an investment advice nor an investment or investment strategy recommendation, but advertisement. The complete information on the products (securities) mentioned herein, in particular the structure and risks associated with an investment, are described in the base prospectus, together with any supplements, as well as the final terms relating to the securities. The base prospectus and final terms constitute the solely binding sales documents for the products mentioned herein. It is recommended that potential investors read these documents before making any investment decision. The documents and the key information document are published on the website of the issuer, Vontobel Financial Products GmbH, Bockenheimer Landstrasse 24, 60323 Frankfurt am Main, Germany, on https://prospectus.vontobel.com and are available from the issuer free of charge. The approval of the prospectus should not be understood as an endorsement of the securities. The securities are products that are not simple and may be difficult to understand. This information includes or relates to figures of past performance. Past performance is not a reliable indicator of future performance. This information may only be distributed or published in countries where such distribution or publication is permitted by applicable law. As stated in the relevant base prospectus, the distribution of the securities mentioned in this information is subject to restrictions in certain jurisdictions. This advertisement may not be reproduced or redistributed without prior permission by Vontobel.
© Bank Vontobel Europe AG and / or affiliated companies. All rights reserved.