A light tremor in the market


This week's case concerns cocoa, where there is potential for future prices to rise if the decline in inventories predicted by estimates is realised. These estimates are based on growing concerns about adverse weather conditions and production disruptions in the Ivory Coast and Ghana. From a broader view of the stock market, the strong US non-farm payroll figures released on Friday 5 June were followed by a sharp decline in US indices, particularly tech-related stocks.
Case of the week: Cocoa is looking like a sweet deal for H2 2026
Despite the recent softness in cocoa prices in the short term, the underlying supply and demand situation suggests a significant increase in the second half of 2026. The bearish narrative is dominated by short-term, sentiment-driven factors such as demand concerns highlighted by Barry Callebaut's lower volume guidance, increased ICE inventories and a temporary increase in Ivory Coast shipments. However, these developments are only temporary. The overarching story is one of a tightening global balance, deteriorating West African production and an increasing risk of adverse weather conditions. Taken together, there is a stronger case for cocoa prices rising in the second half of 2026
The bearish performance of cocoa futures can be explained by a variety of factors. Firstly, in terms of supply, inventories have been increasing, with ICE cocoa warehouse inventory approaching 3 million bags — a level not seen since summer 2024. This increase in inventory is partly due to stronger flows from the Ivory Coast, the world's leading cocoa producer. By mid-May, arrivals for the 2025/26 season had reached just over 1.6 million metric tons in the Ivory Coast, marking a 1.3% year-on-year increase. Favourable weather during the main harvesting season, which runs from September to February, has facilitated this increased shipping. In terms of demand, grinding in mature markets fell year on year in Q1, with decreases of 3.8% and 7.8% in North America and Europe respectively. Finally, chocolate producer Barry Callebaut has provided new guidance suggesting a slower sales recovery than previously assumed, indicating that higher prices may have been affected demand. Considering the increased volatility in cocoa prices, the chocolate producer has also indicated a strategic shift towards higher-priced, niche products, clearly moving away from large-volume, medium-priced production.
While the recent negative developments in the cocoa market justify the current pessimism surrounding cocoa futures, but several positive factors suggest that the second half of 2026 may be more promising. Several forecasts estimate that the global surplus is shrinking. For example, StoneX has cut its surplus forecast for 2026/27 to 149,000 tonnes, down from an earlier estimate of 267,000 tonnes. Rabobank has made a similar revision, reducing its estimate from 328,000 to 250,000 tonnes. These revisions are based on growing concerns about adverse weather conditions and production disruptions in the Ivory Coast and Ghana. Recent rainfall has been insufficient for the crops, and below-average Cherelle formation indicates a weaker main harvest later in the autumn. This risk is further compounded by the expected El Niño weather pattern. NOAA estimates an 82% probability of the phenomenon emerging in July. Furthermore, NOAA estimates a 96% chance that the phenomenon will persist throughout winter and a 67% chance of a 'Super El Niño' event in the second half of 2027. El Niño causes significant disruption to cocoa farming in West Africa by exacerbating the already dry conditions with extreme heat and drought.
The current weakness in the cocoa market is driven by short-term sentiment, specifically the cautious outlook of one chocolatier, cyclical inventory rebuilding and a temporary increase in shipments from Ivory Coast. However, none of these factors affect the fact that, in the long term, the global cocoa balance is extremely tight and moving towards a deficit. This is happening at a time when the most significant weather risk in years is bearing down on a drought-stricken and underinvested West African crop. Therefore, there is a case for a long cocoa trade that will pay off as El Niño moves from theory to reality.
Related Products
Cocoa Jul ’26 future (USD/ton), one-year daily chart

Cocoa Jul ’26 future (USD/ton), five-year weekly chart

Macro comments
Following a prolonged period of significant price increases in global stock markets, driven by anticipation surrounding AI companies, a sharp rebound occurred on Friday, 5 June, with the NASDAQ and S&P 500 experiencing respective declines of 4.2% and 2.6%. It was technology stocks, especially semiconductors, that led the decline. However, on Monday 8 January, the S&P 500 has increased by 0.3%, while the Nasdaq had risen by 0.9%. It seems then the market is not giving up on tech.
This price rebound can be attributed to concerns about interest rates following the unexpectedly strong US non-farm payroll figure of 172 thousand new jobs in May, compared to an expected figure of95 thousand. The yield on the ten-year US government bond rose by 10 basis points to 4.57%.
The situation was further exacerbated by renewed fighting between Israel and Iran, despite previous ceasefires involving the United States and other parties in the Middle East. Furthermore, Ukraine recently carried out powerful drone attacks on St. Petersburg and the nearby Kronstadt naval base.
Today, Wednesday 10 June, we receive an interim report from the US company Oracle. The Norwegian Kongsberg Group and the Swedish Volvo each arrange their own capital markets day. Turning to the macro statistics, the producer price index in May from Japan and China and the consumer price index in May from China will be analised. The consumer price index in May from Denmark and Norway are also expected. The SCB inSweden publishes industrial orders, household consumption and a GDP indicator for April. The USA will contribute the consumer price index in May and weekly oil stocks from the Department of Energy.
On Thursday, 11 June, Adobe is scheuled to publish an interim report. from the US company. In terms of macro statistics, Statistics Sweden will publish the consumer price index for May. The ECB will announce an interest rate decision. OPEC's monthly oil report will also be released. Meanwhile, the US will release the producer price index and weekly jobless claims.
On Friday 12 June, starting with the macro statistics, Japan's industrial production figures for April will be analised. This will be followed by the UK's April GDP and industrial production figures. We will also receive the consumer price indices for Germany, France and Spain for May. The US will release the Michigan Consumer Sentiment Index (see graph below).
US Michigan Consumer Sentiment, five-year monthly chart

Keep an eye on oil prices, a key signal for equities’ next move
Following the strike at Kuwait airport and the subsequent naval tensions in the Strait of Hormuz, equities have fallen globally. Oil prices jumped while equities fell. However, as oil prices have now started to ease, there are early signs that momentum is improving. As the chart below shows, the S&P 500 has bounced back from the 7,350-support level. Breaking back above the 20-day moving average and 7,500 would pave the way for a retest of the previous highs, which are just above 7,600. Nevertheless, keep a close eye on oil, which is approaching a technical inflection point. A clear break below USD 90 per barrel would likely provide equities with an additional tailwind.
Related Products
S&P 500 (in USD), one-year daily chart

S&P 500 (in USD), five-year weekly chart

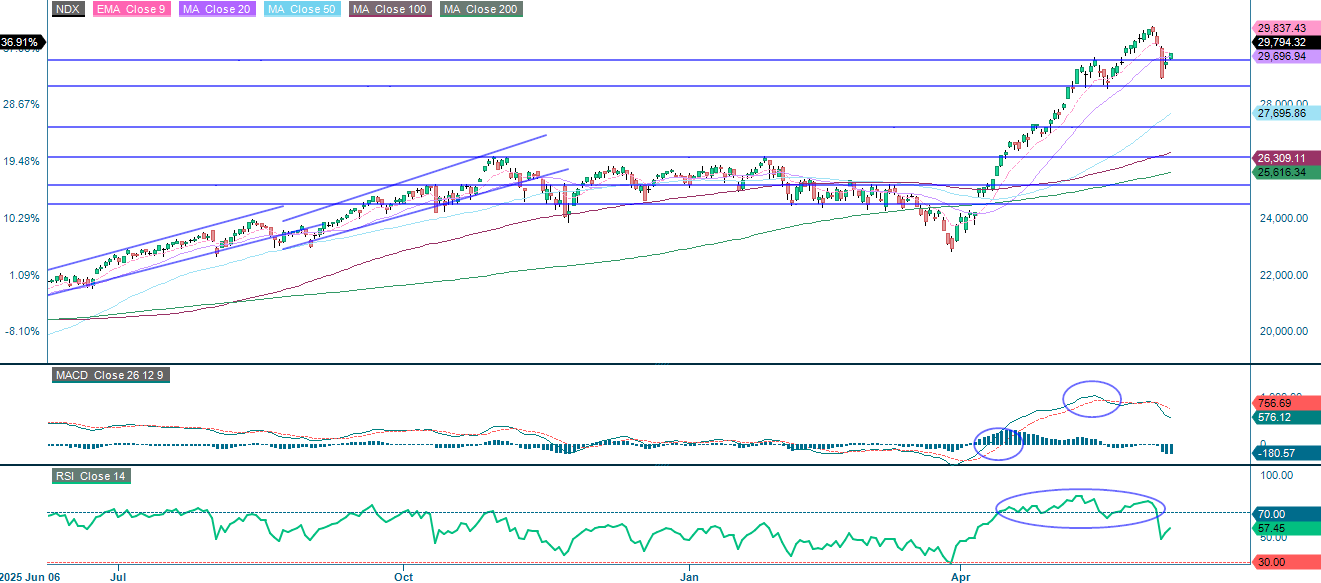
In this instance, tech has proven vulnerable to geopolitical disruption. Additionally, the prospect of a SpaceX IPO has reignited discussions about capital rotation, putting pressure on the sector. The Nasdaq 100 is currently approaching resistance at MA20 and EMA9. Breaking cleanly above these levels would put the previous peak, just above 35,650, back in play. On the downside, initial support sits around 28,650.
Related Products
NASDAQ-100 (in USD), one-year daily chart
NASDAQ-100 (in USD), five-year weekly chart

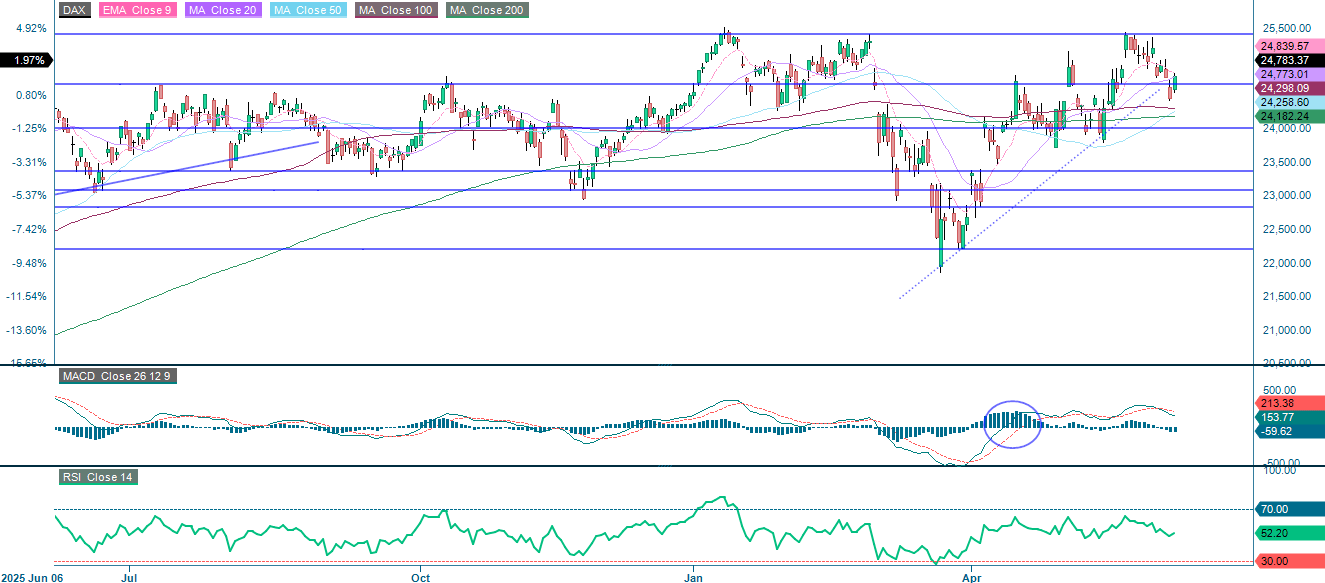
In Germany, the DAX is currently trading below both the 9-day exponential moving average (EMA9) and the 20-day moving average (MA20), suggesting that recent positive momentum is being tested ahead of Thursday’s European Central Bank (ECB) interest rate decision. A move back above the 20-day MA would be constructive and could pave the way for new highs.
Industrial and automotive stocks came under pressure mid-week due to higher energy input costs. However, given that oil prices are now starting to ease again, a stronger near-term rebound in the DAX relative to the S&P 500 looks plausible.
Related Products
DAX (in EUR), one-year daily chart
DAX (in EUR), five-year weekly chart

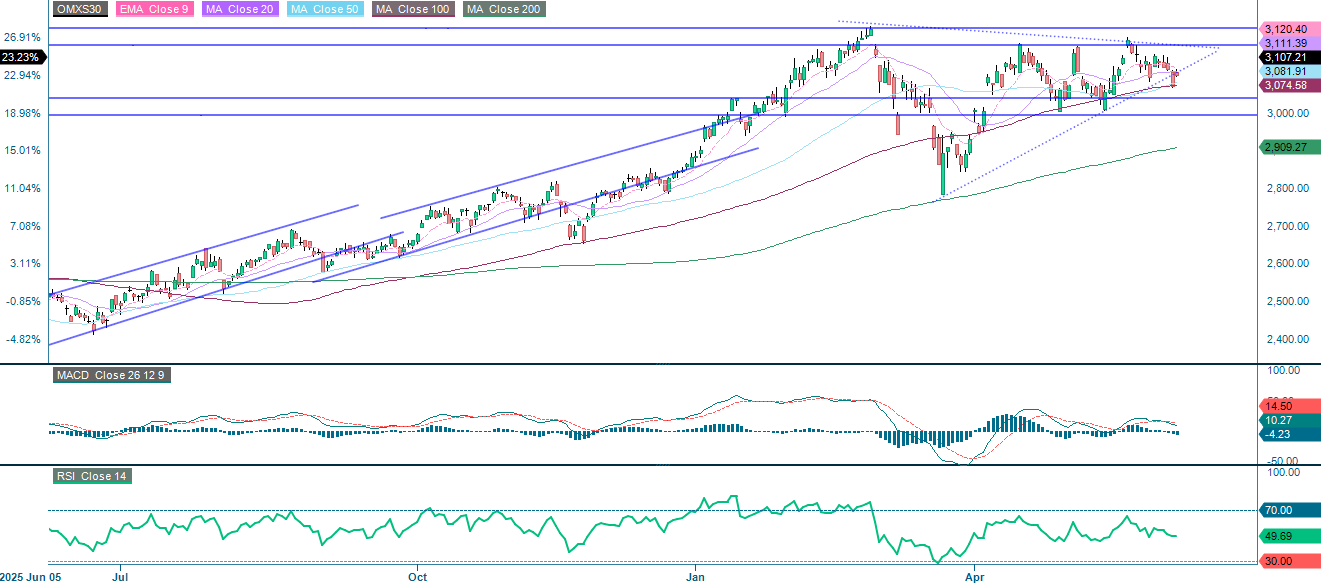
In Sweden, the OMXS30 is trading below the 20-day moving average (MA), which is currently acting as resistance. However, it remains above the 50-day and 100-day MAs, which continue to provide support. Breaking back above the 20-day MA would be positive and could pave the way for a move towards 3,180. Conversely, a downside break would initially focus attention on 3,040, with 3,000 being the next key level.
OMX30 (in SEK), one-year daily chart
OMX30 (in SEK), five-year weekly chart

The full name for abbreviations used in the previous text:
EMA 9: 9-day exponential moving average
Fibonacci: There are several Fibonacci lines used in technical analysis. Fibonacci numbers are a sequence in which each successive number is the sum of the two previous numbers.
MA20: 20-day moving average
MA50: 50-day moving average
MA100: 100-day moving average
MA200: 200-day moving average
MACD: Moving average convergence divergence
Risks
Credit risk of the issuer:
Investors in the products are exposed to the risk that the Issuer or the Guarantor may not be able to meet its obligations under the products. A total loss of the invested capital is possible. The products are not subject to any deposit protection.
Currency risk:
If the product currency differs from the currency of the underlying asset, the value of a product will also depend on the exchange rate between the respective currencies. As a result, the value of a product can fluctuate significantly.
Market risk:
The value of the products can fall significantly below the purchase price due to changes in market factors, especially if the value of the underlying asset falls. The products are not capital-protected
Product costs:
Product and possible financing costs reduce the value of the products.
Risk with leverage products:
Due to the leverage effect, there is an increased risk of loss (risk of total loss) with leverage products, e.g. Bull & Bear Certificates, Warrants and Mini Futures.
External author:
This information is in the sole responsibility of the guest author and does not necessarily represent the opinion of Bank Vontobel Europe AG or any other company of the Vontobel Group. This information is sponsored by Bank Vontobel Europe AG, which may be a counterparty to transactions involving the financial instruments discussed in this information. The further development of the index or a company as well as its share price depends on a large number of company-, group- and sector-specific as well as economic factors. When forming his investment decision, each investor must take into account the risk of price losses. Please note that investing in these products will not generate ongoing income.
The products are not capital protected, in the worst case a total loss of the invested capital is possible. In the event of insolvency of the issuer and the guarantor, the investor bears the risk of a total loss of his investment. In any case, investors should note that past performance and / or analysts' opinions are no adequate indicator of future performance. The performance of the underlyings depends on a variety of economic, entrepreneurial and political factors that should be taken into account in the formation of a market expectation.
Disclaimer:
This information is neither an investment advice nor an investment or investment strategy recommendation, but advertisement. The complete information on the products (securities) mentioned herein, in particular the structure and risks associated with an investment, are described in the base prospectus, together with any supplements, as well as the final terms relating to the securities. The base prospectus and final terms constitute the solely binding sales documents for the products mentioned herein. It is recommended that potential investors read these documents before making any investment decision. The documents and the key information document are published on the website of the issuer, Vontobel Financial Products GmbH, Bockenheimer Landstrasse 24, 60323 Frankfurt am Main, Germany, on https://prospectus.vontobel.com and are available from the issuer free of charge. The approval of the prospectus should not be understood as an endorsement of the securities. The securities are products that are not simple and may be difficult to understand. This information includes or relates to figures of past performance. Past performance is not a reliable indicator of future performance. This information may only be distributed or published in countries where such distribution or publication is permitted by applicable law. As stated in the relevant base prospectus, the distribution of the securities mentioned in this information is subject to restrictions in certain jurisdictions. This advertisement may not be reproduced or redistributed without prior permission by Vontobel.
© Bank Vontobel Europe AG and / or affiliated companies. All rights reserved.